
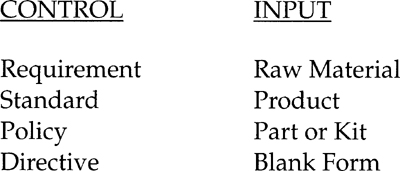
Chapter 6. Do’s and Don’ts
The previous chapters define the IDEFO method in terms of its concepts, its language, and its pragmatics. To be considered formal, any method needs to have a documented set of rules that must be obeyed, and IDEFO has proven itself to be a formal method. For example, one IDEFO syntax rule is that there may not be more than six activities on a diagram; a semantics rule is that a label on an arrow branch restricts the flow of data on that branch; and a pragmatics rule is that the arrows on a diagram should be bundled to match the level of detail of the activities on that diagram.
Since the formal elements of the IDEFO method have thus been defined above, this book could end here and be a complete description of IDEFO. However, the experience of analysts applying SADT and IDEFO during the past twenty years have revealed numerous misuses of the method—misuses that are instructive and that, when studied, should be helpful to every user of IDEFO. Misuses are presented in this final chapter with the hope that awareness of them will help future IDEFO analysts avoid them.
There are many do’s and don’ts—the list seems almost endless. In this chapter, I set down the most common ones from my experience, organizing them into three categories: language rules, model quality (quality measurements and subjective assessment recommendations), and modeling project management issues.
Language Rules
As a starting point, let’s take a look at the IDEFO language rules that apply to boxes, arrows, diagrams, and models (summarized in Table 6-1), especially in terms of specific misuses of the IDEFO method, problems that result from each misuse, and ways to correct or avoid each problem.
Box Rules
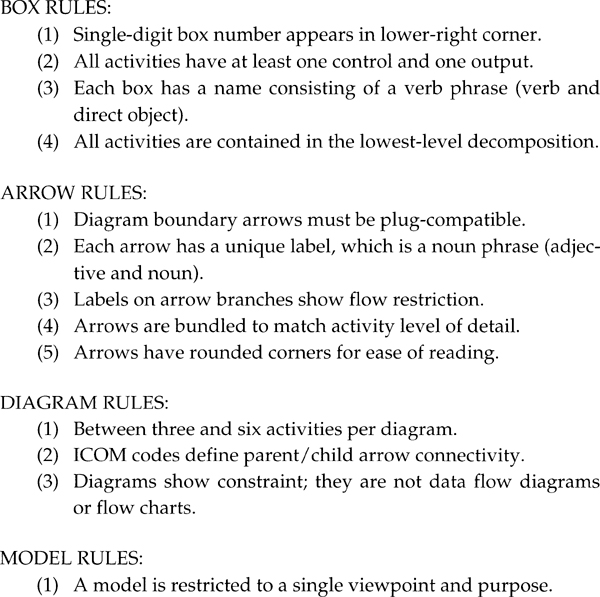
Box Rule 1 states that only single-digit numbers should be used, and that they must appear in the lower-right corner of an activity box. Many IDEFO authors have adopted the nonstandard convention of including the full node number in the lower-right corner of the box. Doing so violates the IDEFO FIPS standard, and causes problems at the detail levels of the model, where the node number becomes quite long.
The IDEFO reasoning for having a single-digit number in the lower-right corner of the box is that it uniquely identifies the activity box, since this number is appended to the diagram’s node number to give the full, unique box identifier. Using a single digit has the advantage that, no matter how large the model grows, the length of the identifying number never interferes with the box name. Also, since the node number is visible at the bottom left of the diagram form, a reader can easily determine the full node number of the box if necessary. Note that although some IDEFO computer support tools adopt other conventions for box numbers, the original type of single-digit box number should be used. Figure 6-1 illustrates both the original standard type and the nonstandard type of box number.
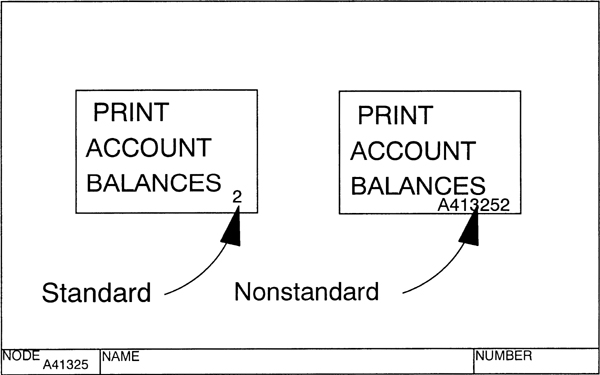
Box Rule 2 states that each activity box must have at least one control and at least one output (it may or may not have any input). The rationale behind the control arrow requirement is that no activity can operate unless it has something controlling it. This rule requires the modeler to pause and consider what controls can be added to the diagram if all the initial data items are attributed but an uncontrolled activity is identified. Similarly, each activity also must have an output, or what is the point of doing the activity?
It may seem logical that the rule would require an input, as well as a control and an output. However, in some instances, an activity does not modify an existing entity; it creates an original, new entity. The input may be thought of as being created by the mechanism (person or system) that performs the activity. Figure 6-2 shows standard and nonstandard examples.
The activity box KEEP PAYROLL ACCOUNTS on the left side of Figure 6-2 is syntactically correct. No input is necessary, but in this instance, some sort of payroll records should actually be included as an output to make the activity logically complete. However, adding Forms as an input, as shown on the right side of the figure, is incorrect, since Forms are merely a mechanism used to perform the activity.
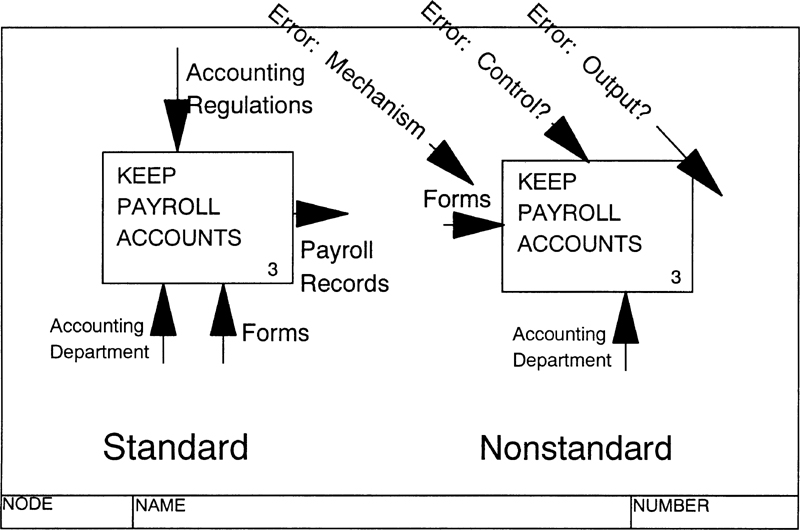
Box Rule 3 states that an activity box must have an active verb phrase as its title, since the activity box represents an action, as defined by its decomposition. Quite often, an organization (an accounting department or manufacturing design department, for example) becomes so closely associated with a particular function or set of activities that the IDEFO author may be tempted to use the organization name to label an IDEFO activity box. This is nonstandard, as such a name reflects organization-based decomposition, not functional analysis. In the organization-based breakdown shown on the right side of Figure 6-3, a gerund is used, but IDEFO requires that an active verb with its direct object modifiers (such as shown on the left side of the figure) be used in the correct naming process.
Box Rule 4 states that all activity details must be contained at the lowest decomposed level. It is true that some hierarchical modeling languages other than IDEFO include activities in the higher levels of the model, but in IDEFO, all activities are included in the most detailed child boxes in the model. The named parent box is just a placeholder for the decomposition—a hole into which may be plugged any activity diagram whose boundary arrows match (in structure and content) the arrows entering and leaving the parent box. The name helps communicate context to the reader but could logically be removed (leaving a blank box) without affecting the content of the model.
Arrow Rules
Arrow Rule 1 states that diagram boundary arrows must be plug-compatible. Of course, to be plug-compatible, the arrows entering and leaving a parent box must match (in structure and content) the boundary arrows of the decomposition (child) diagram. This is analogous to the concept of inserting electrical plugs into a receptacle: If the plug has three prongs, it will not fit into a receptacle having two holes. If there is a mismatch, then either some data has been omitted from the decomposition diagram or some data has mysteriously appeared in the decomposition without any record of its source or its destination in the parent diagram (see Figures 6-4 and 6-5, both of which depict the same model).

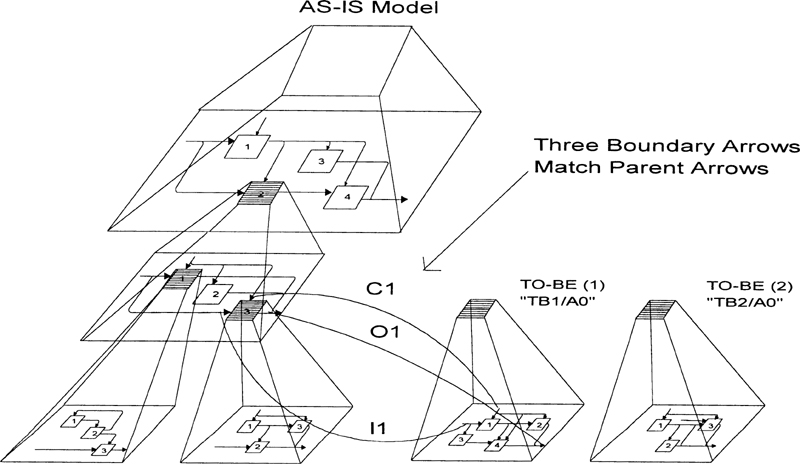
The IDEFO modeling rule that all activity must be shown at the lowest level facilitates creation of a schematic, which displays the bottom-most diagrams on a large sheet of paper, with boundary arrows connecting the diagrams. The schematic enables study of the entire model or just a selected branch of the whole model. Since the decomposition of each activity is therefore a black box, individual diagrams or even entire model segments can be plugged into the model without causing unwanted side effects. Such “plug-compatible diagrams” represent alternative ways to perform the same activity, permitting what-if analysis of potential cost or of time savings, for example, when considering alternative TO-BE variations of specific processes (see Figure 6-4).
Figure 6-5 shows that the parent box A23 (see Figure 6-4, for A23’s position) has one input, one control, and one output. This matches the two alternative TO-BE processes and demonstrates there is plug compatibility. Of course, the author must check to ensure that the content of the three arrows is compatible and that the physical arrow structure matches. Some modelers break Arrow Rule 1 by showing a parenthesis at the unconnected end of the boundary arrow instead of an ICOM code (such as II for input 1 or C2 for control 2). This practice is dangerous, especially if it is used instead of a data arrow that is needed by an activity.
Parentheses can be used with boundary arrows when any of the following three circumstances occurs. First, use parentheses when the data are only of interest at this level of detail, and when tracing the arrow throughout the model would add undue clutter to the model. Parentheses may indicate specific mechanisms for performing specific activities, such as know-how or education controls when these are the only controls on an activity. Second, use parentheses when the data represent an interface to another model, such as a model prepared from a different viewpoint. Third, use a parenthesis to indicate control or input data that may be included as a control or input on all activities in the decomposition.
In all cases, the modeler must include a note near the parenthesis indicating the source or target of the parenthetic data. This may be a DRE, indicating a location in an IDEFO model (either the current model or a related model), or a statement “To All Activities,” as in the third case described.
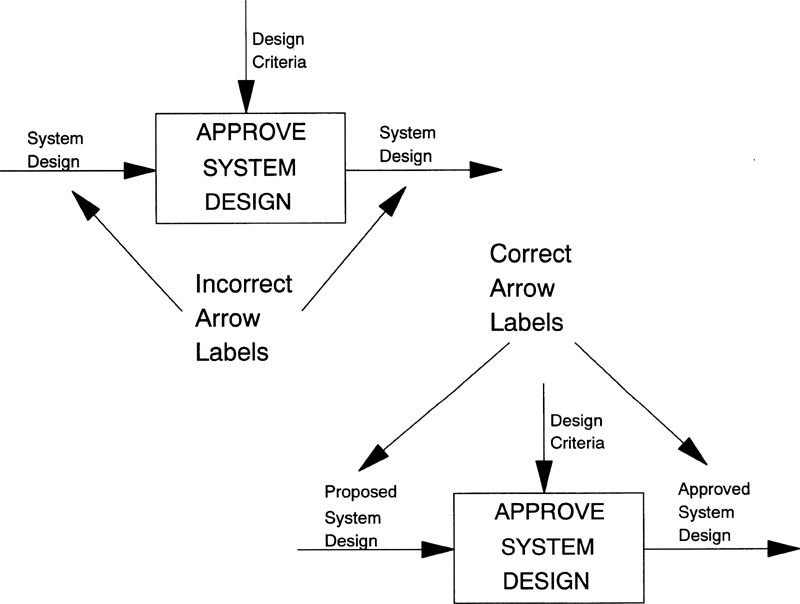
Arrow Rule 2 states that the label of each arrow must be unique. Logically, an arrow that is an input to an activity box cannot be the same arrow that is output from the box, since an input is modified by the activity to become an output. Typically, the author needs to add different adjectives to the output arrow labels, such as “revised” or “corrected,” to indicate the change brought about by the activity. The uniqueness of each arrow label is important for proper arrow definition, but it is indispensable for building a database to support the system being modeled. Figure 6-6 illustrates incorrect and correct arrow labels.
Note that this second arrow rule does not state that each branch of every arrow must have a unique label displayed on the diagram; it merely says that the same name may not be used for two different arrows.
Arrow Rule 3 treats branch flow-restriction. Recall that, under the definition of arrows given in Chapter 4, a subbranch contains all of the content of the main branch, unless restricted by a label on the subbranch. For example, an arrow that splits into two branches does not indicate that the original content divides equally. Nor does it mean that all of the indicated content travels on one subbranch while none follows the other branch—unless a label appears on the other branch to restrict the flow. The reader must always assume the most general case in IDEFO—that all of the content flows to all of the branches—without attaching undocumented meaning to arrow branching and joining (see Figure 6-7).
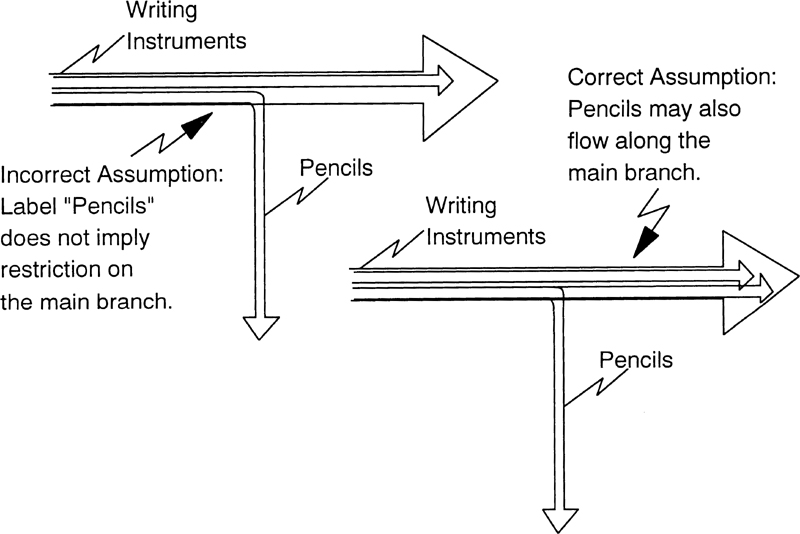
Figure 6-8 illustrates Arrow Rule 4 and shows how the use of rounded corners on arrows, rather than right-angle or square corners, improves the readability of an IDEFO diagram.
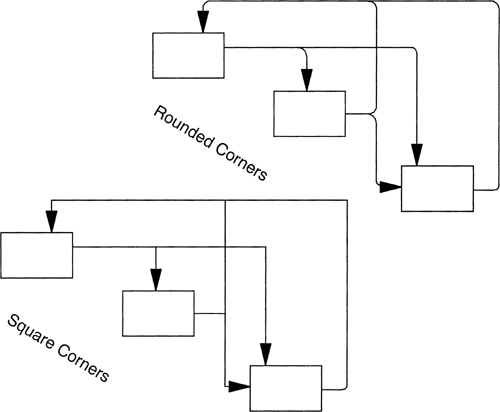
Diagram Rules
Diagram Rule 1 states that there should be between three and six activities per diagram. Much has been made in this book of the fewer-than-six rule, making it clear that a modeler trying to handle more than six activities on a single diagram would encounter too much complexity to permit the type of communication power desired. However, little has been said of the three-or-greater part of the rule.
Diagram Rule 1 is based on the fact that IDEFO is designed for functional analysis. If the author is modeling the logical functions of an enterprise, then specifying that at least three new activities are required in a decomposition results in a diagram that has a minimum amount of new detail. If a limit of only two activities were permitted, it would take the author considerably longer to reach the lowest level of detail. However, when the author is building an AS-IS model of an organization and the model is based on a familiar structural breakdown of activities, it is sometimes permissible to include a two-box activity diagram. This exception to Rule 1 is only applied when the natural enterprise structure has a two-way breakdown.
The argument for relaxing the method rule is that accomplishing the purpose of the model takes precedence over all else. That is, the model will communicate more to the user community if its structure matches a familiar, real-life structure rather than an unfamiliar model dictated by rules.
The three-activity minimum is intended for a model in which the author is exposing functional detail; it is not intended for an AS-IS picture that must be verified and for which consensus must be attained with the user community. An author may always obey the three-box rule, but this rigidity may lead to a less successful AS-IS model wherever natural two-way splits are encountered.
Diagram Rule 2 states that codes must be used to show connections between levels of decomposition. ICOM codes are off-page connectors used by IDEFO to uniquely connect the arrow interfaces at the boundary of the decomposition diagrams. The arrow connectivity of an IDEFO model cannot be verified unless the ICOM codes are displayed on the diagrams.
Most software tools have some convention for ensuring the parent/child connectivity using the ICOM code convention, such as automatically placing the ICOM codes from the parent box around the edges of the decomposition. Thus, if the author fails to connect the boundary arrows, he is left with ICOM code annotations around the edge of his new diagram, and the lack of connectivity is obvious to the reader. Any such diagram is logically incomplete, since the parent box shows all data items needed by the activity, but the child decomposition shows no use of one or more of those data items.
Diagram Rule 3 differentiates function-oriented IDEFO diagrams from data flow or process-oriented diagrams. Individual IDEFO activity boxes are intended to show multiple stimuli that produce one or more outputs whenever a prescribed set of inputs and controls are available. It is not necessarily true that for an activity to become active, all input and control arrows must contain data. Also, the content of the data included in an arrow may determine whether the activity activates, as well as whether outputs are produced.
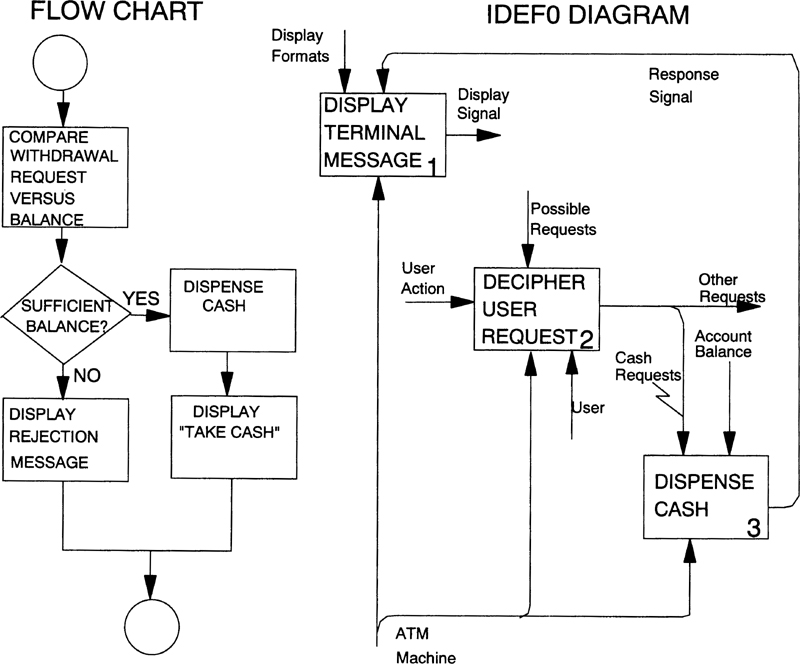
This concept differs from that of a flow chart. In a flow chart, each box represents a unique activation. The flow chart defines the precise sequence of activations. In addition, the flow chart shows flow only, and does not depict the input, control, and output data shown in an IDEFO diagram. Figure 6-9 illustrates the two types of diagrams.
Model Rule
The only rule applied to the entire model is Model Rule 1—the requirement that the entire model have a single purpose and a single viewpoint. If there is a need for modeling a different viewpoint or purpose, a second model must be developed, and links between the two models must be included at points where they intersect.
The model’s purpose is critical: The purpose must be clearly stated before modeling begins, or the modeling effort may become no more than an academic exercise. Bear in mind that the object of using IDEFO is not to develop a model, but to create a baseline from which improvements can be defined. To ensure that a proper purpose is developed, modelers should open the purpose statement on the A-0 diagram with the phrase: “The model will be used to. . .” By completing this statement with the objective to be achieved, and by examining each diagram as it is developed to see that it assists with the model’s purpose, modelers will enhance the likelihood that the benefits of the IDEFO modeling process will be achieved.
Likewise, the viewpoint of the model must be maintained as the subject is decomposed. By mixing more than one viewpoint in a single model, the author makes the model less communicative. The solution is to create a separate model for each viewpoint, connected via DRE or call arrows. The resultant models are much clearer, easier to manipulate, and easier to communicate to an audience than a single mixed-viewpoint model.
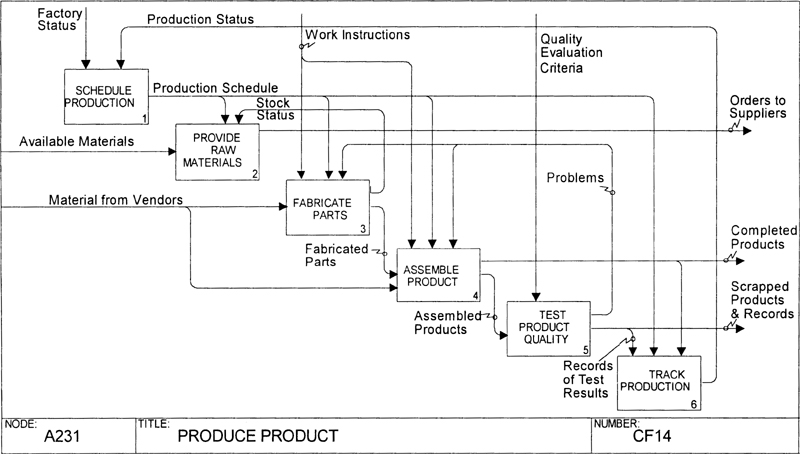
Figure 6-10 presents a manufacturing enterprise model in which several viewpoints are mixed on a single diagram. The resultant complexity becomes more apparent when we consider the background and training of the various personnel who perform the activities shown on the model. Table 6-2 lists these personnel and illustrates a way of separating viewpoints. On the left side of the table, familiar titles of manufacturing process personnel are listed. Although a separate model could be produced corresponding to the viewpoint of each job classification, such an approach would be costly, time consuming, and would not result in the desired clarification of the model’s complexity. Instead, a higher level of abstraction can be used to reduce the number of viewpoints required. That is, since personnel from a technical background typically can communicate with each other and have some knowledge of each other’s work processes, it would seem reasonable to group the fabrication and assembly staffs into a single technical viewpoint.
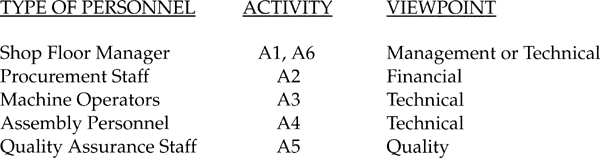
Taking this logic one step further, we can see that the shop floor manager must understand both the technical and the management viewpoints. However, he typically comes from a technical background and therefore probably fits best with the technical viewpoint model. The same logic might lead us to include the quality assurance staff in the technical viewpoint, but because so many quality initiatives are being pursued in today’s environment, having a separate quality viewpoint is probably worthwhile.
This leaves the procurement personnel, who purchase the raw materials for fabrication and assembly. Their responsibilities, such as negotiations with vendors, stocking of parts, and processing of invoices and requisitions, represent a separate mindset from the other viewpoints; therefore, we would do well to record the financial viewpoint on a separate model.
Given the selected technical, quality, and financial viewpoints, the following diagrams show division of the original, mixed model into three separate models, with interconnecting arrows added as needed for communication. These diagrams illustrate how diverse viewpoints should be modeled separately, with links between the three models provided using DREs.
Looking at Figure 6-11, the technical viewpoint diagram, we see that box 3 (output 2) sends samples for quality testing to box 2 of the quality viewpoint diagram. In return, problems discovered by quality testing are sent to the technical viewpoint diagram via output 1 of box 2 of the quality model, and are received by the technical viewpoint diagram in control 3 to boxes 2 and 3 of the technical viewpoint diagram.
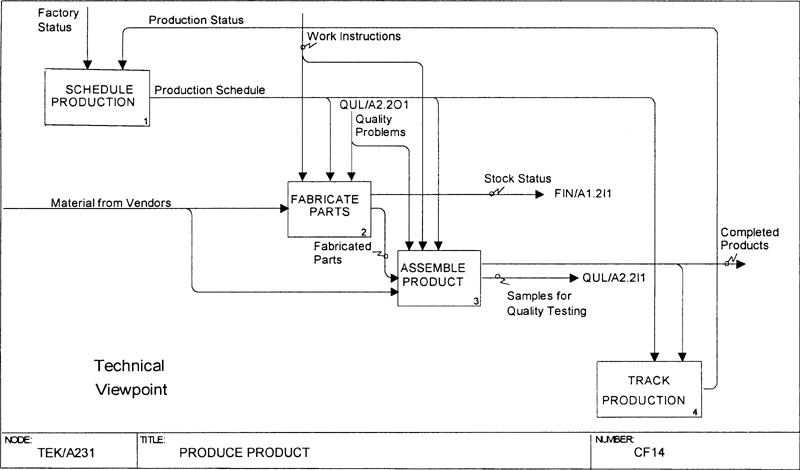
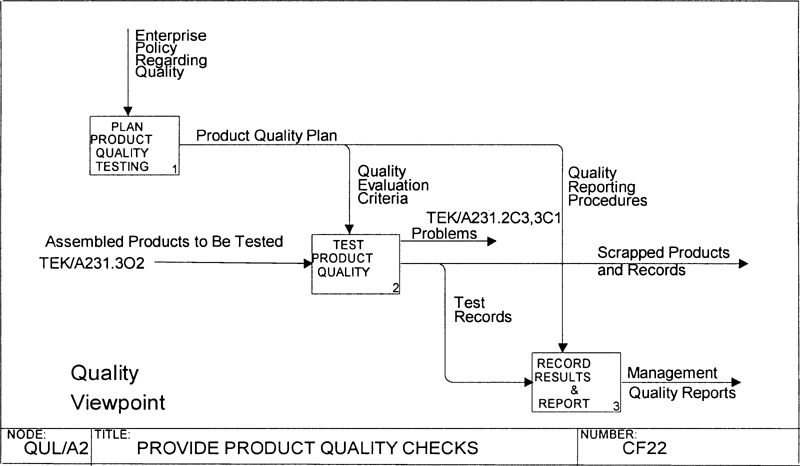

Similarly, the financial viewpoint model receives stock status via output 1 of box 2 of the technical viewpoint diagram. This is the only connection between the technical and financial viewpoint models, since the procurement people receive the stock status and issue purchase orders to obtain supplies when they run low (input 1 to box 2 and input 2 to box 3 of the technical viewpoint diagram).
In summary, the development of separate models for each viewpoint has the following advantages over development of a single model that mixes all viewpoints:
![]() Focused diagrams are comparatively simple and easy to understand and can be tailored to specific cultures of people in an enterprise.
Focused diagrams are comparatively simple and easy to understand and can be tailored to specific cultures of people in an enterprise.
![]() Readers whose background corresponds to the model’s focused viewpoint can understand the jargon and relate to details shown in the diagram.
Readers whose background corresponds to the model’s focused viewpoint can understand the jargon and relate to details shown in the diagram.
![]() IDEFO identifies interfaces between cultures (finance, management, quality assurance) as intersection arrows between the viewpoints; these intercultural interfaces typically represent key communication points, and they are often critical to any enterprise engineering effort.
IDEFO identifies interfaces between cultures (finance, management, quality assurance) as intersection arrows between the viewpoints; these intercultural interfaces typically represent key communication points, and they are often critical to any enterprise engineering effort.
![]() All viewpoints need not be decomposed to the same level of detail, thereby saving time, effort, and cost over decomposing a single model of all combined viewpoints.
All viewpoints need not be decomposed to the same level of detail, thereby saving time, effort, and cost over decomposing a single model of all combined viewpoints.
Model Quality Measurement
In addition to hard and fast rules, a method also needs a defined set of quality criteria. That is, IDEFO rules may be followed and the model produced may be standard IDEFO, but it may not be a good IDEFO model. This section identifies standards for attaining quality in IDEFO models and discusses how to avoid typical beginners’ mistakes when using IDEFO for the first time.
Quality Measurement Rule 1: Model Validation. The reader/author cycle review provides the best quality check of an IDEFO model. It enables the author’s peers to study the draft model and to formulate recommended improvements and corrections. It also provides a means of checking the communication power of the model, since if several readers have difficulty understanding a specific diagram, this tells the author that the diagram must be clarified before final release.
There have been instances when the reader/author cycle has broken down and the project manager has elected to abandon the method. The cause of the breakdown is typically the lack of response from the readers. The reader/author cycle is a critical aspect of IDEFO modeling, and readers must support the process with a conviction that they can make real improvements through this approach.
An alternative quality-check approach is the walkthrough session conducted with a group of readers. This approach to model validation is less successful than the individual readership approach of the reader/author cycle, but it is a reasonable alternative to achieve validation and consensus.
The walkthrough approach generally is less satisfactory than a reader/author cycle because of the following reasons: The reader has less time to contemplate model details and recommended improvements; the walkthrough leader may foist his viewpoint on the audience by presenting the facts as he understands them, thereby undercutting the communication power of the model itself; and, lastly, vocal, persuasive members of the audience may be able to push their preferences, whereas more valid points may be overlooked due to emotional pressure. The level of acceptance of the model is marked in the kit cover sheet (upper right-hand corner) to clearly indicate model stability and acceptance. (Refer back to Figure 5-14 for a sample cover sheet.)
The basic measure of a model’s quality is how it answers five general questions that support the purpose of the model and reveal the viewpoint covered by the model. These general-purpose model quality questions are
1. What controls each activity?
2. How does the activity respond to erroneous arrow content?
3. Is there any feedback to previously completed activities?
4. Which inputs and controls are used to produce each possible set of outputs?
5. Which events trigger activation of the diagram?
It is interesting to note that the last question treats the same concept as is currently becoming popular in the object-oriented methods community—the so-called use-case approach of Ivar Jacobson and others.1
1 I. Jacobson, et al. Object-Oriented Software Engineering: A Use-Case Driven Approach (Reading, Mass.: Addison-Wesley, 1992).
Still, there needs to be a way of measuring model quality that is easier to apply than the general one of asking whether the model satisfies the purpose. The only such indicator to date is the ability of the model to address additional questions of purpose; as each diagram is completed and reviewed, quality can be further tested by developing other relevant, focused questions.
If the model is an AS-IS model of current operations, and the goal is to identify problem areas that need improvement, then questions regarding current operations are in order. Furthermore, if the goal is to develop remedies for these problems, then the level of detail of the model can be queried to determine whether sufficient information is present to design a solution. If it isn’t, another decomposition layer or two is needed to provide additional detail. Some specific questions for checking quality in an AS-IS model are presented below.
1. Is there a single organization responsible for performing this activity? If not, further decomposition is needed.
2. Is there sufficient detail to determine operational cost, using activity-based costing?
If not, further decomposition is needed.
3. What additional facts does this decomposition diagram provide?
4. Are the new facts related to the purpose?
If they are not, try a different decomposition.
5. Are the new facts related to the viewpoint?
If not, determine where a viewpoint shift occurred.
Quality Measurement Rule 2: Fog Factor Testing. The best test of the communication power of a diagram is the reaction received from the reader/author cycle critique. A second, more mechanical test of the readability of the model is provided by analyzing a diagram’s cosmetic aspect: the layout, the number of arrows, and the arrow complexity, for example. This form of measuring diagram clutter tests the fog factor. Note that although the diagram may pass this test, it still may not be a high-quality diagram (that is, it may not present useful information, or it may use vague terminology on arrows and activities). However, if the diagram fails the fog factor test, it must be reworked if it is to fulfill its communication potential.
To calculate the fog factor, the modeler needs to answer a series of questions about a diagram. Each fog factor question has a numeric answer that is added to the prior sum to form a total fog factor. If this factor is greater than the maximum threshold, the diagram must be revised to reduce the factor. Each factor also has an individual maximum threshold, to prevent any one diagram element from being unreasonably complex. Fog factor questions and maximum threshold values are presented in Table 6-3.
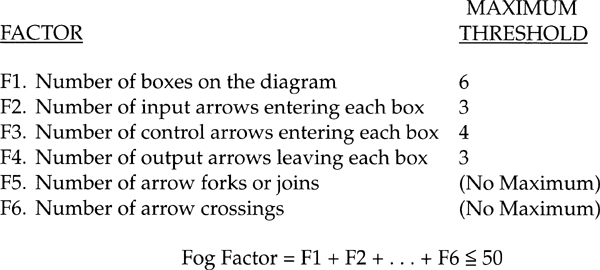
The fog factor formula adds the six basic sub-factors to produce a total value. If this value is above the suggested maximum, the diagram is too complex and needs to be reworked. A suggested maximum of fifty is used here, but a project may select its own maximum value, based on its readership.
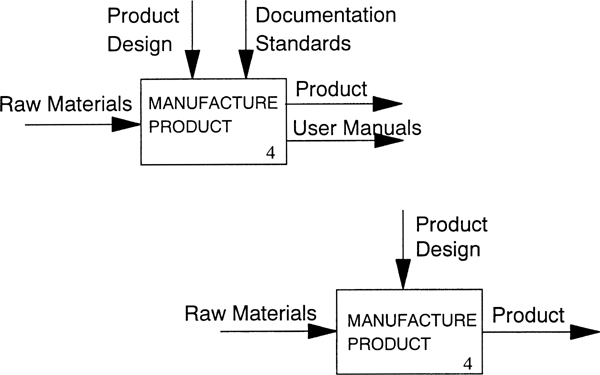
Quality Measurement Rule 3: Arrow Label Precision. Box names and arrow labels are important to the diagram’s message. Arrow labels are especially crucial, since the meaning of the box may be explored by studying its decomposition diagram but the meaning of the arrow is not so easily studied. (The reader would have to analyze the source and target of each arrow element to understand its complete meaning.) Furthermore, arrow labels give the reader early insight into what will occur in an activity box decomposition. Consider the arrow labels in the two treatments of MANUFACTURE PRODUCT in Figure 6-14. In the top example, the arrows show that user manuals are developed as part of the MANUFACTURE PRODUCT activity. In the bottom example, no such information is conveyed by the arrows. The box name could have been omitted in both cases, but the reader still could have inferred the name of the activity merely from the arrow labels.
Clearly, the label an author chooses for each arrow is critical in conveying meaning to the reader. How specific the arrow labels are provides an important indication of how good the model is. Two measures for judging the quality of box names and arrow labels can be derived from comparisons of function versus form and of explicitness versus vagueness. Figure 6-15 illustrates how varied names and labels might be used for the same box and arrows.
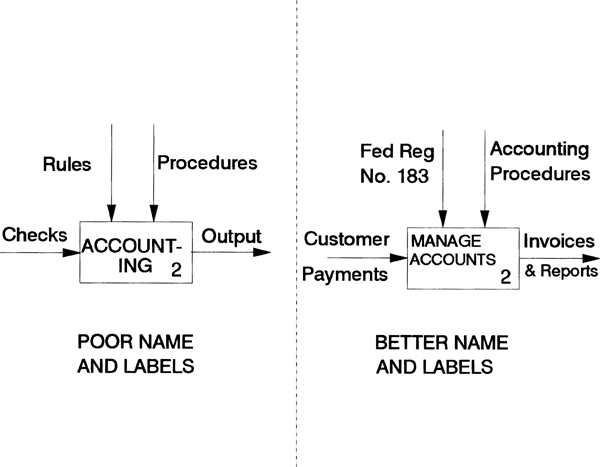
The labels on the arrows and the name of the box shown on the left side of the figure are vague and imprecise, chosen to focus on the form rather than the function. Arrow 211 is labeled Checks, which describes the form of the input, not its function. The input could just as easily have been provided by cash, wire transfer, or one of several other alternative forms. On the right side of the figure, the arrow 211 labeled Customer Payments is more functionally oriented and is not dependent on the form of transmission.
The box name on the left side of the figure is similarly form-oriented rather than functional. Also, it is not composed of a verb-and-noun phrase—as is standard for IDEFO—it is a gerund, a form of activity name that comes from organizational thinking. The use of this sort of nonstandard box name by an IDEFO author invariably means that he is thinking about the department rather than about what the department does—again, form instead of function; since a person from a different company’s accounting department might perform different activities, a better choice for the box name is MANAGE ACCOUNTS, as shown on the right-hand side of the figure.
The remaining arrow labels in the example at the left side of Figure 6-15 further illustrate names that lack precision: Not all company rules and procedures control box 2. Arrow labels should enable the reader to understand precisely what information is used by the activity, as is communicated in the diagram on the right. Similarly, the vague output label on 2O1 is vastly improved by the label Invoices & Reports.
Quality Measurement Rule 4: Simplistic Diagram Story. Sometimes, a kit of diagrams from an author may seem too simple. There may be almost no arrows, and few, if any, feedback arrow paths. To determine whether the kit of diagrams is, in fact, too simple, the author must evaluate his kit of diagrams by answering key questions and by submitting it to walkthroughs in which an audience of experts tests it in the context of typical situations and events. The author must explain the way his kit of diagrams handles each situation. For example, imagine a model for the activity of reviewing bids for new business. In Figure 6-16, the activity is decomposed into five sub-activities. At first glance, the diagram appears to represent a thorough breakdown of the process, and the story is easy to understand.
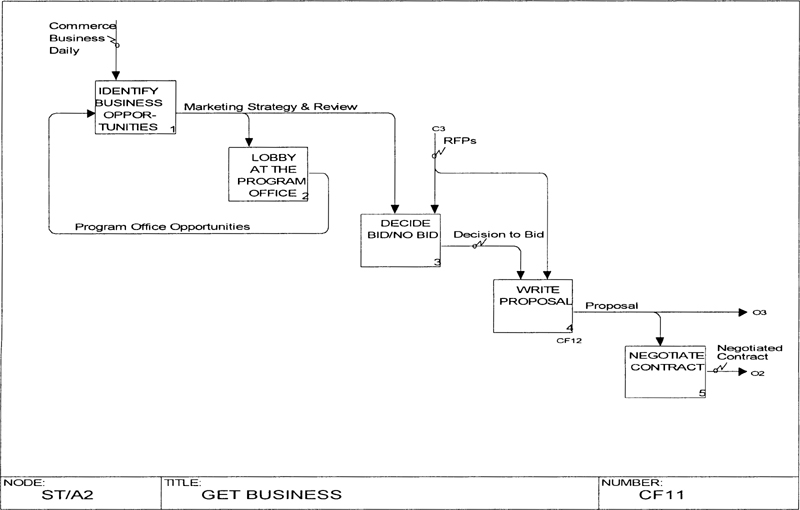
Box 1, IDENTIFY BUSINESS OPPORTUNITIES, is controlled by the CBD (Commerce Business Daily), which announces government business opportunities. Using this control, opportunities are pursued and passed along to lobbyists as part of the marketing strategy. Box 2, LOBBY AT THE PROGRAM OFFICE, uses this control to determine where there is a real opportunity. Based on the Program Office Opportunities feedback, specific opportunities are selected and used in the bid/no bid decision in box 3. If the decision is to bid, a proposal-writing effort is triggered, and the government’s request for proposal (RFP) is used as a control on the proposal content and schedule. Finally, the proposal is submitted, and the contract is negotiated.
The story this diagram tells is correct, but it is not complete. Recall that part of the job of the author is to examine each box and to ask key questions, such as: Is this all that controls this activity? What happens if one or more of the arrows is incorrect? Are there additional outputs that may be produced by this activity? Is there any feedback to other activities? Recall as well that the quality of the diagram depends on its ability to answer questions related to the purpose of the model.
Applying these questions to the diagram in Figure 6-16 results in the addition of several arrows to make the diagram more complete and useful, as shown in the revised Figure 6-17. For example, is the CBD the only control on the identification of business opportunities? No, the enterprise’s plans and charters determine which opportunities are in their strategic plans and which should not be pursued. Therefore, box 1 needs an additional control (plans, budgets, charters) to take this important factor into account.
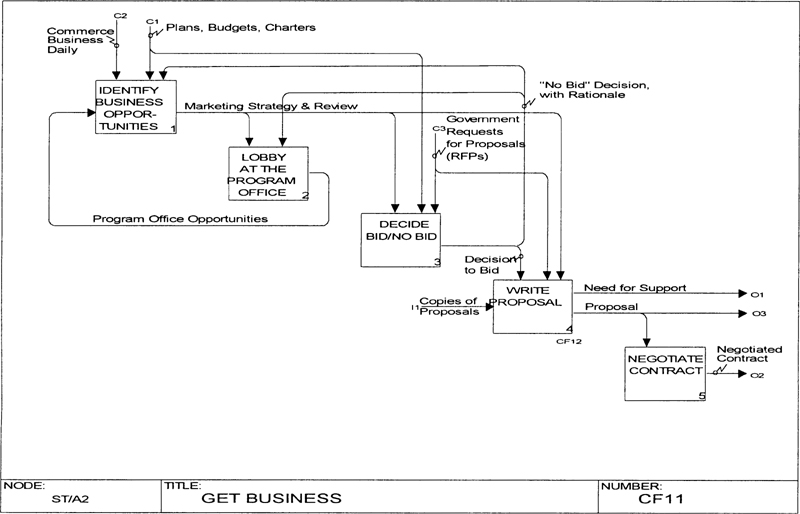
The results of the lobbying activity (box 2) are more than just a list of opportunities to be considered. The lobbyists get to know the personnel at the government procurement offices, and therefore gain very important information to pass along to the bid/no bid decision. If the customer feels that the enterprise has a good company image, this is important to know. If the customer favors a different enterprise, and the process of bidding the RFP is a waste of time in the opinion of the lobbyists, then this is also important to know.
Box 3, DECIDE BID/NO BID, in Figure 6-16 shows the results of the decision to bid but not what happens when the decision is not to bid. The rationale for a no-bid decision is important feedback information for future use by the enterprise management and the lobbyists (maybe they can improve the company image or other-wise mitigate a factor that caused the no-bid decision).
Box 4, WRITE PROPOSAL, is also missing important data. In Figure 6-16, there is no input to the proposal-writing effort, and the controls are the decision to bid and the RFPs only. After thinking about the data used in proposal writing, the modeler probably should conclude that copies of old proposals are essential for generation of good new proposals. Also, the strategic planning that took place in box 1 should have a key controlling role in the content and presentation form of the proposal. Therefore, the marketing strategy from box 1 should be used as a control to box 4, as well as to boxes 2 and 3. Also, a key element in proposal preparation is the ability to get temporary support for the proposal-writing effort from key personnel in widespread areas of the enterprise organization. Therefore, the call for needed support is added to the proposal-writing process of box 4.
Although Figure 6-17 shows the results of examining the activities, asking key questions, and running what-if scenarios, the model is still not absolutely complete. However, it is now ready for reader review and comment in the reader/author cycle.
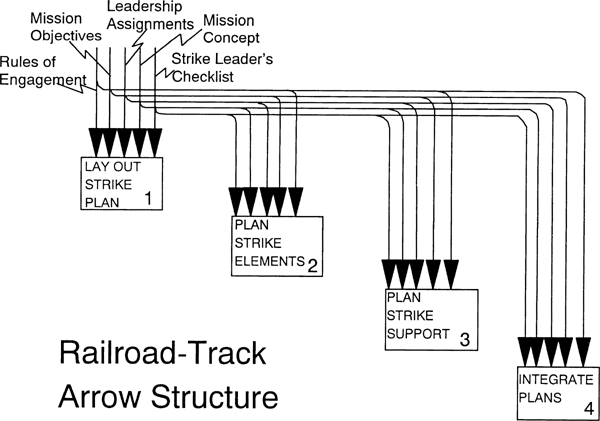
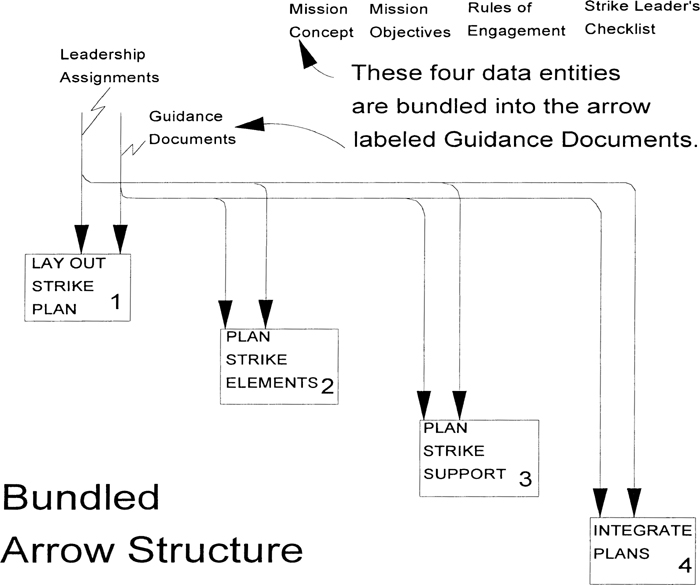
Quality Measurement Rule 5: Arrow Bundle Grouping. The most common problem new authors demonstrate is the tendency to create arrows for individual pieces of data, rather than for bundles of data, or conduits. This leads to diagrams with so many arrows that the message is obscured; reading the diagram becomes an exercise in following train tracks rather than in concentrating on the message. Arrows are really conduits that contain other arrows, similar to an electrical conduit, as we saw in Figure 5-11. By gathering individual arrows into bundles, that is, into groups of similar arrows, the author reduces the complexity of the arrow pathways on the diagram, thereby making the arrow level of detail match that of the activity boxes with which the arrows interface.
The problem new authors have matching data arrow levels with activities stems from the fact that most people are proficient at grouping activities, such as in organization structures, but they are not accustomed to grouping data. Paradoxically, everyone from the president down to the individual contributors in an enterprise is used to dealing with individual pieces of data and individual documents, but the grouping of data entities into bundles and the naming of these combined arrow conduits are not familiar activities.
Arrows tend to branch and uncover detailed data interfaces as the activity diagram decomposition progresses. This permits the story to unfold without rail-road-track arrow patterns that are difficult to follow and that may distract nontechnical staff.
Figures 6-18 and 6-19 illustrate, respectively, the incorrect and correct use of arrow bundling. In the railroad-track version, each piece of data used by the strike leader is shown on an arrow. In the second diagram, the pieces of data have been bundled into two arrows instead of five, with four pieces of data (mission concept, mission objective, rules of engagement, and strike leader’s checklist) bundled into a single arrow labeled Guidance Documents. As the activities on the diagram are decomposed, four individual pieces of data will split out as arrow branches and will be shown being used by specific sub-activities. The level of detail of the arrows should match the level of detail of the boxes if the diagram is going to communicate effectively to an audience.
Quality Measurement Rule 6: Descriptive Arrow Labels. Everyone is familiar with the physical form by which information is conveyed (in a printed form or on a computer screen, for example), but what is most important in an IDEFO model is the information being conveyed, not the form itself. For example, the output from any computer program might be on a computer screen or printout, but data labeled “computer screen output” is not helpful for IDEFO communication or for conveying an understanding of the modeled process. A much better label would be “project budget” or “monthly expenses,” or words to describe the functional content of the arrow. A good rule to follow is, avoid using generic nouns such as “input,” “output,” “report,” or “document” in the label of an arrow on an IDEFO diagram.
Quality Measurement Rule 7: Precise Control Arrow Content. As IDEFO authors decompose activities and create ever-more detailed diagrams, they often do not pay sufficient attention to control arrow content. Control arrows must split into finer, more specific content to match the level of generality of the activity boxes. For example, a common mistake is to carry the product design or the company standards as a control to all boxes as they are decomposed. Instead, the author should question what portion of the design or standard is actually needed by the activity at hand, and then he should branch the control arrow, labeling the branch with the precise portion of the main arrow that is needed. For example, a BILL THE CUSTOMER activity need only use the company’s billing-standard procedure, not the entire set of company standards.
Quality Measurement Rule 8: Correct Identification of Controls. One of the decisions most frequently faced by IDEFO authors is determining, “Is this a control or an input?” This question stems from the common practice of allowing only one form of entity to enter into an activity, and from not splitting out the controlling entities from the inputs. Another cause of confusion is the fact that, at the higher (more general) levels of an IDEFO model, the conduits of bundled arrows contain individual internal arrows, some of which will act as inputs while others will act as controls after decomposition. The general rule is: If the arrow has a controlling influence on the activity, then consider it a control until its contents break down into individual input and control arrows at the model’s detailed levels. In general, if the arrow label contains any of the control-oriented nouns listed in Table 6-4, then it should be considered a control.
Without a clear understanding of control in IDEFO, the author cannot be certain whether a specific arrow should be shown as an input or as a control. In some cases, the confusion is whether an arrow is a control or a mechanism. Authors experienced in other modeling methods are usually no help in this debate, since other methods do not distinguish between inputs and controls, and often do not show the mechanism at all. To further confuse the issue, other methods have a different meaning for the concept of control (see the discussion of business rules as used by the DoD, below).
Some IDEFO authors argue that all arrows are controls, since the content of the arrow “controls how the activity works.” This is true, but it is also loose thinking and not helpful for BPR purposes. The argument here confuses the term “control” with “constraint.”
Precision in defining the role of an arrow is important for BPR purposes, since the author may wish to propose several different mechanisms (for example, an automated approach and a manual approach). Similarly, he may wish to examine the rate at which input is processed or how management controls may be applied to the operation of the process.
In the FIPS definition, the rule for input arrows states that “the input is modified by the activity to produce the output.” In general, this is a good rule to use, since it is simple to understand and apply, and it works in the majority of cases. However, this rule is sometimes inconclusive and a more precise rule must be invoked.
The method of making a distinction is to ask the purpose served by the arrow as it relates to the activity shown on the IDEFO diagram, that is, its role in the process. If its role is to be acted upon by the activity, then it is an input. If its role is to control how the activity works, then it is a control. If its role is to perform the activity, then it is a mechanism.
The concept of business rules, as employed by the DoD, represents a different kind of control. Constraints, in the form of business rules, are derived from interviews with office personnel, and interview details indicate relationships between objects in the model. For example, the statement “we build three types of airplanes: crop dusters, fighter planes, and small private jets” defines the products produced by an enterprise, and therefore the statement describes what controls (constrains) the enterprise. The complete set of business rules is known as the control architecture of the enterprise.
However, this is not what is meant by “control” in IDEFO, where control describes how an activity performs its function. For example, a steering wheel controls the direction of the vehicle, and the lock controls access to the vehicle. The primary purpose is to control the activity.
For the DoD, business rules define the infrastructure of the enterprise’s objects. Therefore, the control architecture specified by the business rules provides important information in identifying details of the enterprise, the meaning of its terminology, and the impact of proposed changes on these objects. IDEFO controls, on the other hand, define how to manage the operation of the enterprise’s processes—which objects and artifacts have what effect on which other processes, including side effects and subsequent cost and schedule impacts. Clearly, both types of information are important in implementing a BPR effort.
Quality Measurement Rule 9: Viewpoint Focus. If the diagrams seem to show many kinds of data from different viewpoints of a system, the modeler should check back to see what viewpoint statement is provided on the A-0 diagram. If none is provided, it is probable that the author did not understand the viewpoint concept. Mixed viewpoint diagrams are hard to read and understand, and they should be remodeled.
Quality Measurement Rule 10: Text Selection. The text that accompanies a diagram should be generated after the model has reached at least the Recommended level of approval. If the text is written too soon, information may be included in the text that properly belongs in the model itself. Typically, the text will have to be rewritten repeatedly as the diagrams are modified during the reader/author cycle. A common mistake with text is to describe each of the boxes in the diagram. Such detail is more properly shown by way of the child diagrams and should not be included in the parent text. The purpose of the text is to highlight key features, not to explain the breakdown of the boxes.
Quality Measurement Rule 11: Function and Design Separation. A primary goal in good system development is to keep the functional model separate from the design model. That is why what the system must do is quite separate from how a solution is designed to do it. Often there are several designs to match a single functional view before the final, best solution can be completed. To help a modeler separate function from design, a commenter might ask whether the details describe what must be done or just one method of designing a function. For example, a message may be sent to a manager, but this can be accomplished by telephone, fax, radio, carrier pigeon, and so on. The fact that the message must be conveyed and what information is in the message have to do with function; the form in which it is conveyed is a design detail.
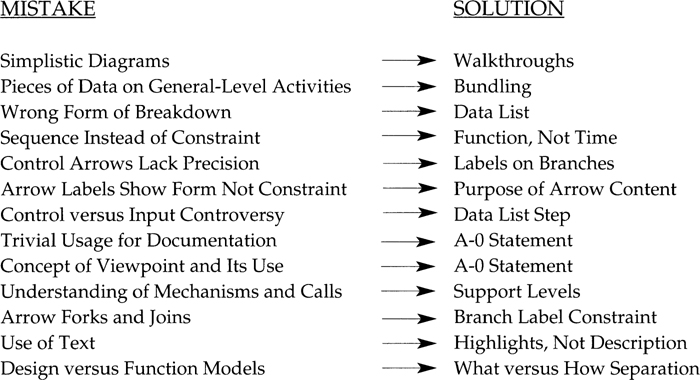
Table 6-5 summarizes common errors made by authors, including a recommended remedy for each type of error.
Achieving Model Quality
Given the same topic and the same source documents and/or interviews with experts, each person in a roomful of people will come up with a different first diagram. Some diagrams will be better than others. That is, one diagram will be easier to understand, will convey a more meaningful message to the intended audience, and will fulfill the model’s purpose better than other versions of the diagram. A friend of mine calls the inferior diagrams “content free.”
What makes this difference? and, What can an IDEFO manager of a modeling project do to guard against spending excessive amounts of time and money only to wind up with a content-free model? The critical difference comes from the author’s selection of the three-six activity breakdown when developing a new diagram.
Through this book’s discussion of arrow labels, we have seen that the careful selection of labels to depict the content of the arrows is essential to creating superior models. But the decomposition itself is the nucleus of the message conveyed by the diagram, since it provides the baseline for communicating information about the topic. If the decomposition is not carefully chosen, the labels on the arrows cannot make the model helpful, no matter how well they are selected.
Recommendation 1: Model for the Purpose. Recall that the primary means of judging model quality is by assessing whether it successfully answers questions relative to the model’s purpose. In other words, if the model’s purpose is to improve work flow, does the model highlight work-flow problems? If the model’s purpose is to provide a functional requirements definition for a user interface to a new computer system, does the model break down the functions into manual versus automated functions supported by the computer? If the model’s purpose is to define the roles and responsibilities of the present staff and organization, does the model break down the activities so that a specific department in the organization is identified with each of the activity boxes in the model?
The answer to the above questions should be yes, if the model is capable of ful-filling its purpose and is of high quality. If the model breakdown shows activities and interfaces that are not helpful in accomplishing the purpose of the modeling effort, then the diagrams will be judged “content free.”
The key is to focus on the model’s purpose, and then to cluster the activities into objective-oriented activities, adding appropriate arrow labels to provide a meaningful diagram. Figures 6-20 and 6-21 illustrate the concept.
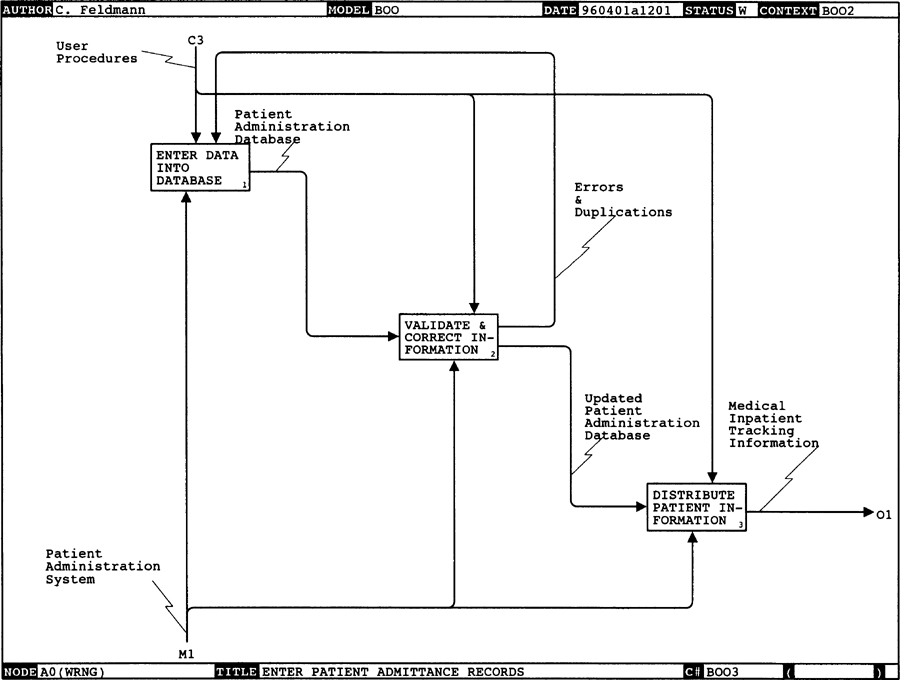
Let me give a real-world example of modeling the purpose. As I described briefly in Chapter 5, the project I was involved in was one whose purpose was to identify immediate improvements in the current operation and to lay the ground-work for more major reorganization and downsizing. The merging of two different facilities had already taken place (by brute force), and the strategy of the AS-IS modeling effort was to highlight problem areas resulting from the already implemented merger.
The subject of the model was the merging of VA and military hospitals by the DoD. As was stated in Chapter 5, one function of the admissions office was to enter patient data into a patient admissions database, which would then track the patient through his stay at the hospital. The first attempt to develop a diagram of this process showed personnel gathering data from the admissions forms, entering this into the computer, comparing existing records for any prior patient history, and producing various reports once the correctness of the information had been verified. This breakdown makes a nice, informative diagram, as shown in Figure 6-20.
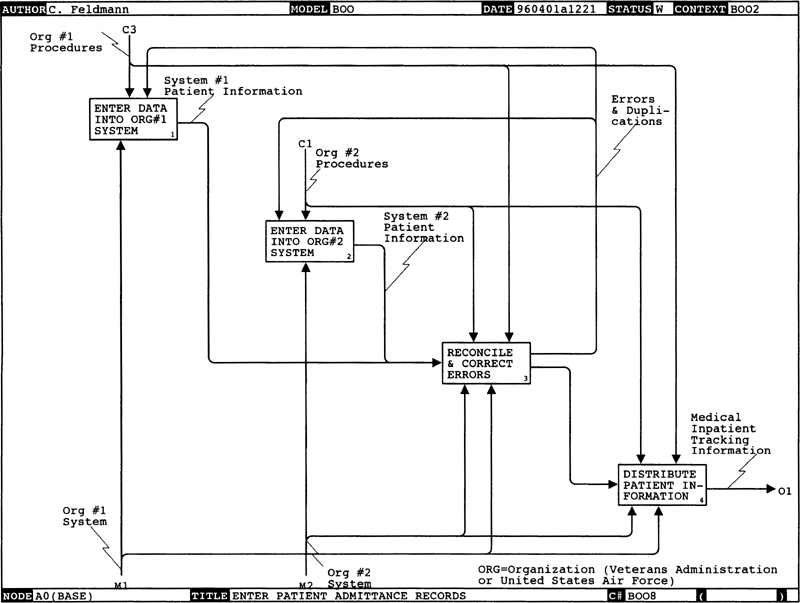
However, the purpose of the effort was to highlight problem areas, and the modeling of the data-entry activity as described herein does not focus on this purpose. The actual operations staff of the data-entry office had a serious problem: The two merged organizations had different computer systems, and data had to be copied out of one computer system and entered into the other if both partners in the merger were to have access to needed information. Furthermore, one or the other of the two databases was often missing patient information or had incorrect information, causing severe problems later on. Figure 6-21 shows the same model as in the previous diagram, but this time with a focus on the operational problems, not on the basic function being performed.
For anyone examining this diagram, the non-value-added nature of the duplicate entry and cross-checking effort was obvious, without the modeler even getting into concerns about incomplete or erroneous information. Examination of the diagram resulted in a reengineering recommendation to create an automated link through a single data-entry package, and then, at a later date, to create a single, totally merged VA/DoD patient administration computer system.
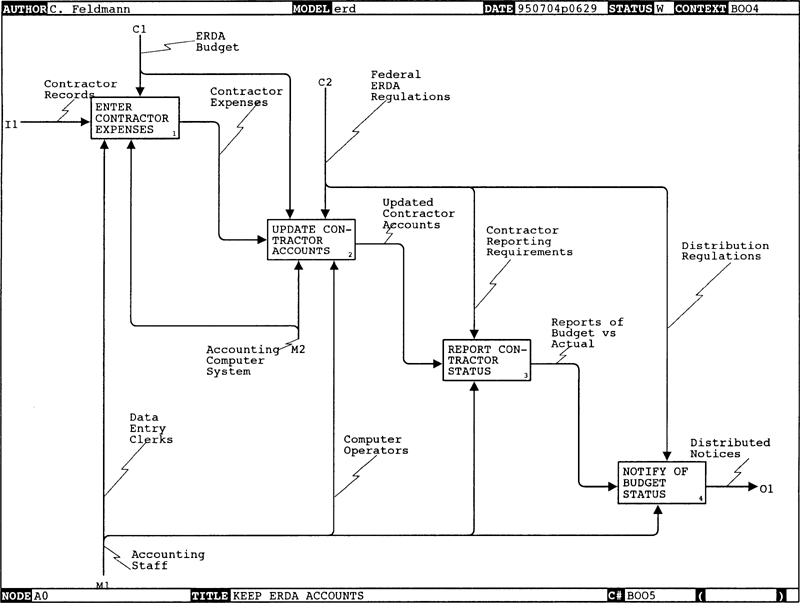
Recommendation 2: Focus on Function. Let’s look at a second example, also from my consulting experience, that illustrates the common mistake of focusing too much on the form of the information rather than its function. A modeling project at the Department of Energy was intended to develop a revised accounting process. The existing process was unevenly applied, with the Chicago office’s eight staff members monitoring more than $4 billion worth of contracts. Some contracts were very loosely scrutinized, while others were overanalyzed (accounting for every last pencil, eraser, paper clip, staple, and so on). A TO-BE model was to be developed that showed a process of reasonably careful audits that could be applied to all projects in a standard way.
In order to develop the AS-IS model, the staff was trained in the IDEFO method and assigned the job of modeling the office’s existing accounting process. This modeling effort resulted in diagrams similar in appearance to Figure 6-22, which focuses on the mechanism and the form of the data (reports, input data, and the like) rather than on the purpose of the data.
To redirect their modeling effort away from mechanisms and toward purpose, we used the following set of function-oriented questions that would draw out more helpful information:
What does the computer do with the input data?
What data are in the reports that are printed and distributed?
What are the reports used for?
This interview format provided the right approach, but without persistent questioning, it didn’t always help to dig out the kind of content that was needed. For example, when asking the second question (What does the computer do with the input data?), I expected an answer such as, “The computer calculates the taxes and salary and produces the payroll.” I was disappointed to get a general response, “The computer processes the data.”
Too-general answers were rejected, and additional question-and-answer sessions were held until the functional perspective was finally achieved, and we were able to produce an informative diagram, similar to that shown in Figure 6-23.
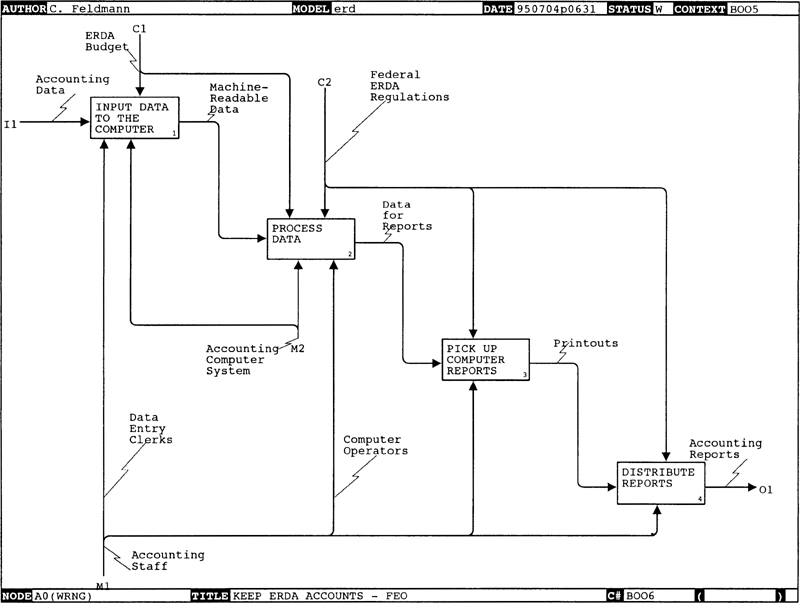
Why is this diagram better than the first? It is superior because it provides a baseline from which to accomplish the purpose of the model: to identify and define standard contractor controls. For example, the specific contractor records, reporting requirements, and distribution regulations could be defined overall, and then the process could be followed by all ERDA contract monitors to develop and implement an evenly applied contract-tracking process.
Management Lessons Learned
Instead of depending on the technically oriented model quality factors described above, the success or failure of an IDEFO business process reengineering effort often depends on several key management issues. The problems and solutions described in the following sections should enable managers of IDEFO reengineering projects to achieve greater success.
Management Rule 1: Encourage Model Project Support. Proper management support is as important to the success of an IDEFO project as good technical results. Several types of essential support are listed below. Inadequacy in any of these support areas could result in significant project disruption.
• trained, experienced author staff
• trained readers and commenters
• computer support tools
• kit-processing support
• interview time allocation
• responsive, carefully selected technical committee
• management visibility and interest
The first two support factors deal with personnel. As with any endeavor, the staff selected to work on the project is critical to its success. IDEFO authors must be selected with great care to maximize the chances of success in generating a useful model that fulfills its purpose. A technical staff member who is knowledgeable only about an extremely narrow aspect of the enterprise is not likely to make a good IDEFO author. However, such a person usually makes an excellent reader in the R/A cycle, since he will probe the fine detail and not permit the diagram to be approved if it contains errors.
An IDEFO author, on the other hand, must be able to think top-down, since this hierarchical approach matches the structure of an IDEFO model. He must be able to think about subjects at a general level of detail, and be capable of recognizing groups of activities that cluster together naturally and share a common functional bond. At the same time, a good IDEFO author must be able to analyze and synthesize a large number of facts and disjointed pieces of information. People who can see commonality between activities and things that seem unrelated to most other people are well suited for analyzing an AS-IS model and for proposing reengineering changes that will save time and cost through shared resources and support systems.
Perhaps the most serious emotional threat to the support of an IDEFO business process reengineering project is the concern that the IDEFO model will result in a loss of jobs. Any time business processes are examined with an eye toward optimization and cost reduction, people fear job loss. The best way to handle this fear is through solid management support. If management is convinced that the IDEFO model will result in a more efficient and cost-effective operation, then it will support the project when objections come from the staff. Of course, each manager must be confident that the model being developed is accurate and complete and that planned changes are realistic. By indicating that the goal is a positive one, such as expanded capacity rather than staff reduction, managers can further minimize fears.
Management Rule 2: Reduce Model Development Cost. Creating IDEFO models can be expensive and time-consuming. This section lists factors to monitor and presents techniques for reducing the cost of model development. Some key factors are
• experienced head IDEFO author
• well-defined model purpose and viewpoint
• efficient operation of the reader/author cycle
• rapid definition of the top level of the model
• reusable models
• proficient knowledge of decomposition and abstraction
The skill of the head author is critical to cost-effective IDEFO modeling. All items on the list above are related to the experience and know-how of the head author, but a major obstacle to hiring the most experienced candidate is that well-done IDEFO models look deceptively simple. Conclusions such as “I can do that myself. We don’t need to hire an expensive analyst!” may lead a client to base a hiring decision on the analyst’s charge per day, not on his IDEFO experience. An experienced IDEFO author can usually produce three or four times the number of diagrams per day as an inexperienced author, and the quality and utility of these diagrams are remarkably superior. The IDEFO modeling field needs a value-per-dollar criterion rather than a dollar-per-hour criterion to select the most cost-effective analyst for the job.
One excellent way to control the cost of model development, then, is to select a head author with a track record of successful IDEFO application. An author’s experience can especially affect startup costs, and reuse of previous models can contribute to further savings.
During one of my first model development projects, measurements were made of the effort required in building models. The statistics showed a basic rule: The time to develop a diagram at a given level of the model is equal to the square of the time to develop the next lower level. Thus, if it took sixteen days to develop AO, it should take four days to develop Al, two days to develop All, and so forth.
This is an interesting statistic, rooted in the fact that the top level of the model involves mentally laying out the entire system to ensure that the scope of the subject is encompassed. A large list of data elements must be defined and clustered into the arrow pipelines, and the activities must be grouped into six or fewer major general activities. Once the top level is completed, the author uses those data lists and activity subgroupings to start the next decomposition. As each new lower level is decomposed, the detail becomes more bounded and easier to grasp.
Of course, working against this increase in productivity is the decrease caused by the addition of new authors as the decomposition progresses. At the top level, one author is laying out the entire system. At the next level, several authors may take over, each one decomposing a box on the AO diagram. These new authors must become familiar with the model’s breakdown and discover what was in the mind of the head author when he developed the AO diagram.
Since development of the top few layers of the model is so costly and time-consuming, it seems logical that having a library of existing model tops would be of great benefit at project start-up time. Although beneficial in many cases, having a library of model tops can be a negative factor, since the chief author must be free to use his creativity and think for himself; he must not feel obliged to shoehorn his new model structure into one that does not really fit the system he is modeling.
However, experience suggests that there is great similarity between the models in a given topic area. The ICAM model of aerospace manufacturing showed that there was far more similarity between the major aerospace companies’ activities than any of the companies were willing to admit at the outset of the program. The same is true in business process reengineering, whether at the various military facilities or in the financial offices of large corporations. Therefore, the development and reuse of a topically organized model library is quite feasible.
The use of such a library provides other benefits, too: insurance against over-looking a piece of the system; common terminology, using a central, well-defined glossary; high-level bundling of arrows into large pipes; reasonable naming and labeling at the start; and general, prior acceptance of the model. With reuse, the avoidance of common authoring problems augments the communication power of the IDEFO model at the beginning of a new project, and increases understanding and acceptance of the model.
Another major cause of wasted time and of low-utility modeling is not knowing when to stop a decomposition sequence or when to switch to a different viewpoint or level of abstraction. The basic question that should be asked at each new level of decomposition is, “Is there further detail needed to satisfy the purpose from this viewpoint?” It is much easier, especially at the lower levels of a model, to continue the decomposition once a group of authors gets rolling than to consider whether it would be more cost-effective and beneficial to switch to a different viewpoint or level of abstraction.
There are four main reasons why a decomposition sequence should be stopped: First, an activity may be decomposed elsewhere in the model. Second, the author may wish to plug in alternative decompositions at a particular node. Third, a drop in level of abstraction may be needed to expose essential detail. The fourth reason is that no further detail may be needed from a particular viewpoint. If any of these circumstances are present, the IDEFO project itself may be in trouble and should be reevaluated.