Managing the Schedule
Summary and detailed schedule plan
Tracking progress toward your objectives
Reports used when drafting a plan
Report used to update the forecast
Reports used for progress reporting
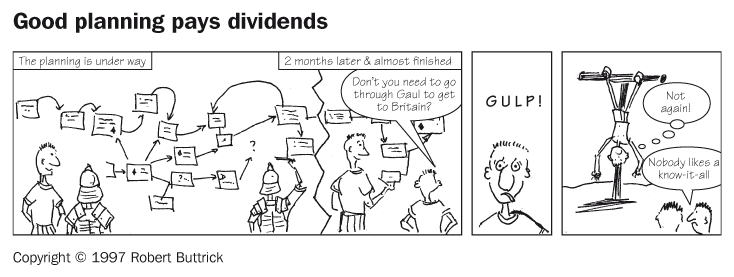
So why are we nearly always late?
The management of the project schedule is one of the most important and fundamental of project management techniques; so much so that many people (wrongly) think that schedule management is project management.
‘There can’t be a crisis next week. My schedule is full.’
HENRY KISSINGER

- Plan in outline for the full project.
- Break the project down into manageable pieces (work packages).
- Plan in detail before you start any work.
- Once a plan is agreed, baseline it.
- Measure progress against the baseline.
- Keep your eye on the future – forecast, forecast, forecast.
The project schedule
You will find the management of the project schedule is one of the most important and fundamental of project management techniques; so much so that many people (wrongly) think that schedule management is project management. At a simple level, the schedule tells you how long the project, or any part of it, will take. In addition to giving dates, a well-produced project schedule also tells you:
- who is accountable for every aspect of the project;
- the approach being undertaken;
- the major deliverables from the project;
- the timing of key review points.
SCHEDULE OR PROGRAMME?

I have used the word ‘schedule’ to mean the management of project timescales. I use this word rather than the common alternative ‘programme’ as the latter has come to mean many different things including:
- a very large project;
- a set of interrelated projects;
- a sequence of phased projects;
- a portfolio of projects bundled for management reporting;
- a portfolio of projects bundled by management accountability.
In this book ‘programme’ is defined as a tightly aligned and tightly coupled set of projects (see also p. 62).
The schedule is also the basis on which cost and resource plans are constructed. However, unlike costs and resources, which are seen by only a few people observing a project, key dates are very visible. A well-publicised delivery date for a project is, when missed, very hard to hide. While ‘time’ may not be the most important aspect for you on some of your projects, an observer may develop their own perception of ‘success’ or ‘failure’ purely from the performance of your project against the publicised target dates.
The ability to build and manage the schedule plan is one of the essential skills that all project managers should have. Planning is far too important for you to delegate to junior team members, especially in the early stages of the project when the overall strategy and approach are being developed. The plan sets the course for the remainder of the project. Once agreed and set (at the Development Gate) it is very difficult to change or improve on. All the decisions which have the most leverage on time, costs and benefits will have already been made. Done effectively, the project planwill benefit you and the teamby providing:
- a baseline against which to measure progress (without a plan, words such as ‘early’ or ‘late’ have no meaning);
- a common understanding of the approach you are taking to achieve your objectives;
- a breakdown of the project workload into manageable pieces (work packages) based on the deliverables/outputs wherever possible;
- a clear way of showing interdependencies between activities and work packages within the project and to/from other external projects;
- a listing of accountabilities for different activities and work packages;
- a tool for evaluating when corrective action is needed.
Further, as already discussed in Chapter 19, the actual activity of creating a project plan by using the full team serves to forge a team spirit and a high level of common commitment.
All projects are undertaken within an environment of risk. Good planning is done in the full knowledge of those risks. You should therefore:
- avoid avoidable risks by planning the project in a different way;
- have a plan contingency for the unavoidable risks.
’The only way to be sure of catching a train is to miss the one before it.’
G K CHESTERTON
Summary and detailed schedule plan
You need to consider your plan on two levels:
- summary (or outline);
- detail.
The former is used to map out the entire project, while the latter is used to show the detail for the current stage. For work packages done by others (for example, by a contractor), the person or group doing the work will prepare the detail. However, you need to be satisfied that the plan is workable and includes sufficient checkpoints for you to monitor progress. Developing a schedule plan is an evolutionary process which starts with a statement of key objectives, deliverables and scope, followed by the preparation of a summary plan (Figure 21.1). This will comprise:
- the approach to be adopted (or alternatives from which the preferred option will be chosen during the detailed investigation);
- the breakdown of the project into stages and work packages relating to project deliverables (note these same packages should also be used for resource and cost management);
- the key dates, milestones and time constraints relating to the project;
- review or decision points;
- interdependencies with other projects.
From this you should be able to estimate:
- the resources required;
- the cost of the project.
Before you start work on any stage of the project, you should ensure that detailed plans are prepared. The criteria for all the entry gates in the staged framework from the Detailed Investigation Gate onward include a detailed plan as a prerequisite. Detailed planning will involve work undertaken within your own organisation and checking that third parties (such as contractors and suppliers) have planned in sufficient detail with adequate checkpoints for control purposes. The detailed planning process is similar to the outline process except that you will be be working in more detail, on perhaps one aspect of the project at a time. This includes:
- breaking down each work package into activities to represent the work content for each project deliverable;
- identifying dependencies between activities;
- agreeing completion dates for each activity with those accountable;
- checking that key milestones and the overall project completion date can still be achieved;
- ensuring that there are appropriate check and review points;
- ensuring that time and resources are allocated for planning the next stage.
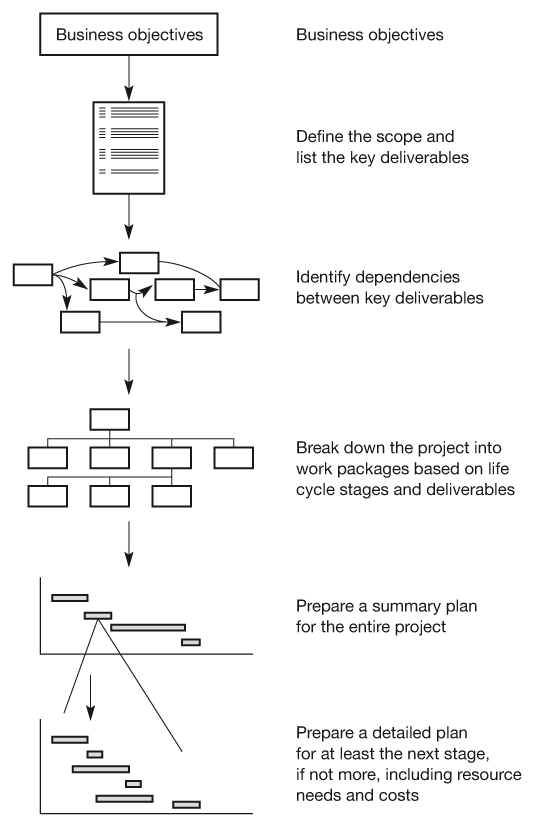
Figure 21.1 Project planning
Project planning starts with the business objectives and ends with detail plans, including schedules, resources and costs. (See Project Workout 21.1.)
21.1 STARTING THE PLAN OFF

Introducing Post-It Note planning from the future – backcasting!
I said earlier that planning is too important to delegate to junior team members. ‘But,’ argue many people, ‘I do not know how to use these sophisticated planning packages we have on our PCs,’ or ‘I haven’t any planning software on my PC,’ or even ‘I haven’t got a PC!’
Such excuses do not make sense. Projects have been with us for centuries and certainly since well before computers became commonplace. All you need to start planning is:
- your brain;
- your team;
- a set of Post-It Notes;
- flip chart markers;
- a very big wall covered in paper or a large white board onto which to stick your Post-It Notes.
You should do this exercise as soon as possible. In the early stages of a project it is more important to start getting the feel of the task ahead of you than to worry about ‘correctness’ and detail.
Take the project definition output from Project Workout 19.2 and with the same team in workshop format, using flip charts, white boards and Post-It Notes:
| 1 | Display the flip charts from Project Workout 19.1 on the walls so that the team can see the project’s objectives and conditions of satisfaction. If you are familiar with Isochron’s techniques (from Chapter 20) you can use the recognition events to depict the objectives/outcomes. |
| 2 | List each outcome on a Post-It Note and place these at the right of the wall. |
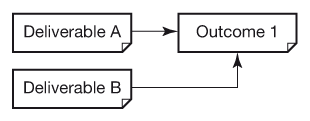
| 3 | Pointing at the one of the outcomes, ask the question: ‘What smart moves did we make to create this success?’ This should lead you to identify milestones and deliverables; add them to the board to the left of the outcome, with an arrow leading to the outcome. For example: |
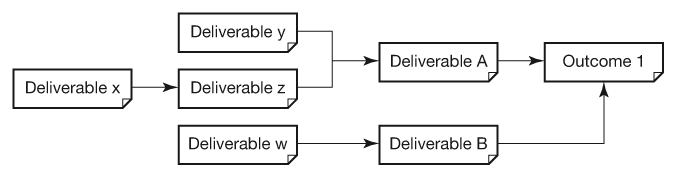
| 5 | Continue as per step 4, on the deliverables, milestones and activities, until you are satisfied that you have identified the starting point for the project. Don’t be worried if you do not know what order some deliverables are put in or do not know the exact sequence of activities in all areas. If you did know this, your project would be relatively simple. Make a note of the ‘problem areas’, as they are issues which must be planned into your work schedule as problems to investigate and solve. Once you have finished, stand back and look at the pattern. Relocate some stickers to simplify if necessary. You may also notice that some deliverable or actions lead to a number of outcomes. This is good news as it reflects a fundamental of life, that one solution can remove many problems. (Look at Chapter 24 on issues, where you will notice the same effect.) It also indicates which of your activities and deliverables are really valuable and important to invest in. Finally, it may indicate that your project may be somewhat simpler than you first realised. Concentrating on planning towards outcomes, rather by defining departmental ‘workstreams’ always leads to simpler projects! |
| 6 | Look at the plan again and make broad estimates of how long each activity will take. Don’t worry if you are wrong. Note down those for which you have very little confidence in your estimate on your list of ‘problems to solve later’. |
| 7 | You should notice several tranches of notes, each of which leads to an particular outcome. These are clues to your work breakdown structure (WBS) and the key packages of work within each stage of your project. Where possible choose your WBS with as few interdependencies between work packages as possible. |
| Relocate some of the Post-It Notes to simplify the appearance if necessary. Rationalise any long sequences if it does not seem that showing them adds value to the overall plan. (Remember this is a summary plan only.) | |
| 8 | Consider alternative ways of approaching the project, perhaps by brainstorming or discussion. Start again using an alternative approach. |
| 9 | Repeat the above for each outcome. |
| 10 | You should have created one or two summary plans. You will have discussed differing options, identified areas of uncertainty or ignorance and have started coming to a common understanding. You should also have been able to add some flesh to the bones of your project definition and be well on the way to creating a realistic, achievable plan. This may be sufficient at this stage or you may need more sessions. Assuming you have made as much progress as you can, the work packages should be allocated to key team members to start working on as part of the initial investigation. By starting ‘in the future’ and working back to the present, you ensure that only those deliberables and activities necessary to achieve the outcome are within the plan. This means you have no excessive, non-value-added work in the plan. This ‘from the future’ planning approach is often called ‘backcast’ planning, or simply ‘backcasting’. |
USE OF PROJECT MANAGEMENT PLANNING SOFTWARE PACKAGES
There are many commercially available software packages for schedule management, all of which also have the capability for handling resources and costs. Using planning packages can be of great assistance to project managers in their work, particularly for projects with more than 50 to 100 activities. The point at which using a software package is effective depends on how well a person can use it. More experienced users will find project-planning packages more beneficial for smaller projects than those who are less able. The examples shown in this book were prepared using Microsoft Project but similar layouts and reports can be prepared using other software packages (e.g. Primavera, PlanView, Asta, etc.).
Remember, planning software is a tool for you to use and not an end in its own right. It is not magic and will only give you a short cut to calculating and reporting on schedules. It cannot tell you if your fundamental approach is wrong or a major task is missing.
One danger of planning software is that a ‘planner’ works in isolation to construct a plan for the team. Computer screens are small and do not make good work sheets for teams. In addition, most work counter intuitively by assuming that you start planning by concentrating on activities, rather than deliverables. The Post-It Notes method in Project Workout 21.1 will test your basic approach and will ensure your team are agreed and aligned. When that has been done, by all means ‘computerise it’.

I was given the task of looking at a project plan which had been created for a complex change project for a manufacturing organisation. I was told that there were six projects and about 400 activities. The complexity was due to over 50 interdependencies between the projects.
I printed out a network chart of the project (the equivalent of the Post-It Note plan) and laid it out on the factory floor like a carpet. A half day of study and marking up resulted in a much simpler programme. There were still six projects, but now only five interdependencies. The original project scopes had been defined largely on departmental lines. By focusing on deliverables, I was able create relatively independent projects so that each project manager had greater degrees of freedom to plan and manage his or her projects without the need to involve the others.
Tracking progress toward your objectives
’Nothing is inevitable until it happens.’
A J P TAYLOR
Tracking progress toward your objective is essential. If you don’t do it you simply won’t know when you are going to arrive. The control cycle is shown in Figure 21.2: once a plan has been agreed, it is necessary to measure progress against the plan, reforecast to the end, note any variances and take steps to bring the project back on schedule if need be.
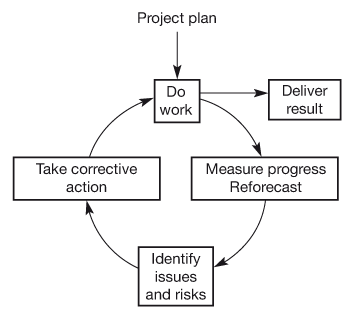
Figure 21.2 Schedule control cycle
There are many ways to measure progress, the commonest being:
- assessing percentage complete;
- assessing the remaining duration for an activity;
- estimating the date when a task will be completed.
Many people use the ‘percentage complete’ method. However, this method has potential problems if a realistic estimate of percentage complete cannot be determined (such as measuring hours worked); it is not unusual to find an activity is 90 per cent complete for 90 per cent of its duration! A simpler method is to estimate the date when a task will be completed.
An activity is either:
- completed (i.e. 100 per cent complete);
- not started (i.e. 0 per cent complete);
- or started, but not complete (treat as 0 per cent complete).
Activities which are started, but not finished, are assumed to be 0 per cent complete, but a current best estimate of the expected finish date is made. A special form (see Figure 21.8) can be designed to record this information.
The schedule should be updated at least monthly, but for faster moving projects, weekly or fortnightly would be more appropriate. This update cycle should tie in with the regular progress reporting on the project as it is the most concise method of showing what has been achieved and what is to happen next. Summary reports should be used for reporting upward and detailed reports should be used for reporting to the project team.
Do not concentrate only on what has been completed. Look at what is coming up next. Consider, based on your experience to date, whether the timescales allocated are adequate; if they aren’t, you may need to take corrective action. Anticipating problems is good practice and gives you more time to find solutions. If problems are ignored they don’t go away, they grow. Keep in mind your main focus: to reach the RFS Gate, when benefits start to flow. You do not need to have every activity completed on time. Every duration in your plan is basically a guess. Some will be good, some will be appalling, others will be the unfortunate victims of Murphy’s Law. As project manager, too much concentration on the wrong detail will divert your attention from the real issues.

Reforecasting the schedule is not a change to the plan. It is an assessment of how the project is proceeding compared to the plan.
PLAN INSTABILITY
Quite often you will find that when starting work and monitoring against a plan you have difficulty assessing progress. This may happen because the work is in fact being undertaken in a different way from that planned. In most cases this is not a problem if the key milestones, dates and interdependencies are not affected. It can be symptomatic of ‘microplanning’, i.e. planning done at too detailed a level.
At other times it is simply because the plan has not been fully thought through. In which case it needs to be changed to reflect the actual work to be done (using the change management guidelines, of course). Changes of this nature often occur in the early part of a project as a result of uncertainty. The plan should become stabilised quite soon if you apply yourself and your team to it. You may also find that a particular work package is unstable. This could indicate that the manager in question has not planned it properly and is not in control, or that it is inherently risky. Both reasons need your management attention.
Schedule reports
Consistent format and layout
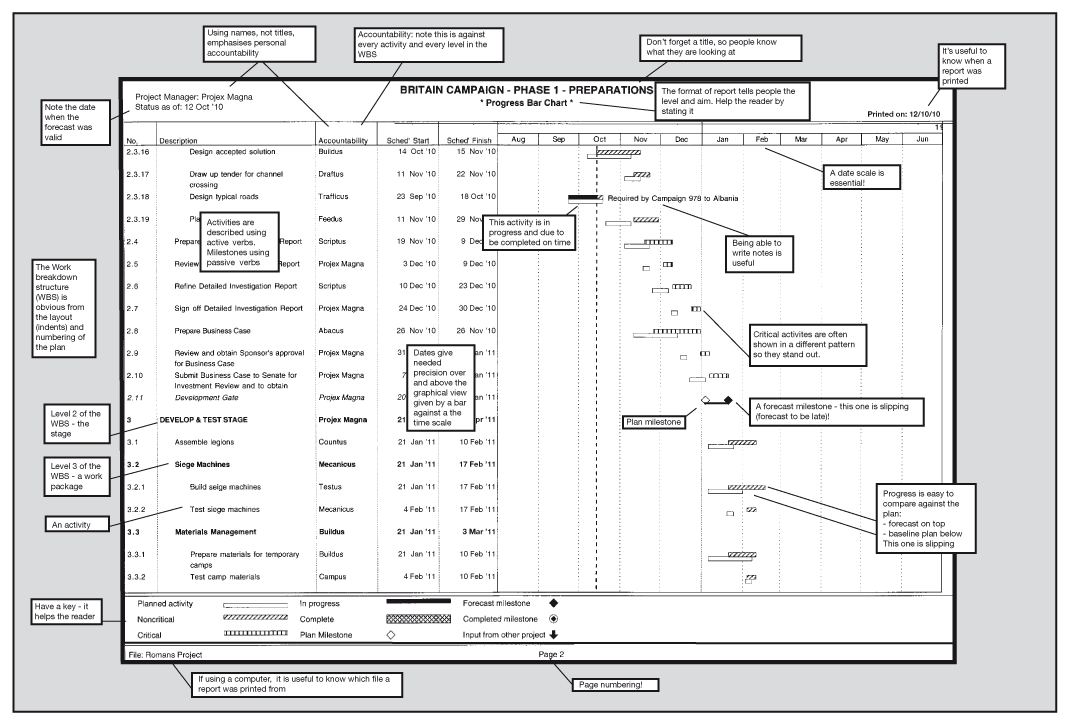
You must have a clear and consistent legend for the family of reports you will produce. Figure 21.3 is a typical example.
Bar charts can be confusing to the uninitiated and difficult to read. Therefore, it is good practice to use consistent formats and styles. The following points should be noted:
- The numbering used for activities clearly shows their level in the project hierarchy. The list is ordered such that each activity is shown within its relevant work package within the relevant life cycle stage.
- Activities are best described using an active verb, e.g. ‘Prepare data’. Milestones or targets are activities of zero duration and are best described using a passive verb, e.g. ‘Phase 1 completed’. The dates on the activity list should be updated to reflect progress and current expectations of finish dates.
- The accountability column has the name of the single point of accountability for every activity at every level.
- Show both the plan and the actual/forecast on the graphical section of the chart. In this way progress is very obvious.
When reading any of the project reports, it must be clear where the report came from and what it refers to. It is, therefore, good practice to have ‘quality’ headers and footers on each page so that the reader is absolutely certain of the source and status of the report being read.
Inter-project dependencies
Many projects require deliverables from other projects as a prerequisite to completion. For example, a software project may require another project to deliver a particular hardware configuration before it can be tested.
It is very important to ensure that the scope of each project is well defined, particularly when different departments in an organisation are involved. If the full scope of each project is not clear, then accountability for delivery becomes vague and this will threaten project success. It will often be found that senior management and line management who are not intimately involved in a project or series of projects will have different perceptions of the scope of a project and may even view a package within a project as a ‘project’ in its own right.
The breakdown of a project into discrete work packages related to specific deliverables is essential if confusion is to be avoided. The plan for a project should show only those activities for which the project manager is accountable. Activities done by others in other projects should not be shown in detail. Such linkages should, however, be explicit and the example reports shown later in this chapter have been designed with this in mind. The reports show a down arrow on the date when the deliverable is due to be completed and is ready for use by the receiving project.
When considering dependencies between projects, the following question should be asked: ‘What do I (in Project A) require from other projects in order that I may complete the defined scope of work?’
This may result in a list of one or more specific deliverables which should be identified in the other project plan(s). The project manager(s) of the other project(s) should be aware of what you require and by when. Two projects cannot be accountable for delivering the same deliverable!
Report formats
The following section contain examples of schedule reports and are presented in the order in which they will normally be used (Figure 21.4).
The examples were prepared using Microsoft Project, but similar layouts can be prepared using other packages. They are all derived from the same basic data; they are simply different ways of viewing those data.
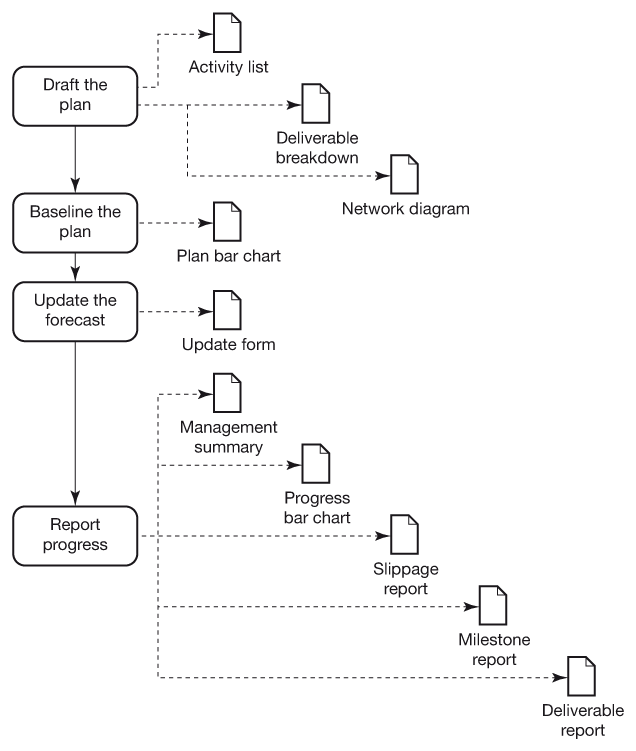
Figure 21.4 Schedule report formats
Different reports are used for different purposes. You will not find one to suit all your needs.
Reports used when drafting a plan
Deliverable/product breakdown structure
Purpose
The deliverable (or product) breakdown structure provides a summary listing of each deliverable created by the project team.
When to use it
The breakdown structure is used to show a structured view of all the deliverables from the project (or stage of a project). As such it is created whilst planning.
Completion
The breakdown structure is derived whilst planning, often in tandem with the network diagram (sometimes called a product flow diagram). By concentrating on the physical deliverables, those doing the planning are able to visualise the output of the project, starting with a few key deliverables and then breaking each of these in turn into smaller and smaller components. This helps ensure the outputs from the project will be sufficient to meet the business objectives. Strictly, this should be shown as a tree diagram; however, it is far more convenient and useful to use a tabular format, with the breakdown represented by the numbering system and indentation of progressively lower levels of the breakdown.
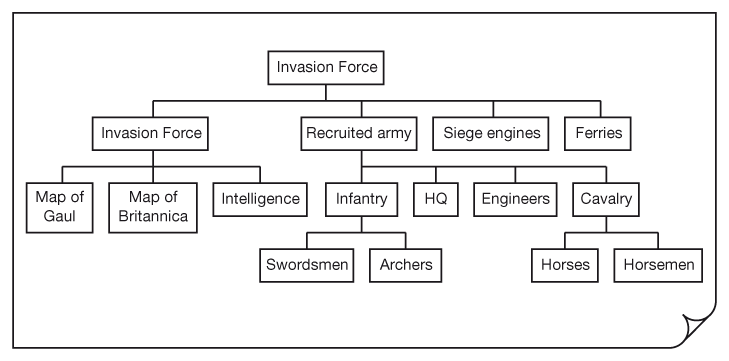
Figure 21.5 A deliverable (or product) breakdown structure
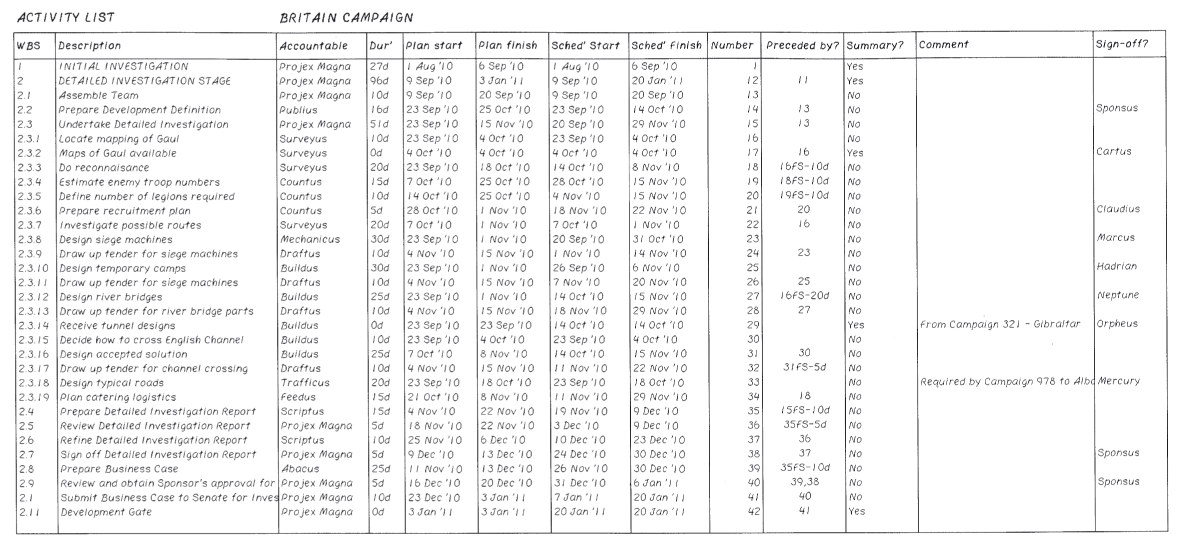
Activity list
Purpose
The activity list records all activities associated with the project, i.e. what needs to be done, who is accountable, how long it will take and by when it should be completed. The list is used to identify activities and milestones and to give information on outline plans (Figure 21.6).
When to use
The activity list is best used when drawing up a plan, to aid thinking through the key activities, milestones and their dependencies. It is a simple and useful way of communicating a plan if bar charts or other graphic presentations cannot be prepared.
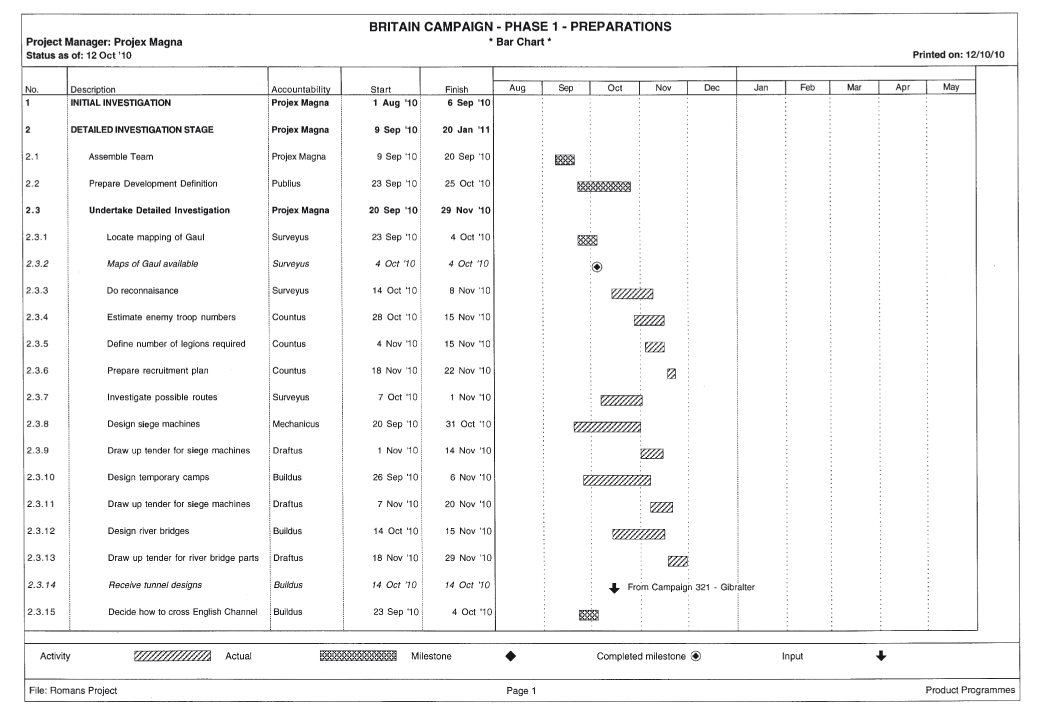
Bar chart
Purpose
The bar chart (or Gantt chart) is a representation of the schedule plan in graph form. It shows the duration of activities against a timescale. It also defines who is accountable for each activity and work package and the place of each activity in the work breakdown structure (Figure 21.7).
When to use
The bar chart is probably the most effective way of communicating a schedule. For this reason it is highly recommended for inclusion in the project plan and for use in communicating plans whenever possible.
Completion
Bar charts can be produced manually or by using computer software, at summary and detailed levels. They are produced from the activity list once the start and end dates of each activity have been calculated. The left-hand portion contains a reference number, description, duration, the name of the person accountable, and the start and finish dates. The right-hand part shows a bar against a timescale which spans from the start to the finish of the activity. Milestones (dates for key events) are shown as diamonds. Dependencies from outside the project are shown as down arrows.
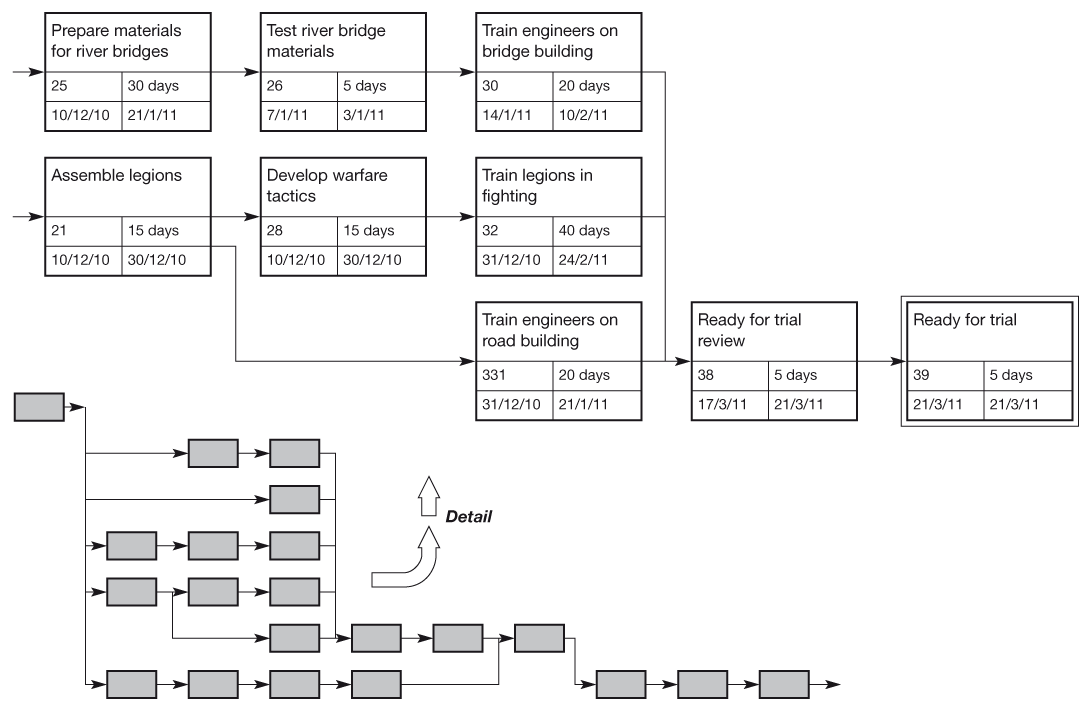
Network diagram
Purpose
The network diagram is probably the most useful but least used way of depicting a project. It is used to show the logical relationship (dependencies) between different deliverables, activities and work. Network diagrams can be used for identifying natural checkpoints in the project as the network will show where various strands come together. They are invaluable for calculating project float and determining the critical path (Figure 21.8).
When to use
A network should be used whenever a complex sequence of events needs to be shown clearly. This is particularly useful when first drawing up a plan, as it is not always obvious what the logical dependencies are. It is also a useful format to use at planning workshops, for determining dependencies between activities, before any idea of timescale/duration has been gained.
Completion
The plan is developed by mapping out those activities which can be performed in parallel and those which must be carried out sequentially. Activities or milestones are represented in boxes and their relationships with preceding and succeeding activities are shown using arrows. An activity may not start until its predecessor has been finished. This is called a ‘precedence network’ and is the most versatile method for depicting the logical sequence within a project. For complex projects they are best prepared using project planning software.
For planning workshops the activities, milestones and deliverables may be written on Post-It Notes. Then, starting at the end of the project with the final deliverable, you need to ask yourself: ‘What would I need to have in place in order to achieve this?’ This sequence is repeated until the start point in the project is reached (see Project Workout 21.1 on p. 345).
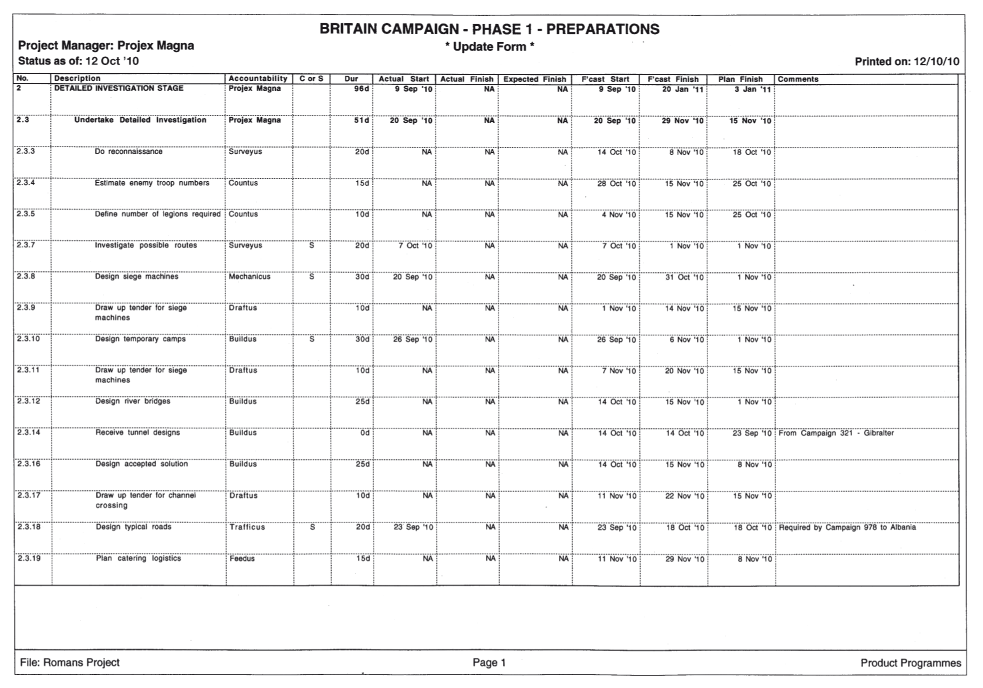
Report used to update the forecast
Update form
Purpose
The update form is used to collect data for tracking progress on the project (Figure 21.9).
When to use
The form is used every time the project manager wishes to check on progress. This should be at least monthly, at month-end, but for many projects it is desirable to update the project weekly or fortnightly.
Completion
The form comprises a filtered selection of unstarted and incomplete activities within a given date range. It has the following columns:
- the reference number of each activity;
- activity description;
- C column (complete) and S column (started);
- the actual start and finish dates;
- the expected finish date (for started activities);
- the forecast start and finish dates calculated the last time the project was updated;
- the baseline planned finish date (as a reminder);
- a comment column to record pertinent notes.
The person responsible for reporting progress:
- enters S for all started activities in the ‘S’ column and the actual start date and expected finish date in the relevant columns;
- enters C for all completed activities in the ‘C’ column, giving actual start and actual finish dates.
If it is apparent that forecast dates for future activities are wrong, sufficient information should be given to enable these to be replanned. Those activities which should have started, but have not, should be slipped forward to start on the update date – their finish date will also slip unless the duration is changed.
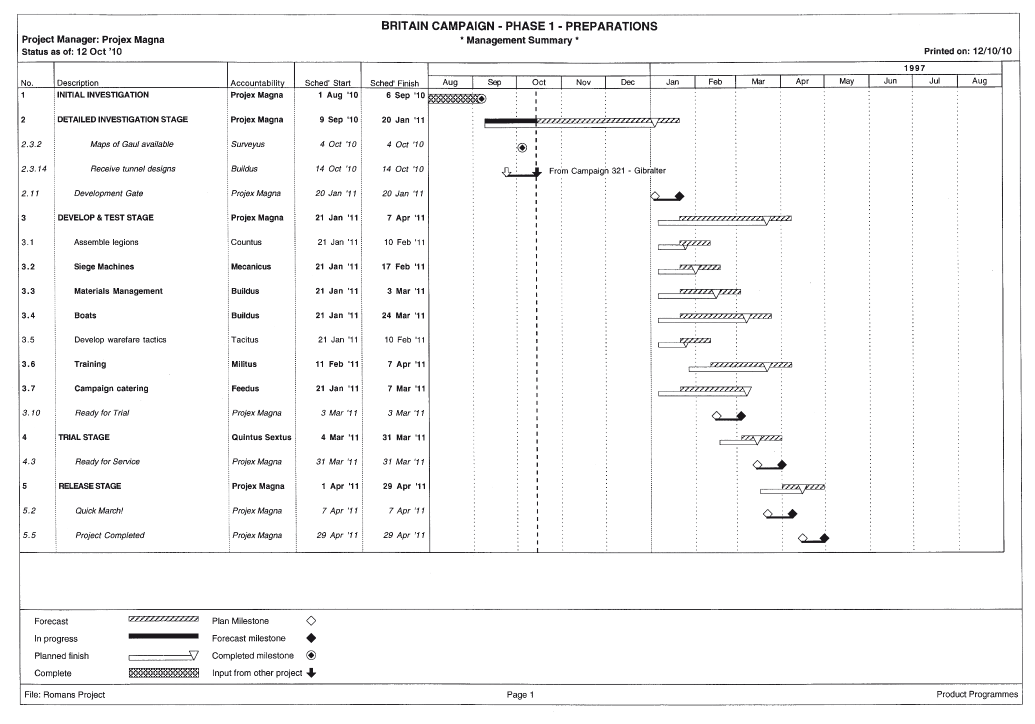
Reports used for progress reporting
Management summary
Purpose
The management summary is a concise presentation of the progress bar chart (Figure 21.10) aimed at providing a summary report on project progress.
When to use
This format is best used for reporting to project boards, project sponsors and other stakeholders.
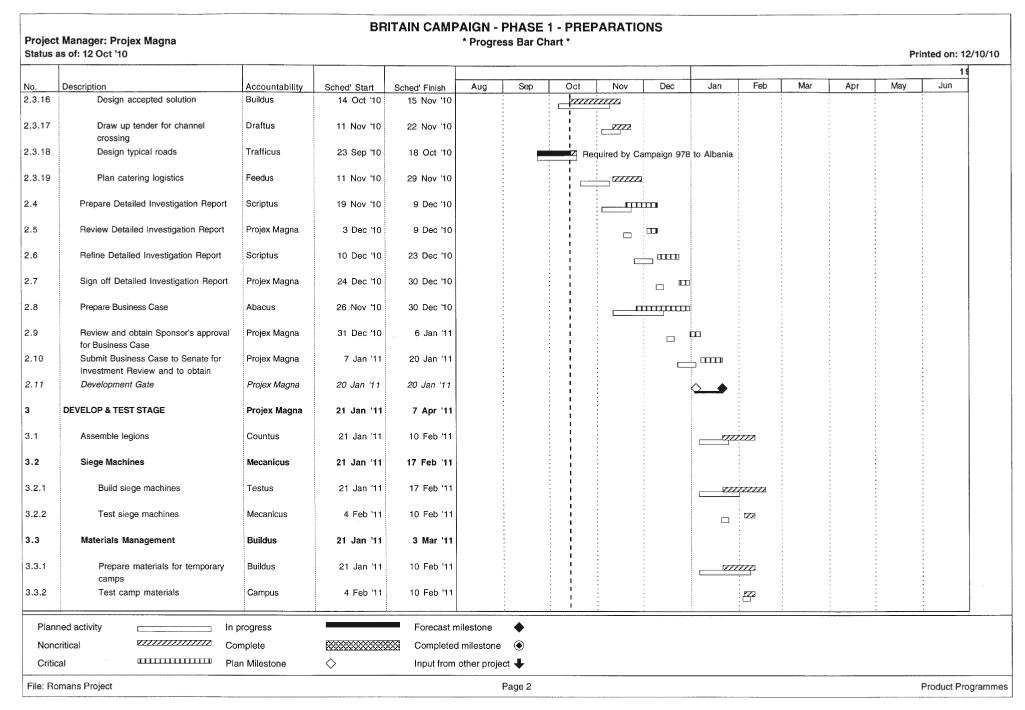
Progress bar chart
Purpose
The progress bar chart is a more complex version of Figure 21.8 which is used to compare forecasts against the agreed plan and hence highlight variances (Figure 21.11).
The progress bar chart shows the current forecast dates for each activity and milestone compared with the baseline plan. The dates given are the actual or current forecast dates. Comments from the progress ‘update form’ (see Figure 21.9) may be included against any item.
When to use
The bar chart is probably the most effective way of communicating a schedule. Progress reports may be made more concise if a bar chart is used to detail progress rather than progress being described in text.
Completion
Bar charts can be produced manually or by using computer software at summary/outline and detailed levels. They are produced from the activity list once the start and end times of each activity have been calculated. The left-hand portion contains a reference number, description, duration, the initials of the person accountable, and the start and finish dates. The right-hand part shows a bar against a timescale which spans from the start to the finish of the activity. Milestones (dates for key events) are shown as diamonds. The plan dates are shown as a line below the current forecast so that a visual appreciation of slippage is readily apparent. Figure 21.3 describes how to read the bar chart.
More complex but informative versions of the progress bar chart can be developed which show the ‘float’ available for each activity and dependencies between activities.
Slippage report
Purpose
This report is used to focus attention on activities which are likely to be late. This enables the project manager to take whatever action is necessary to bring the project back on schedule. The objective is not to use the report as a tool to ‘punish’ those accountable for slippage, but rather to focus attention on putting things right. With this in mind, the slippage report details only incomplete activities (Figure 21.12).
When to use
This report is useful for identifying those current and future activities which are forecast as slipping and hence focus attention on remedying the situation. It is best used for plans of more than 50 activities when a software package can extract the ‘offending’ activities automatically. If you are using critical chain schedule management this report will be replaced by a buffer report (see Figure 21.17).
Completion
The report is compiled by extracting the late (and unfinished) activities from the updated activity list. Most computer project-planning packages have routines for preparing this type of report.
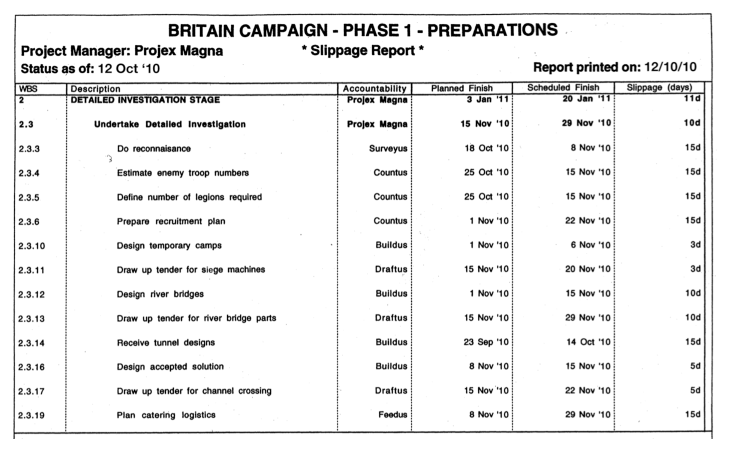
Figure 21.12 A typical slippage report
Milestone report
Purpose
The milestone report shows progress against the key targets for the project. These are items which should be specifically mentioned in the project documentation (Figure 21.13).
When to use
This format is an excellent, non-graphical way for communicating progress and expectations on the timing of key milestones such as the delivery dates for products, or interface dates with other projects.
Completion
The report is presented in tabular form showing the milestone description, the planned date, the current forecast of the date and the actual date achieved. The final column indicates the slippage (how late) of a milestone compared to the plan. The report is made up of all those activities of zero duration from the activity list which the project manager wishes to highlight. Most computer project-planning packages have routines for preparing this type of report.
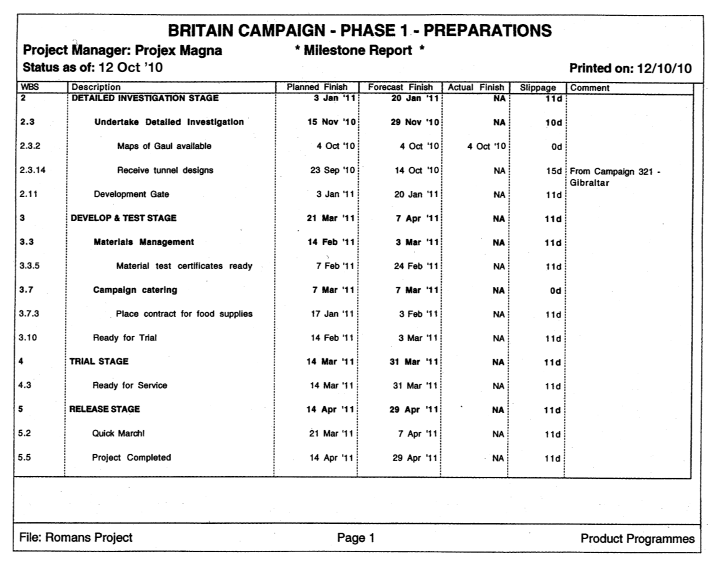
Figure 21.13 A typical milestone report
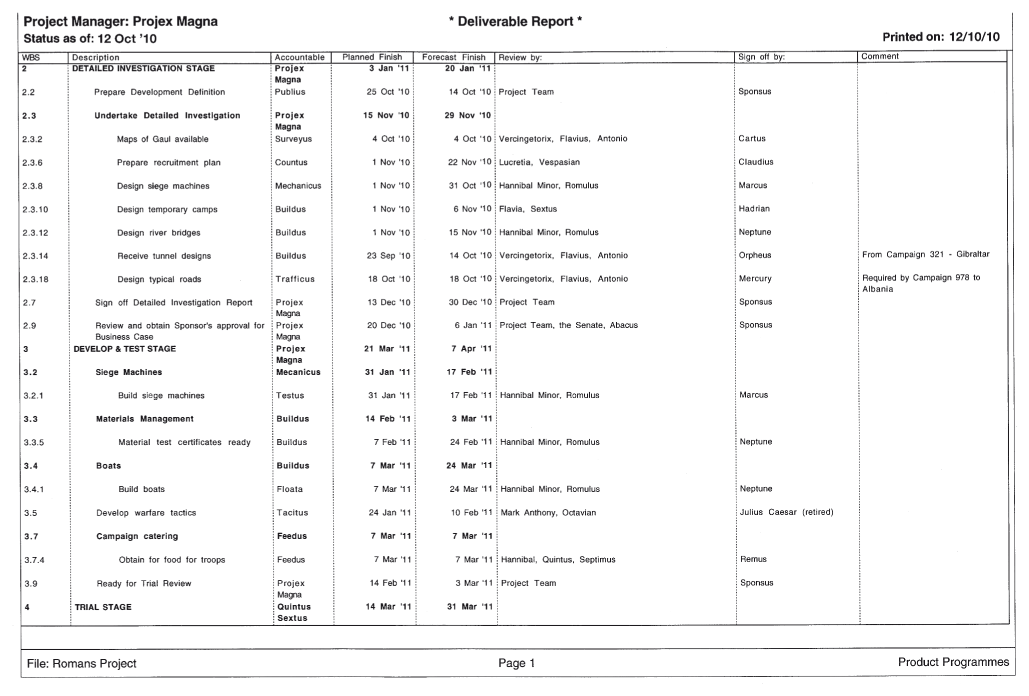
Deliverable report
Purpose
The deliverable report lists all the key deliverables from the project stating who is accountable for preparing them reviewing them and finally signing them off. These are items which should be specifically mentioned in the project documentation (Figure 21.14).
When to use
This format is used when the project manager wants to focus on the deliverables and be explicit about who is accountable for the quality aspects for each.
Unless we know who is to review a deliverable and sign it off, we cannot be certain that what is being produced is really fit for purpose.
Completion
The report is an extract from the full project plan with those activities and milestones relating to deliverables filtered out to produce a listing. Most computer software packages can be customised to do this.
So why are we nearly always late?
‘How does a project get to be late? … one day at a time.’
F BROOKS
Despite decades of project management experience, backed up by ever more sophisticated technology, projects are still late. Unless, of course, the timescales set were so generous that even a donkey could have brought it in on time. That, however, is hardly a situation most business managers will find themselves in. When really questioned about project timescales most people will admit that speed is not necessarily the most important aspect but predictability is. If you are developing a new product, most marketing and sales people would rather have it in four months’ time, if promised in four months’ time (and working) than have it in three months’ time when promised it in two. Once you have achieved predictability, you can concentrate on reducing the overall time taken.
We have seen that a project’s duration is basically the sum of the guesses of the durations of those activities on the critical path. This is the definition of critical path. We decide the project approach using network planning and guess (some guesses are very sophisticated) how long each activity will take, bearing in mind the resources needed to work on it. It’s all very logical. From here on, human behaviour takes over. If I am a project team member, which of the following should I ask the project manager to put in the plan:
- a short duration I am unlikely to meet;
- a medium duration I might meet if I’m lucky;
- a prudent (longer) duration I’ll probably meet?
Most people will choose the last of these – they like to be considered reliable. What then happens is they:
- start work on the activity as late as possible as more ‘urgent work’ is needed first (it’s just as well they put in a prudent estimate);
- work on other projects at the same time, juggling between the frantic exhortations of the different project managers and their line manager;
- have a meeting cancelled and so actually start work and finish it EARLY. But they don’t tell anyone, just in case they are expected to be so fortunate next time, i.e. late handovers.
In short this one activity is protected by a safety margin which the team member’s experience shows is needed. In fact, all activities have their in-built safety. The major drawback is, from an organisation‘s viewpoint, it doesn’t matter whether a particular activity is late or not. What matters is when the project as a whole delivers and benefits start to flow. Conceivably a project could be 95 per cent on time and grossly late. Safety is not additive if it is wasted. Statistically, projects plans built this way are more likely to be late than on time. They will hardly ever be early!
The critical chain – a solution?
In his book Critical Chain, Eli Goldratt proposes a solution to this problem. Rather than add safety into each activity, as described here, add it in a single lump at the end of the project (Figure 21.15). In practical terms he says:
- cut the durations given by the team in half;
- at the end of the project, add a safety time equal to half the sum of the safety times you trimmed.
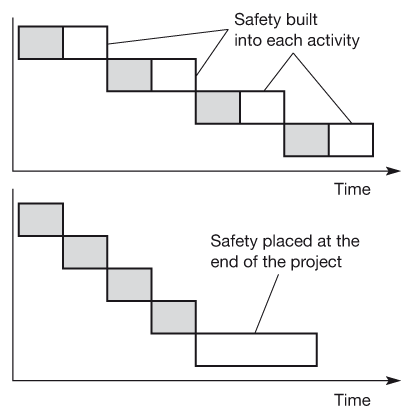
Figure 21.15 Putting safety where it counts
Removing the safety from each activity and placing it at the end of the project enables you to use it when you need to rather than have it wasted by the student syndrome (i.e. doing work at last minute), multi-tasking or late handovers.
In this way you can place the safety in a position where it really counts, at the end of the project, where you can use it.
However, you will have a number of challenges:
- Why should anyone accept you trimming their time estimates? Be very clear that you are adding half of it back at the end of the project.
- You’ll need to be very used to activities being ‘late’. In fact, ‘late’ may no longer be a useful word and this may have implications on reporting.
- You will need to become used to tracking projects by measuring how much safety is consumed rather than by activity completion alone.
- You will need to resist senior managers cutting the safety from the end and thus dooming you to certain failure.
You will also need to encourage three behaviours:
- Stop the student syndrome (i.e. doing work at the last minute).
- End multi-tasking.
- Encourage handover as soon as the activity is finished.
END OF THE PROJECT?
The safety should not actually be put at the end of the project. It should be placed prior to the point in the project when you start earning benefits. For most projects following the project framework in Part Two, this is at the Release Gate. The work beyond this, while essential, is not critical to immediate benefit realisation.
This method relies on you producing a good network diagram and resourcing the schedule in a similar way to traditional critical path methods. It differs, however, in:
- choosing a critical route through the project which includes activities which are either on the critical path or which form a constraint due to resource contention;
- the choice made for activity duration and where any safety is placed.
As we have seen, safety is placed towards the end of the project. This is called a project buffer. However, if a project has a network with several feeders, you will need to protect the critical chain from delays in incoming activities. Feeder buffers are used for this. A project buffer protects the entire project from any delay in the critical chain activities. The feeder buffers protect the critical chain from delays on non-critical chain activities (Figure 21.16). The project manager uses a buffer report as the key monitoring tool (Figure 21.17).
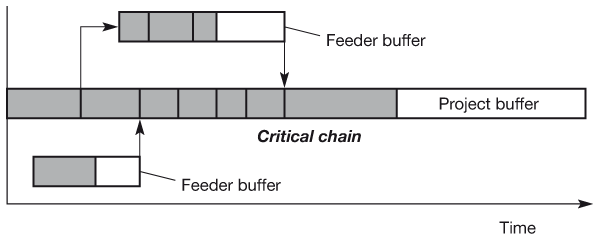
Figure 21.16 Project and feeder buffers
A project buffer protects the entire project from any delay in the critical chain activities. The feeder buffers protect the critical chain from delays on non-critical chain activities.
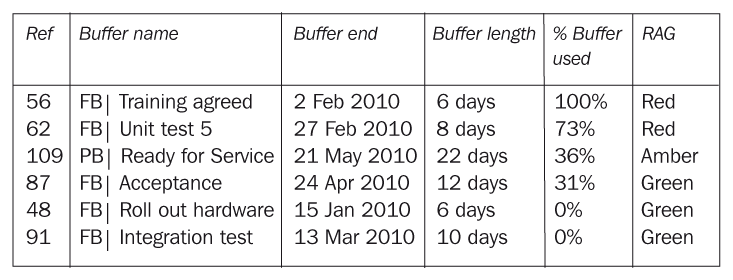
Figure 21.17 A typical report using critical chain schedule management
Rather than concentrate on activity dates, the report shows each buffer by type (FB = feeder buffer; PB = project buffer), its length and how much has been used. From this, the project manager can pinpoint the parts of the schedule which require attention. A simple RAG status helps summarise the status, e.g. Green more than 66% of buffer remaining; Red less than 33% of buffer remaining; Amber 33–66% remaining.
Steps in the critical chain
1 Identify the constraint
The critical chain is the sequence of dependent events that prevent the project from being completed in a shorter interval, given finite resources. For a project, the critical chain is the constraint. Plan the network, resource the network, ensure that the activities have safety built in. Schedule the network with everything as late as possible.
2 Exploit the constraint
You need to ensure those activities on the critical chain have the most effort applied to them and that people hand off their work to the next person as soon as they are finished. Also, those taking over need to be warned and so be ready to accept the handover (this is called a resource buffer or flag). You also need to protect the entire critical chain with a safety margin (the project buffer) towards the end of the project.
3 Subordinate every other activity
Where other activities join the critical chain, protect them from delays by introducing feeder buffers.
4 Elevate the constraint
Apply more of the right resources so that key activities within the critical chain can be undertaken in parallel or in a shorter time.
5 Begin again?
Having elevated the constraint, it is probable that the critical chain will have moved. You could therefore start the process again. However, in practice this will not usually create significant gains for you unless you have created a very significant change. Generally, it is better to stick to the plan, the inefficiencies in realigning the project team to understand the new plan will far outweigh most other gains. The exception to this is when approaching the RED zone in your project buffer – you will need to take action and this could be one option to investigate.
The steps outlined are a central part of applying the Theory of Constraints (TOC). A full explanation of critical chain schedule management in both single and multiproject environments is to be found in The Critical Chain by Eli Goldratt (North River Press, 1997).