
CHAPTER 9
Can the Board Avoid the Synergy Trap?
Tools for the Board
Directors have the primary fiduciary duties of loyalty and care in fulfilling their responsibilities. The duty of care asks whether they have acted as “ordinary and prudent people would act under similar circumstances.” Boards are routinely given a board book that reviews the strategy and valuation of the deal that management is promoting, and directors will certainly ask several questions based on the information they are given. But are they asking the right questions or having the right discussions, given that so many bad deals make it out of the boardroom?1
Although acquiring boards are protected by the broad protections of the business judgment rule, what if directors asked the questions that ordinary prudent people might ask regarding these major capital investment decisions? For example, how much shareholder value are we putting at risk if synergies don’t materialize? Does it make a difference for our investors if we pay with cash versus stock? What percentage reduction in cost or percentage increase in revenues are we promising our investors (and telling the market), and are those beliefs at all sensible or plausible? Do we know how much the integration will cost, and how many people will be involved? Do we have a clear structure in place that will guide the process for integration planning before closing with a real business plan? And what if there were tools that could quickly raise major red flags that would drive specific questions to management about the viability of the proposed deal and help spot the high-probability losers?
Directors need more and better information about proposed deals before they cast their votes. Remember that negative market reactions are often driven by a gap between what management believes and what investors perceive, so presumably boards will want useful lenses to stress test deal economics, the messages CEOs are about to give the market, and the level of preparation required to immediately begin delivering on their promises. Indeed, no longer would any board worth its salt rely merely on an investment banker’s fairness opinion to justify the payment of a significant acquisition premium.
This chapter offers several simple analytical tools and straightforward questions that can help boards spot those deals that are likely to result in negative market reactions and drive more informed discussions about potential material deals. The tools include:
- Shareholder Value at Risk (SVAR), which is a measure of the materiality of a deal.
- The PMI Board Pack, which sits alongside the valuation and strategic rationale in M&A board packages.
- The Meet the Premium (MTP) Line and Plausibility Box, which plot the point of cost and revenue synergies, as will be reflected in the investor presentation, to see if the proposed deal lies above or below the line and if the combination is plausible based on company and industrial history of synergy realization.
- The Capabilities/Market Access Matrix and the Synergy Mix, which are another sanity check of whether or not the proposed combination of cost versus revenue synergies makes sense given the nature of the assets coming together.
These tools will help close the gap between what management believes and what investors are likely to perceive before the market does. Senior management—it should go without saying—should know the answer to all these questions before the board gets involved. With these tools, boards will be better able to answer the fundamental question: How will this transaction affect our share price and why?
Shareholder Value at Risk
In chapter 4 we made the case that the purchase price of an acquisition is typically driven by the pricing of other comparable acquisitions (“compaqs,” or precedent transactions)—often without a rigorous assessment of where, when, and how management can drive real performance gains. At the minimum, boards should be able to articulate how much shareholder value is immediately put at risk by their decision to approve a deal. Further, other choices that management recommends—particularly using cash versus stock to pay for the deal—impact the risks that boards should be able to understand.2
Before committing to a major deal, both parties will need to assess the effect on each company’s shareholder value should the synergy expectations embedded in the premium fail to materialize. In other words, boards must ask “What percentage of our company’s market value are we betting on the success or failure of the acquisition?”
A useful tool for acquirers assessing the relative magnitude of synergy risk is a straightforward calculation we call Shareholder Value at Risk (SVAR). SVAR is simply the dollar premium paid for the acquisition divided by the market value of the acquiring company’s shares before the announcement is made.
This index also can be calculated as the percentage premium multiplied by the market value of the target relative to the acquirer. We think of it as a “bet your company” index, or a measure of the materiality of a deal, which shows how much of your company’s shareholder value is at risk if no post-acquisition synergies are realized. The greater the percentage premium paid to sellers and the greater their market value relative to the acquiring company, the higher the SVAR. As we’ve discussed, it’s possible for acquirers to lose even more than their premium (if there is damage done to stand-alone growth value of either company). In these cases, SVAR underestimates risk.
The use of cash versus stock as the method of payment has profound ramifications for the shareholders of both acquiring and target companies, and a substantial impact on SVAR. In a cash deal, the roles of the two parties are clear-cut, and the exchange of money for shares completes a simple transfer of ownership. But an exchange of shares presents a far less clear picture of who is the buyer and who is the seller. In some cases, the shareholders of the target company can end up owning most of the acquirer that bought their shares.3
Companies that pay for their acquisitions with stock share both the value and the risks of the transaction with the shareholders of the company they acquire. The decision to use stock instead of cash can also affect shareholder returns. Past research on M&A has consistently found that, at the time of announcement and beyond, shareholders of acquiring companies fare worse in stock transactions than they do in cash transactions. What’s more, the findings from our M&A study confirm this and show that early performance differences between cash and stock transactions get greater—much greater—over time.4
Despite their obvious importance, these issues are often given short shrift. Boards, executives, and journalists tend to focus mostly on the prices paid for acquisitions. It’s not that it’s wrong to focus on price; price is certainly an important issue confronting both sets of shareholders. But when companies are considering making—or accepting—an offer for an exchange of shares, the valuation of the company in play becomes just one of several factors that managers and investors need to consider. Let’s look at the basic differences between stock and cash deals.
Back to basics: cash versus stock trade-offs
The main distinction between cash and stock transactions is this: In cash transactions, acquiring shareholders take on the entire risk that the present value of synergies embedded in the acquisition premium will not materialize. In stock transactions, that risk is shared with target’s shareholders. More precisely, in stock transactions, the synergy risk is shared in proportion to the percentage of the combined company the acquiring and target shareholders each will own.
To see how that works, let’s look at a hypothetical example. Homeland Technologies wants to acquire Affurr Industries. Homeland has a market capitalization of $5B, made up of 50 million shares priced at $100 per share. Affurr’s market capitalization now stands at $2.8B—40 million shares each worth $70. The executives of Homeland estimate that by merging the two companies, they can create an additional synergy value of $1.7B. They announce an offer to buy all the shares of Affurr at a price of $100 per share. The value placed on Affurr is therefore $4B, representing a premium of $1.2B over the company’s preannouncement market value of $2.8B.
The expected net gain to the acquirer from an acquisition, the net present value (NPV), is the difference between the estimated present value of the synergies obtained through the acquisition and the acquisition premium (as we defined in chapter 1). If Homeland chooses to pay cash for the deal, then the NPV for its shareholders is simply the expected present value of synergy of $1.7B less the $1.2B premium, or an expected gain of $500M.
But if Homeland decides to finance the acquisition by issuing new shares, the NPV for its existing shareholders will be reduced. Let’s suppose that Homeland offers one of its shares for each of Affurr’s shares. The new offer places the same value on Affurr as did the cash offer. But on the deal’s completion, the acquiring shareholders will find that their ownership in Homeland has been reduced. They will own only 55.5 percent of a new total of 90 million shares outstanding (50 million original plus 40 million new) after the acquisition. Their share of the acquisition’s expected NPV is only 55.5 percent of $500M, or $277.5M. The rest goes to Affurr’s shareholders, in addition to the premium, who are now shareholders in an enlarged Homeland.
The only way that Homeland’s original shareholders can obtain the same NPV from a stock deal as from a cash deal will be by offering Affurr fewer new shares. They could try to justify this approach by pointing out that each share would be worth more with the expected synergies included. In other words, the new shares would reflect the value that Homeland’s executives believe the combined company to be worth rather than the $100-per-share pre-announcement market value.
But while that kind of deal sounds fair in principle, in practice Affurr’s shareholders are unlikely to accept fewer shares unless they are convinced that the valuation of the merged company will turn out to be even greater than Homeland’s estimate. In light of the disappointing track record of acquirers, particularly in stock deals, this is a difficult sell.
On the face of it, then, stock deals offer the shareholders of the target company the chance to profit from the potential synergy gains that the acquirer expects to make above and beyond the premium. That’s certainly what the acquirers will tell them. The problem is that the shareholders of the target company will also have to share the risks.
Let’s suppose that Homeland’s purchase of Affurr is completed with an exchange of shares, but none of the expected synergies materialize. In an all-cash deal, Homeland’s shareholders would shoulder the entire loss of the $1.2B premium paid for Affurr. But in an all-stock deal, their loss is only 55.5 percent of the premium. The remaining 44.5 percent of the loss—$534M—is borne by Affurr’s shareholders.
In many takeover situations, the acquirer will be so much larger than the target that the target’s shareholders will end up owning only a negligible proportion of the combined company. In that case, the target’s board must decide whether they would recommend a decision to own the acquirer’s shares in the first place (and worry less about the plan).
So let’s see what the SVAR numbers are for our hypothetical deal. Homeland was proposing to pay a premium of $1.2B, and its own market value was $5B. In a cash deal, its SVAR would therefore be 1.2 divided by 5, or 24 percent (or relative size of 56% ($2.8B/$5B) times the percentage premium of 43%). But if Affurr’s shareholders are offered stock, Homeland’s SVAR decreases because some of the risk is transferred to the target’s shareholders. To calculate Homeland’s SVAR for a stock deal, you must multiply the all-cash SVAR of 24 percent by the percentage that Homeland will own in the combined company, or 55.5 percent. Homeland’s SVAR for an all-stock deal is therefore just 13.3 percent (see table 9-1).
The SVAR for a mix of cash and stock is the weighted average of the percentage of the deal value from cash times the all-cash SVAR plus the percentage of the deal value from stock times the all-stock SVAR, so SVAR for a combination deal will be somewhere in between the SVAR for an all-cash or all-stock deal based on the mix of cash and stock. Using the data above for Homeland, with a mix of 50 percent cash and 50 percent stock, would yield an SVAR of 18.7 percent ((0.5 × 24%) + (0.5 × 13.3%)).
A variation of SVAR, what we call “Premium at Risk,” can help shareholders and the board of a selling company assess their risks if the synergies don’t materialize. The question for sellers is, What percentage of the premium is at risk in a stock offer? The answer is simply the percentage of ownership the seller will have in the combined company. In our hypothetical deal, the Premium at Risk for Affurr’s shareholders is 44.5 percent (40 million new shares divided by 90 million total shares outstanding). Once again, the Premium at Risk calculation is actually a conservative measure of risk, as it assumes that the value of the independent businesses is safe and only the premium is at risk. But as many acquirers have demonstrated, unsuccessful deals can cost both parties more than just the premium.
TABLE 9-1
Acquirer SVAR% in all-cash versus all-stock deals
|
Ratio of stand-alone value of target to stand-alone value of acquirer | ||||||||||
|---|---|---|---|---|---|---|---|---|---|---|
|
.25 |
.50 |
.75 |
1.00 | |||||||
|
ALL-CASH DEAL | ||||||||||
|
30 |
7.5 |
15 |
22.5 |
30 | ||||||
|
Premium (%) |
40 |
10 |
20 |
30 |
40 | |||||
|
50 |
12.5 |
25 |
37.5 |
50 | ||||||
|
60 |
15 |
30 |
45 |
60 | ||||||
|
ALL-STOCK DEALA | ||||||||||
|
30 |
3.75 |
7.5 |
11.25 |
15 | ||||||
|
Premium (%) |
40 |
5 |
10 |
15 |
20 | |||||
|
50 |
6.25 |
12.5 |
18.75 |
25 | ||||||
|
60 |
7.5 |
15 |
22.5 |
30 | ||||||
|
a Acquirer owns 50% of the combined company | ||||||||||
How Can Companies Choose?
Given the dramatic effects on value that the method of payment can have, boards of both companies have a fiduciary responsibility to incorporate those effects into their decision-making processes. Acquirers must be able to explain to their shareholders why they will have to share the synergy gains of the transaction with the shareholders of the target. For their part, the target’s shareholders, who are being offered stock in the combined company, must be made to understand the risks of what is, in reality, a new investment. All this makes the board members’ job more complex.
Questions for the acquirer
The management and the board of an acquiring company should address two economic questions before deciding on a method of payment. First, are the acquiring company’s shares undervalued, fairly valued, or overvalued? Second, what is the risk that the expected synergies needed to pay for the acquisition premium will not materialize? The answers to these questions will help guide companies in making the decision between a cash and a stock offer. Let’s look at each question in turn.
Valuation of acquirer’s shares. If the acquirer believes that the market is undervaluing its shares, then it should not issue new shares to finance a transaction, because to do so would penalize current shareholders. Research consistently shows that the market takes the issuance of stock by a company as a sign that management—who is in a better position to know about its long-term prospects— believes the stock to be overvalued. Thus, when management chooses to use stock to finance an acquisition, there’s plenty of reason to expect that company’s stock to fall.
What’s more, management teams that offer what they believe to be undervalued stock to pay for an acquisition often base the price of the new shares on the current “undervalued” market price rather than on the higher value they believe their shares are worth. This can cause a company to pay more than it intends, and in some cases to pay more than the acquisition is worth. Suppose that Homeland believed that its shares are worth $125 per share rather than $100. Its managers should value the 40 million shares it plans to issue to Affurr’s shareholders at $5B, not $4B. Then if Homeland thinks Affurr is only worth $4B, it ought to offer Affurr’s shareholders no more than 32 million shares.
In the real world, though, it’s not easy to convince a disbelieving seller to accept fewer but “more valuable” shares. If an acquiring company’s executives believe that the market significantly undervalues their shares, their logical course is to proceed with a cash offer. Yet the same CEOs who publicly declare their company’s share price to be too low will cheerfully issue large amounts of stock at that “too low” price to pay for their acquisitions. Which signal is the market more likely to follow?
Synergy risks. The decision to use stock or cash also sends signals about the acquirer’s estimation of the risks of failing to achieve the expected synergies from the deal. A really confident acquirer would be expected to pay for the acquisition with cash so that its shareholders would not have to give any of the anticipated synergy gains to the target’s shareholders beyond the premium.
But if management believes the risk of not achieving the required level of synergy is substantial, it can be expected to try to hedge its bets by offering stock. By diluting its company’s ownership interest, it will also limit participation in any losses incurred either before or after the deal goes through. Once again, though, the market is well able to draw its own conclusions. Indeed, empirical research, including ours, consistently finds that the market reacts significantly more favorably to announcements of cash deals than stock deals.
Stock offers, then, send two powerful signals to the market: that the acquirer’s shares are overvalued and that its management lacks confidence in the acquisition. In principle, therefore, an acquirer that is confident about integrating an acquisition successfully, and believes its own shares to be undervalued, should always proceed with a cash offer. A cash offer neatly resolves the valuation problem for acquirers that believe they are undervalued as well as for sellers uncertain of the acquiring company’s true value.5
But it’s not always so straightforward. Quite often, for example, an acquirer does not have sufficient cash resources—or debt capacity—to finance a cash offer. In that case, the decision is much less clear-cut, and the board must judge whether the additional costs associated with issuing undervalued shares still justify the acquisition.
Questions for the seller
In the case of a cash offer, the selling company’s board faces a straightforward task. It has only to compare the value of the company as an independent business against the price offered. The only risk is that it could hold out for a higher price or that management could create more value if the company remains independent. The latter case certainly can be hard to justify.
Let’s suppose that Affurr’s shareholders are offered $100 per share, representing a 43 percent premium on the current $70 price. Let’s also suppose, without considering taxes, that they can get a 10 percent return by putting this cash in investments with a similar level of risk. After five years, the $100 would compound to $161. If the bid were rejected, Affurr would have to earn an annual return of more than 18 percent on its currently valued $70 shares to do as well. So uncertain a return must compete against a bird in the hand.
More than likely, though, the target company’s board will be offered stock or some combination of cash and stock and so will also have to value the shares of the combined company being offered to its shareholders. In essence, shareholders of the target will be partners in the post-merger enterprise and will therefore have as much interest in realizing the synergies as the shareholders of the acquirer. If the expected synergies do not materialize or if other disappointing information develops after closing, the target’s shareholders may well lose a significant portion of the premium received on their shares.
If a target company’s board accepts an exchange-of-shares offer, it is endorsing not only the offer as a fair price for the company’s shares, but also the idea that the combined company is an attractive investment—so it needs to evaluate the deal logic and integration plan (see the PMI Board Pack below). Essentially, then, the board must act in the role of a buyer as well as a seller, and must go through the same decision process that the acquiring company follows before it recommends an investment decision on behalf of their shareholders.
No matter how a stock offer is made, the target’s shareholders should never assume that the announced value is the value they will realize before or after closing. Selling early may limit exposure, but that strategy carries costs because the shares of target companies typically trade below the offer price during the pre-closing period. Of course, shareholders who wait until after the closing date to sell their shares of the merged company have no way of knowing what those shares will be worth at that time.
The questions we have discussed here—How much is the acquirer worth? How likely is it that the expected synergies will be realized?—address the economic issues associated with the decisions to offer or accept a particular method of payment for a merger or acquisition. There are other issues of tax treatment and accounting that the advisers of both boards will seek to bring to their attention. But those concerns should not play a key role in the evaluating SVAR.
The PMI Board Pack
As we discussed at length in chapters 6, 7, and 8, post-merger integration (PMI) is a highly complex process. The pace, importance, and sheer number of decisions that will need to be made for a merger far outstrip the normal rate of decision-making. Combining two organizations with distinct cultures while trying to manage business as usual and protect the day-to-day cash flow is daunting. In most organizations, PMI is not a core skill.6
Directors must feel confident that the claims of management are supported by at least the foundations of an integration plan before approving a deal—and senior executives, knowing this, should be prepared by all of the work they have done to assess the deal. Ultimately, investors will want to feel confident that management has a plan.
Boards are regularly presented with a review of the strategy and valuation of the deal, often supported by a fairness opinion, but there is usually little about how the companies will be integrated. The PMI Board Pack is designed to help the board ensure that senior management is ready to avoid the common pitfalls of PMI. As a summary for board members, there are four major reasons that PMI efforts fail to deliver what has been promised:
- Loss of focus: There is little structure to the PMI so executives and employees are distracted from running the businesses and worrying about customers and competitors. Employees spend a lot of time looking for other opportunities.
- Wasted time: The organization does not appear able to begin generating synergies at closing so the present value of any synergies eventually obtained is greatly reduced. As delays continue, employees lose confidence in the deal’s strategic rationale and competitors have time to respond. Management fails to prioritize and make tough decisions, either not addressing the big, tough decisions early, or getting mired in slow decision-making processes.
- Competitor reactions and changing business environment: The PMI is carefully planned but lacks a structure that will allow the organization to quickly revisit and modify plans as needed. In short, the PMI becomes so internally focused that the organization is not prepared to respond to changing business conditions.
- Failure to follow through on plans: The PMI focuses on designing the new organization and delivering early synergies but not on resolving the thousands of bottom-up issues to transition the organization through the end state vision. The result is a failure to deliver the new organization needed to support the businesses and achieve the synergy targets.
During its review of the deal, the board is in a unique position to ensure not only that a proposed transaction makes sense strategically and financially but also that the groundwork has been laid to deliver the promised results. Without such plans, deal value may begin to leak. By making specific demands of senior management, directors can have a tremendous influence on the outcome. Before a deal is approved by the board and announced publicly, senior management should present the following five essential elements:
- A PMI process calendar showing phasing of activities and decisions
- The key top-level shaping decisions to be made up front
- A tailored integration approach that is clearly articulated
- The structure, teams, and resourcing to deliver the PMI
- The business plan that delivers the performance promises for the deal
PMI process calendar
A successful PMI is a structured series of events that begins long before and continues long after the deal closes. A proposed calendar of activities, along with a timetable of what is to follow, should give the board a good view of the phasing of PMI activities. In many disastrous transactions, the CEOs have stated for the record that there was little in the way of PMI planning. By reviewing a calendar and timetable, the board could have easily seen the problems that were to come. In fact, by the time directors even consider an M&A proposal, the PMI process planning should already be well underway. At this stage, there are hundreds, if not thousands of key decisions yet to be made. Yet, senior management should be able to discuss the basic elements of a PMI plan.
Senior management will not be able to go into the detail that we lay out earlier in the book, but they can walk the board through an overview of the phases of a typical PMI, how they will be addressed, and on what timeline. Those phases are:
- Up-front planning and direction setting
- Data gathering
- Design and decision-making
- Implementation
Up-front planning and direction setting coincide with due diligence and valuation work. In hostile transactions, it will have to be completed only with publicly available information on the target. At this point, senior management determines the integration approach and the broad outline of the new operating model (which connects a company’s deal thesis and business objectives with its processes, capabilities, and organizational structure), and makes key decisions on timing, team structures and roles, resource allocation, and performance targets. These elements, which form the rest of the PMI Board Pack, must be in place before the deal is announced.7
Data gathering and analysis, which began during diligence and can now be readily facilitated, should begin immediately following Announcement Day. Integration workstreams will collect information on the current operations of the two organizations, then share and compare them to identify key differences and similarities—particularly with an eye toward major integration activities and synergies. Clear guidelines must be established, with the help of legal counsel, for what data can and cannot be shared between the two companies prior to closing and what competitively sensitive data will have to be put into a clean room. Analysis will examine such issues as establishing the financial baseline for the combined organization, and how to stabilize the businesses during PMI.
Design and decision-making will include issues like integration opportunities consistent with the new operating model, organization design, synergy targets, and integration workplans that will deliver results. This will start as data is shared and, depending on the speed of regulatory approval, will likely continue after closing once the clean rooms are open. In this critical phase, which will begin to shape the new company, teams gain a deeper understanding of each company’s history, culture, strategies, and decision-making styles. This understanding should emerge as integration options for the new company are developed, evaluated, and debated. The recommendations developed in this phase need to deliver the promised synergies.
Implementation starts at deal closing and continues until all key integration steps are taken—which may take as much as a year to 18 months after closing. At this point, a management priority is leading the transition from an integration team structure to business as usual in the new organization. This must include rigorous integration and synergy tracking that maintains high visibility of synergy commitments and accountability for the actions needed to deliver them, in addition to preserving the momentum of the underlying businesses.
The point here is, again, that the management team will not have all of the answers. But they should be able to present a calendar and timeline outlining all of these steps, as well as early principles that will guide the merger.
Key top-level shaping decisions
At the outset, several key decisions need to be made—or deliberately postponed—by the senior team for the PMI to move forward. These shaping decisions focus on integration scope and high-level organizational issues. They include what parts of the two companies are being fully integrated, for instance, and other top-level decisions like who will be the CEO (L0), their direct reports (L1), and initial details of changes to the operating model and the structure of the new organization.
The extent and nature of these up-front decisions will depend on the situation, but in general these decisions are not easily delegated to an integration decision-making structure. Some of these decisions might have been a critical part of the deal negotiation.
Some important decisions may have to be deliberately postponed. In a recent financial services merger, for example, the issue of how to merge the two branch networks was postponed for some time because of significant strategic branding issues that needed time to resolve, and because of data-protection laws that would constrain the sharing of customer data. Again, not all details will be available, but these shaping decisions, which help to set the direction for the new organization and have significant impact, should be made clear to the board.
Tailored integration approach
Few issues pervade organizational life during PMI more than uncertainty. If this uncertainty is not managed well, it will become destructive and almost surely undermine the process. Because all M&A deals are different, the senior team must agree on a clear, tailored approach to the PMI and be prepared to clearly communicate this to the board. This approach will include the scope of the integration, as well as its pace, tone, early integration priorities, and how key decisions will be communicated and when (see chapter 6 for more details).
If expectations are being set for the new organization—and they are—then the board should be privy to what those expectations are. The senior team must make sure the approach is logical given the deal thesis that is guiding the acquisition and forms the heart of the deal, and that their subsequent actions are consistent with the expectations they set for their organization.
In times of tension, management and employees will need to feel confident the senior team is “on the same page.” Mistakes in approach can lead to PMI failures that will later likely be blamed on culture clash. By exercising careful oversight, the board can pressure test the approach and help management avoid this pitfall.
Structure, teams, and resourcing
After key decisions are made and the approach to the integration is clear, a discrete integration structure, separate from running the individual businesses, is needed to manage the PMI. Senior management cannot be fully involved in the thousands of decisions, large and small, that must be made during PMI. Therefore, empowered PMI teams must be created with clear roles, responsibilities, and reporting relationships to make clear recommendations for top management (the SteerCo) to ratify.
Central to this is the Integration Management Office (IMO) and the workstreams that it oversees. The IMO and its workstream teams facilitate the structured collection of information on the companies and create early working relationships between the companies that will make possible some early successes. Teams within the IMO structure also drive the bottom-up approach that, combined with a tight calendar, forces senior management to make or ratify tough decisions and maintain momentum in the process. The board should have a view of the IMO and major workstreams, and who will be taken off day-to-day business to focus the integration, how many other staff will assist and for how long, and how much any external support will cost.
Senior management should also consider how to resource the PMI teams, especially the IMO. It is not unusual for 10 percent or more of senior and middle management to be heavily involved in the PMI process. Because these managers should be the most talented people from either organization, who and how much time will be required must be clear so that focus is not lost in keeping the ongoing businesses competitive during the PMI.
In short, the board should understand this structure, the key executives within the structure, and the likely timing and level of HR needed to drive the integration process—consistent with the chosen integration approach.
The business plan
Senior management must devise and present to the board a credible business plan for the new entity that spells out the synergy targets, major initiatives and goals, and one-time costs of the integration effort. Of course, all of that might be presented in the valuation, so the board should understand these broad targets and how management expects to achieve them—including the new operating model and any potential go-to-market strategy changes that will drive growth synergies or cost savings and justify the premium. It should be clear to the board that these synergy targets exceed a “baseline” of what the two firms were expected to achieve if the merger had never taken place. The detail of the business plan will evolve as the PMI moves forward from initial top-down synergy targets through to final synergy commitments built into internal budgets and plans.
Synergies are often not developed with sufficient rigor and may be buried in financial plans, or even the valuation, with little clarity or visibility. This can make it virtually impossible to know 6–12 months later whether any synergies have actually been achieved. To give performance targets more visibility, the board should see some additional integration measures and milestones, such as the timing of projected labor and non-labor synergies, facility closings, or new product offerings, so that the board can later assess the progress of the integration effort at future meetings.
The business plan is an operationalization of the business case and deal thesis: why the merged organizations will beat the performance trajectories already built into both companies’ share prices, and how it will offer more of what customers want and can get nowhere else, in ways not easily replicated by competitors. The integration process involves refining and gaining commitment to the business plan. The board must see not only a broad plan, but a process for testing, adjusting, and then keeping score against the plan during the implementation phase.
The PMI Board Pack offers the board an opportunity with every deal to assess these five elements—the calendar and phases of activities; top-level shaping decisions; the integration approach; structure, teams, and resourcing; and the business plan that delivers the performance promises for the deal.
To the last point—the business plan—we offer a suite of tools to help the board stress test that the financial goals of the deal are sound and plausible before they are presented to investors on Announcement Day.
The Meet the Premium Line and Plausibility Box
While much has been written about the shortcomings of relying on earnings accretion and market multiples to reach acquisition decisions, short-term earnings accretion to the acquirer remains one of the most popular thresholds in judging whether or not to do a deal. It’s also typically the first order of business in investor presentations. So rather than present one more argument against the popular use of earnings in evaluating M&A transactions, we show here how to use earnings-based financial information in a way that would be much more useful to senior executives and boards before they agree to pay a significant premium for another company.8
For any transaction with a significant SVAR (with significance to be set by the board), we present a simple “earnings” model for the target that yields combinations of cost reductions and revenue enhancements that would justify a given premium. This way, any talk of a deal being accretive to earnings—along with the logic of the deal—can then be readily scrutinized in operating terms that are familiar to most corporate managers and investors. While this is no substitute for a properly executed DCF valuation, it is another way of enabling boards to avoid obvious mistakes—especially when deals appear to be “accretive.” Our approach also yields some simple metrics that allow a sanity check of the PMI business plan.9
The equity market value of a public target (MVT) prior to the acquisition announcement can be expressed as a multiple (P/ET) of its after-tax earnings (ET) as follows:
(1) MVT = ET × P/ET
When an acquirer offers a premium (%P) for the target company, the dollar value of the premium offered is simply the product of the premium (%P) and the pre-announcement target equity market value (MVT).
That offer premium can also be stated in terms of the after-tax earnings of the target (ET) and its price-earnings multiple (P/ET):
(2a) %P × MVT = %P × (ET × P/ET) = (%P × ET) × P/ET
Equation (2a) implies that, in order to earn the dollar premium offered for the target, the target’s after-tax earnings (ET) must increase by %P and then be maintained in perpetuity. But this assumes that the earnings multiple (P/ET) of the target remains unchanged.10 Assigning the same P/E also assumes that any earnings improvement from synergies will be assigned the same P/E as the pre-deal P/E.11
To illustrate: If an acquirer offers a 20 percent premium over the target’s pre-announcement market value (and provided we assume a constant P/E), the target must generate a 20 percent increase in after-tax earnings. Substituting pre-tax profit margin (Π), revenue (R), and the effective tax rate (T) for ET, we have an expression of the incremental after-tax earnings required:
(2b) %P × ET = %P × (R × ![]() ) × (1 − T)
) × (1 − T)
Because this increase in after-tax earnings must be delivered through the generation of pre-tax synergies, these pre-tax synergies—%P × (R × ![]() )—are our focus.
)—are our focus.
Some acquirers focus exclusively on cost reduction or revenue improvement, but the more common approach is to seek a combination of the two.
In the case where an acquirer intends to earn the acquisition premium entirely through cost reductions, we define %SynC as equal to the pre-tax earnings improvement required as a percentage of the pre-acquisition addressable operating cost base of the target. We find %SynC to be a useful measure of how challenging it will be for an acquirer to justify the acquisition premium from an operational perspective. By putting the cost reduction in percentage terms, a CEO or business leader would need to defend the feasibility of the reduction.

Alternatively, using both pre-tax operating profit margin (Π) and revenues (R) to reflect the operating cost base in the denominator, we arrive at the following expression:

Equation (3b) shows that, by considering just the percentage takeover premium and the pre-tax operating profit margin (which we set as EBIT), the proposed pre-tax earnings improvement from a deal can be quickly evaluated from percentage cost reductions alone. So, for example, a proposed deal at a 35 percent premium on a target with an 18 percent pre-tax margin will require a 7.7 percent [0.35 × (0.18/(1 − 0.18))] decrease in operating costs to achieve enough pre-tax profit improvement to justify the premium and just break even. And remember, for those cost reductions to represent synergistic gains from the merger, the cost savings would have to come on top of any reductions already expected in the stand-alone plans of the two companies.
Although this may be intuitively obvious, the model suggests a more aggressive %SynC for higher-margin businesses for a given acquisition premium. This reflects the simple fact that a higher-margin business has a smaller percentage cost base. An aggressive %SynC in such a business requires going deeper to make a difference to the bottom line, and going deeper may mean cutting away fat and muscle—which makes meeting the premium through cost reduction more challenging.12
In cases with potential revenue as well as cost synergies, a simple adjustment to equation (3b) can be made to estimate the cost reductions that would be required after taking account of the benefits of the expected percentage increase in revenue, or revenue synergies (%SynR). In other words, the more synergy from revenue gains, the less the burden on cost reduction.
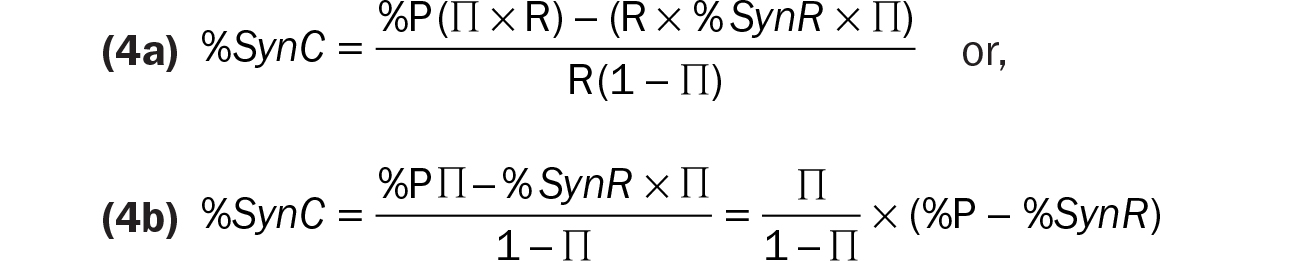
Using equation (4b), we can compute the cost synergies required to earn the offer premium for any deal, given three variables: the premium offered, the pre-tax operating margin (EBIT), and the expected percentage revenue synergies.13 If %SynR equals the premium percentage, then no cost synergies would be required in this model for a given acquisition premium.
The equation yields what we call the Meet the Premium (MTP) Line. Figure 9-1 shows the MTP Line that depicts those combinations of %SynC and %SynR that generate enough pre-tax synergies to equal—but not exceed—the hurdle posed by a 35 percent premium and a pre-tax operating profit margin of 18 percent. If the expected percentage revenue increases equal the premium percentage (35% in this example), then no cost reductions would be required to justify the premium. And, as we have already shown, in the absence of any expected revenue increases, the cost reductions necessary to meet the premium are 7.7 percent. (Those endpoints effectively represent the %SynC or %SynR required to meet the premium in the absence of the other.)
The MTP Line

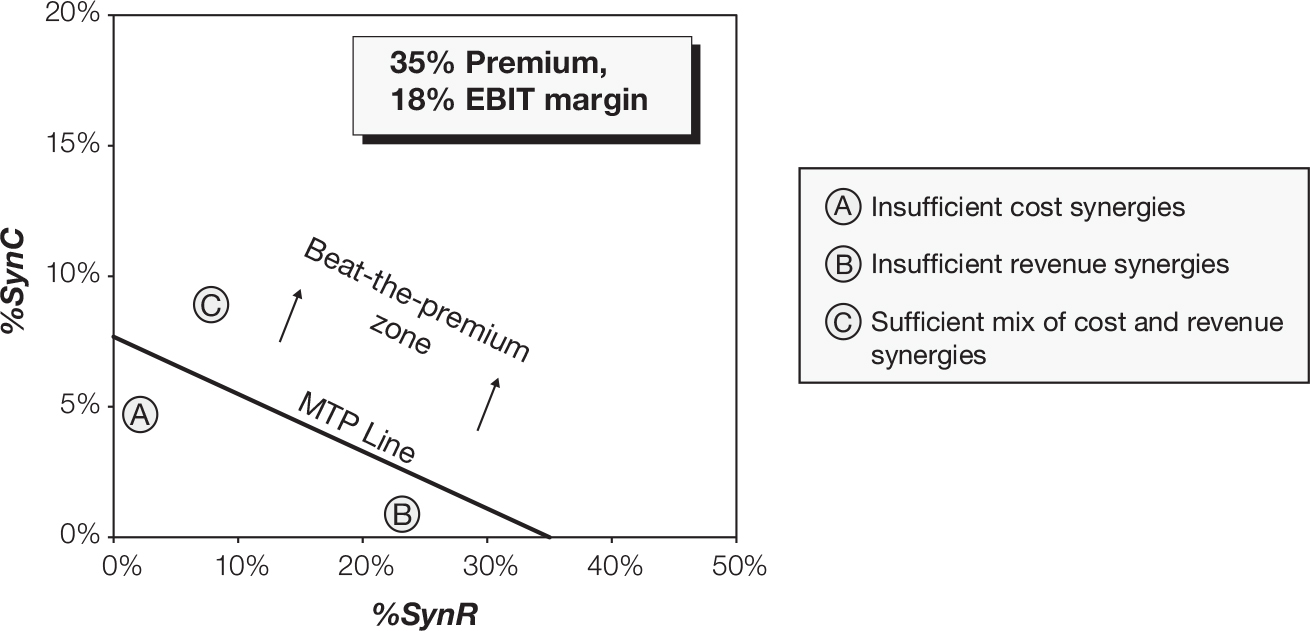
The importance of the MTP Line for senior management teams and boards is straightforward: Deals whose benefits put them below the line should be avoided—or at least put under more scrutiny. Points A and B are deals an acquirer should seek to avoid, whereas the expectations for the deal represented by point C would more than justify the premium using this approach. And the higher the premium paid for the target, the larger the combination of %SynC and %SynR necessary to earn the premium. (In terms of figure 9-1, any proposed increase in the premium above 35% would call for a parallel upward shift in the MTP Line.)
This simple picture can be used to inform and guide detailed discussions about the combination of revenue and cost synergies that management believes it can achieve in a potential deal—which should become the focus of management’s communication to investors. The upshot: If you can’t plot a point, what will you tell investors?
Besides testing the competitive assumptions that would drive projected revenue synergies, several other questions need to be answered. For example, what is the addressable cost base—that is, how much of the cost base can actually be reduced (does it include overheads, indirect expenses, etc.)? Deals with a seemingly high cost base may in fact have few components that can be managed, unless the acquirer has specific capabilities to do so. It also begs the big question of what the experience has been for the acquirer, and other acquirers in the industry, in realizing synergies in similar deals.
In our experience, companies are generally more successful in reducing costs than in increasing revenue. It is easier to take out costs by, say, closing facilities and reducing headcount; these are internal issues that are controllable, visible, and tangible. Cost considerations also generally come first. They tend to be approached by fresh troops with all their energy focused on getting something done and achieving quick cost-reduction wins.
Revenues, on the other hand, are affected by competitor and customer reactions. For this reason, they are harder to anticipate and control, particularly in cases where the benefits are expected to come from cross-selling initiatives. Moreover, the analysis and commitments required for growing the revenue line are often deferred until after the businesses are stabilized and the cost issues are under control. (See chapter 8 for a more detailed discussion on revenue growth.)
That delay, however, often has unwanted consequences. Competitors are given time to react in the marketplace by protecting their customers and approaching those of the new combined firm. They will anticipate the acquirer’s moves and court the best customers of the acquirer and target by playing up the disarray of the new firm and the lack of customer service that is likely to follow. Delaying the focus on revenue synergies also allows plenty of time for headhunters and competitors to poach the best salespeople. And it also often means that the organization is fatigued from the demands of PMI by the time it worries about its new go-to-market strategy and how it will serve customers in ways it couldn’t before. Moreover, when cost reductions take priority over revenue growth—or are just viewed independently of it—the infrastructure required to support potential revenue growth can end up being cut.
When evaluating projected synergies, setting reasonable thresholds above which successful cost reduction and revenue improvement become implausible is critical in assessing the extent of the operating challenges associated with any deal being contemplated. In figure 9-2, we show how these thresholds form a “Plausibility Box” that can be used to assess whether the envisioned combination of required synergies for a given target is reasonable, even when that point lies on or above the MTP Line.
The Plausibility Box

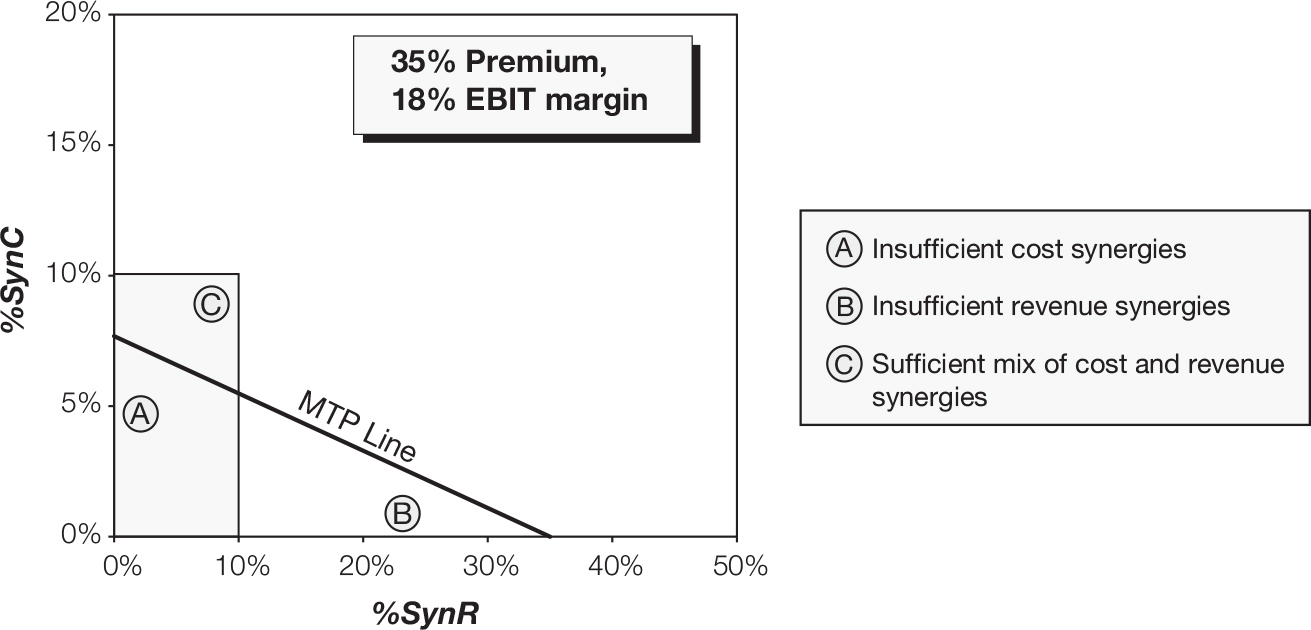
Figure 9-2 illustrates a hypothetical box with an upper range of 10 percent operating cost reduction and 10 percent revenue synergies.14 (Only point C is both plausible and sufficient to meet the premium.) In practice, an acquirer can set the parameters of this box any way it wishes provided it has the supporting evidence. The evidence can be drawn from an acquirer’s experience or industry synergy benchmarks. This is also a useful sanity check tool for assessing a sensible price range, given various combinations cost and revenue synergies.
Our assumption is that synergies will begin immediately, so any expected differences in the timing of revenue versus cost synergies must be made explicit and addressed. Any projected delay in realizing the synergies required to justify any significant premium will cause investors to mark down the price of the acquirer’s shares to reflect those delays right at announcement. As our M&A study clearly shows, that price reduction puts the acquirer into a hole and sets a negative tone that can affect organizational morale, especially those employees whose pension assets are invested in the acquirer’s stock.
In summary, boards must consider these two questions when evaluating a proposed deal:
- Does the proposed combination of percentage cost reductions and percentage revenue increases, the synergies, fall above the MTP Line?
- Does that point also fall inside a range that is plausible?
The Capabilities/Market Access Matrix and the Synergy Mix
Having set the stage for those two questions, the next step in the analysis is to consider whether the proposed combination of cost and revenue synergies—even if that point falls within the Plausibility Box—makes operating sense, given the strategic intent of the deal and the assets the transaction brings together. In this section, we present a framework for having that discussion. Then we use four major deals to illustrate how it might be applied.
There is a vast literature on the effects of diversification and relatedness on the value added by M&A.15 The objective of that literature has been to classify deals into a single category—typically “related,” “unrelated,” or some intermediate category—and then compare the average performance of the categories to judge which is better or worse. This literature also reflects a long history of academic debate, with a stream of conflicting findings.16 But while the debate has provided grist for the academic mill, it has given practitioners little help in assessing specific deals. And, unfortunately, the practitioner literature on the subject has also resorted to such “categorizing.” In this body of work, deals are typically referred to as “core,” occupying an “adjacent” space, or constituting a “diversifying” move.17
The problem with putting deals into such categories is the failure to consider the very real possibility that any given deal will span a range of categories, depending on the capabilities and market access that are brought together in the combination.
Figure 9-3a presents a three-by-three matrix that we have found far more helpful in both operating and board-level discussions than assigning deals to a single category based on a vague idea of relatedness. Using our framework, deals can fall into different combinations of categories, depending on the strategy for creating value and the assets that are being combined.18
With the help of figure 9-3a, any deal can be characterized in terms of 1) the parts of both businesses that offer the same capabilities (e.g., R&D, product design, product portfolio, operations, cost structure, supply chain, systems) and market access (e.g., channels such as sales force and third-party relationships, geographic presence, brand, channel power); 2) the parts of the businesses where one company has a clear advantage over the other and is simply better; and 3) the parts of the businesses that bring together new, or non-overlapping, capabilities or market access.
The shaded zones in the Synergy Mix chart in figure 9-3b illustrate how different spaces in the Capabilities/Market Access Matrix translate into different types of potential synergies, and thus map to a range of different cost and revenue synergy combinations on the %SynR/%SynC graph (on which we showed the MTP Line in figure 9-1). The result will form the basis for the mix of synergy expectations that management will hold up for investors.
Capabilities/Market Access Matrix and Synergy Mix

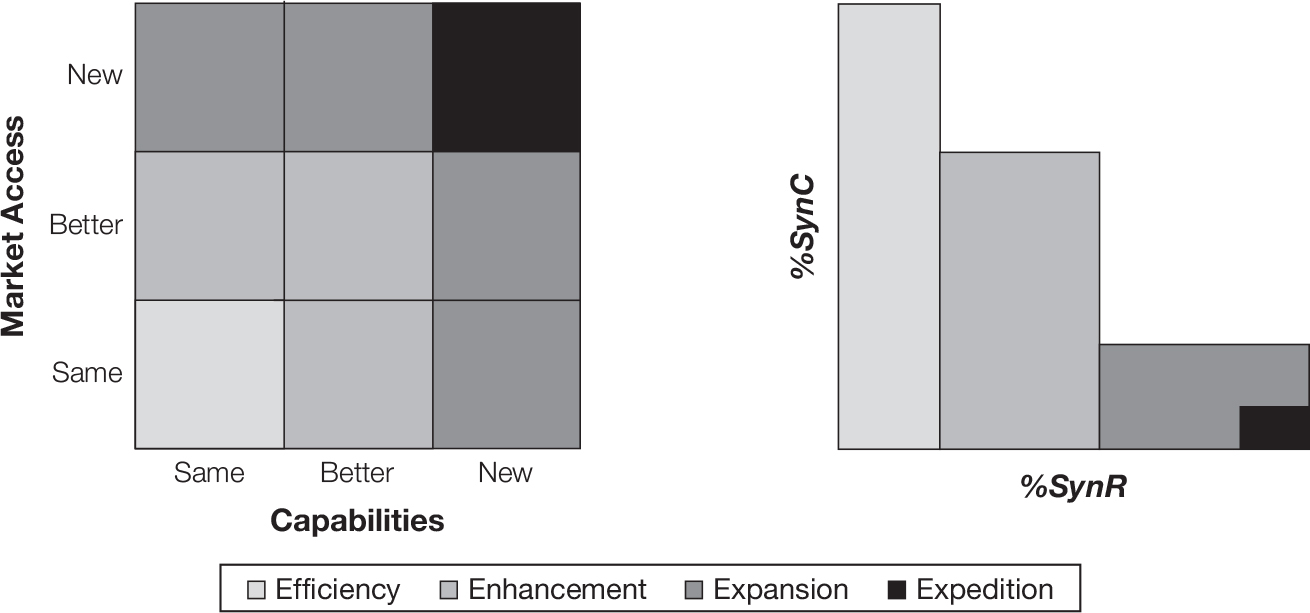
Different spaces in the capabilities/market access matrix suggest the potential to yield mainly cost or mainly revenue synergies, or a combination of both. Deals that bring together the same capabilities and market access will yield mainly cost benefits (“efficiency”) because of the potential for scale and redundancies. Deals that have overlap but bring better capabilities or market access can yield both revenue synergies and cost synergies (“enhancement”). And deals that bring together new capabilities or market access, with little overlap, will be expected to add value mainly through increases in revenue (referred to as “expansions” in cases where there is some overlap and as “expeditions” where there is none). Most significant deals will involve some combination of the nine spaces in the matrix. Now is the time to have these discussions.
Some examples
The 1991 Chemical Bank/Manufacturers Hanover transaction is a classic case of an “in-market” efficiency deal that would sit squarely in the lower-left corner of figure 9-3a. Thus, it would also be represented, in figure 9-3b, in the area of predominantly cost synergies. At the opposite extreme, in the upper right, is an expeditionary deal like AOL’s acquisition of Time Warner, which brought together the internet and traditional media—and would be expected to yield mainly revenue synergies, as indicated in figure 9-3b. Where a deal spans a variety of different spaces in the matrix, its Synergy Mix will be the weighted average of these underlying revenue and cost synergy combinations based on their individual proportions. The resulting point—all cost, all revenue, or some combination of benefits—is the appropriate %SynR/%SynC point consistent with the assets being combined, which will lie above or below the MTP Line shown earlier in figure 9-1. Investors will want to be able to plot the point an acquirer is suggesting.19
Viewing deals in terms of capabilities/market access “spaces” as being the same, better, and/or new has two main benefits: Deals can be broken down and valued by their individual components; and, perhaps more important, the plausibility of projected revenue and cost synergies can be evaluated based on an assessment of whether these spaces are likely to yield cost or revenue synergies. It forces management to address the following question: In the case of a proposed deal, what point above the MTP Line makes sense, given the nature of the individual pieces that comprise the overall transaction? And if management presents a combination of revenue and cost synergies that is clearly inconsistent with the spaces a given deal occupies on the matrix, that should send a warning signal. For example, if a deal plots largely in the top-right box of figure 9-3a and management is projecting significant cost savings, with no or poorly described revenue synergies, the deal should come under intense scrutiny.
Beyond the reasonableness of the Synergy Mix, figure 9-3a also allows us to gain some insight into the likelihood of achieving improved performance in various deals. The concentration of the components of the matrix that a deal spans in figure 9-3a essentially gives what can be viewed as the center of gravity of the deal. As noted earlier, projections of cost synergies are generally more reliable than projections of revenue synergies. And thus, for a given premium, deals with a center of gravity closer to the lower left are generally more likely to achieve projected synergies and are easier to justify a premium—that, at least, is likely to be the perspective of investors.
Such strategic analysis has major implications for a board assessing the value of a deal, for integration planning, and for guidance in writing a winning investor presentation. When a major transaction is announced, investors are trying to understand where the value is going to come from and whether the acquirer has a plan to achieve that value. Too often, deals are brought to market with one big synergy number, without a timetable, and with a statement that the deal will be accretive to earnings. The problem, however, is that investors can’t understand or track one number. Going to market with just one number also suggests that the acquirer doesn’t have a credible plan, which in turn gives investors more reason to sell shares than buy, particularly when a significant premium is being offered.
A Model of How to Do It
A good example of a transaction that gave investors trackable and defendable synergy forecasts, and thus signaled the acquirer truly had a plan, was PepsiCo’s $13.4B all-stock acquisition of Quaker Oats announced in December 2000.20 (We discussed PepsiCo’s investor presentation for the deal in chapter 5.)
PepsiCo’s management described in detail where it expected synergies, distinguishing highly probable gains from those it anticipated but did not include in the investor model. Recall that they identified a total of $230M of synergies, which they expressed in terms of the following contributions to operating profit: $45M from increased Tropicana revenues (same capability with better market access); $34M from Quaker snack revenues sold through the Frito-Lay system (same capability with better market access); $60M from procurement savings (same/same); $65M from cost savings derived from SG&A expenses, logistics, and hot fill manufacturing (same/same); and $26M saved by eliminating corporate redundancies (same/same).
Thus, the deal had a center of gravity relatively close to the core businesses (and the lower-left spaces of figure 9-3a), and it was clear what investors—and employees—could expect in the parts of the business from where synergies were to come. They could easily see how the deal would produce improvements in operating profit and more efficient use of capital that would more than justify the modest 22 percent acquisition premium.
The management team also articulated clearly how they planned to integrate Quaker Oats and several of its brands into PepsiCo and how capabilities from both companies would be leveraged to achieve additional growth. Moreover, Roger Enrico, PepsiCo’s outgoing chairman, stressed that management used conservative estimates for cost savings and revenue synergies.
PepsiCo’s announcement was received positively by investors. Its shares rose by over 6 percent (nearly $4B) in the days following the announcement and continued to outperform the shares of its industry peers throughout the decade after the transaction closed in August 2001.
Like PepsiCo, Nexstar Media’s $6.4B (with assumed debt) all-cash acquisition of Tribune Media, at a 20 percent premium, offered a compelling investor presentation with trackable synergies of $20M in corporate overhead savings, $65M of expense reduction from stations, and $75M of revenue synergies from net retransmission revenue applying Nexstar rates to Tribune’s subscriber counts—or $160M of synergies all realized in the first year after close. (We also addressed the Nexstar acquisition in chapter 5.) Nexstar CEO, Perry Sook, emphasized the company’s disciplined management team with a strong track record of M&A integration and delivering synergies (at close Nexstar increased its synergy projection to $185M).
Placing these synergy projections into figure 9-3a shows that the deal had a center of gravity close to the bottom left with $85M (same/same) from efficiencies and $75M (same capability/better market access) from revenue. That yielded a Synergy Mix consistent with the assets coming together and investors could easily plot the point of revenue and cost synergies that was above the MTP Line for an 11 percent increase (nearly $400M) in Nexstar’s shares at anouncement.21
And Some Contrast
A different picture is provided by AOL’s acquisition of Time Warner announced in January 2000, and Hercules’s acquisition of BetzDearborn announced in July 1998. The AOL/Time Warner deal involved a $51B premium (56%) and brought together radically different businesses, and yet the investor presentation projected $1B in cost synergies—without any guidance as to where those synergies would come from. That deal was what we would classify as an “expedition,” and thus there was no plausible basis for projecting that level of cost synergies.
The Hercules/BetzDearborn all-cash transaction involved a whopping 95 percent premium (nearly $1B) and brought together businesses that appeared to have some overlap in paper process chemicals, where $100M of cost synergies was projected in the investor presentation. But a closer look shows that Hercules competed in functional paper chemicals that improved the properties of paper while BetzDearborn sold paper process chemicals that improved the performance of paper machinery. In addition, more than half of BetzDearborn’s $1.3B of revenues came from a large water treatment business in which Hercules had no presence.
While both Hercules and BetzDearborn had significant channel overlap with paper customers, the deal would have mapped mainly into the expansion and expedition spaces on the right side of our matrix in figure 9-3a. Thus, according to the Synergy Mix diagram in figure 9-3b, we would have expected to see management projections mainly of revenue synergies from cross-selling initiatives but only a modest amount of cost reduction (e.g., corporate overhead).
Figure 9-4 illustrates the case for each of the four deals.22 The lines on the graph represent the MTP Lines as noted for each deal, and the dots represent the corresponding combination of revenue and cost synergies that were presented in the respective investor presentations.23 While all four of those points fall within our hypothetical plausibility box from figure 9-2, only the proposed Synergy Mixes for the PepsiCo/Quaker and Nexstar/Tribune deals lie above the MTP Line. More important, the points for both PepsiCo/Quaker and Nexstar/Tribune indicate a combination of projected cost and revenue synergies that is consistent with the deal strategy and the assets that were brought together.
Announced %SynR / %SynC points relative to MTP Lines

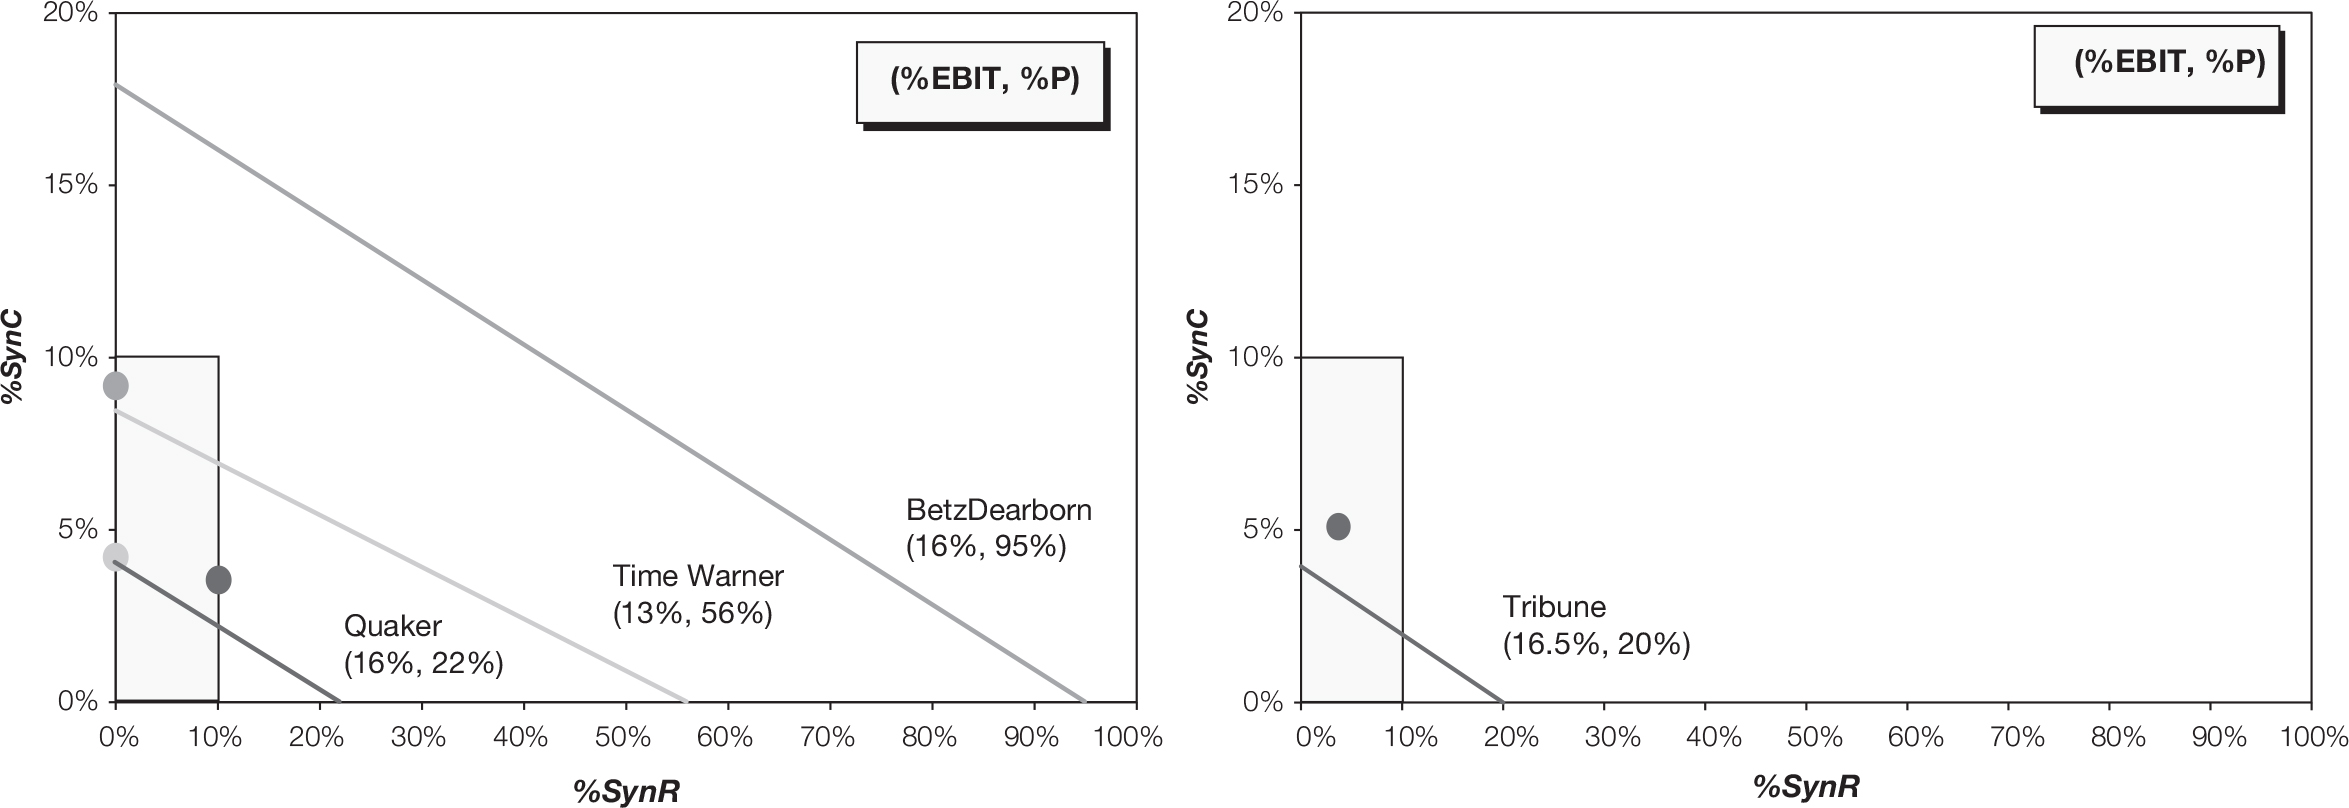
Note: Quaker dot is plotted at (10.0%, 3.6%); Time Warner dot is plotted at (0.0%, 4.2%); BetzDearborn dot is plotted at (0.0%, 9.2%); Tribune dot is plotted at (3.7%, 5.1%).
The $1B of pre-tax cost synergies announced for AOL/Time Warner put the deal well below the MTP Line in figure 9-4. Moreover, the resulting projected %SynC of roughly 5 percent is difficult to substantiate given the expeditionary nature of the deal (i.e., “new/new” in figure 9-3a). Not surprisingly, the initial market reaction to the announcement of the AOL/Time Warner deal was significantly negative—a 15 percent decline (or more than $30B)—and the synergies had been discounted to almost zero by the time the deal closed.24
Similarly, the $100M of pre-tax cost synergies projected for the Hercules/BetzDearborn deal put that transaction far below the MTP Line and without a sensible Synergy Mix. The announcement of the deal was met with a nearly 14 percent reduction (or $485M, almost half the premium) in the price of Hercules shares and the company’s shares continued to fall from there.
Conclusion: The Duty of Care Imperative
Major acquisitions are only one of many governance issues on the plate of today’s boards—but it is a big one. Directors now understand they will be held accountable by shareholders, especially for “bet the company” decisions. Poorly planned and executed acquisitions have almost certainly destroyed far more investor value than managerial acts of fraud. (See the sidebar, “Questions from the Board.”)
Questions from the Board
We offer the following list of straightforward questions that any board can go through with its CEO on a proposed deal. If the CEO cannot answer these questions, then they are clearly not prepared to talk to investors—or the board.
- Is there evidence this deal emerged from a clear strategic process?
- How is the deal consistent with our long-term objectives for customers, markets, and products or technologies?
- What are the stand-alone expectations of the acquirer and target?
- Where will performance gains emerge as a result of the merger?
- Are the projected performance gains in line with the premium being paid?
- Which competitors are likely to be affected by the deal?
- How will those and other competitors likely respond?
- What are the milestones in a 12–18 month implementation plan?
- What additional investments (one-time costs) will be required to support the plan?
- Who are the key executives responsible for implementing the plan?
- Which pieces of either company are good candidates for sell-off or spin-off?
- Why is this deal better than alternative investments or other deals?
Although the methodology we’ve presented here is by no means a substitute for thorough due diligence of the deal thesis, a proper DCF analysis of a proposed deal value (see chapter 4 for our analysis of DCF valuations), and early PMI planning, it is a useful complement, and we hope it can be used to provide CEOs and boards with relatively simple but reliable guidance and the basis for active discussions with senior leadership. Where the results of our methods are at odds with the DCF analysis (or EVA assessment) and the logic of the inputs, then the assumptions of the DCF analysis should be investigated.
The key issue that boards must address is: How will this deal affect our stock price and why? The time to stress test the deal strategy, proposed benefits, valuation, integration preparation, and communications plans of the senior team is not after the deal is announced. Implementing our approach may seem challenging, but it translates to some minimum basic considerations for directors. Before approving a deal and recommending it to shareholders, directors should ensure that senior management offers a clear business case and has an operating model—and a plan—in place. And, knowing this, senior executives must be prepared to withstand such scrutiny.