
APPENDIX A
Shareholder Returns from M&A
There have been hundreds of M&A studies published over the past 40 years. The articles published in volume 11 of the Journal of Financial Economics (1983) launched a flood of academic papers across many disciplines, resulting in now vast M&A literatures across finance, economics, management, accounting, and beyond. Academics have studied everything from shareholder performance for acquirers and targets to incentives and motivations of managers to the impact of acquisition experience and different accounting treatments.
Although studies of M&A performance tend to focus on acquirer shareholder returns around announcement (measured with different periods of days), some studies measure performance over longer periods of time. Moreover, the measurement of shareholder returns itself has varied from raw returns to market-adjusted returns, mean-adjusted returns, and the common cumulative abnormal returns (CARs) generated from so-called event studies. Scholars have also extensively studied before and after accounting-based returns such as return on assets (ROA) or return on equity (ROE).
It is also important to recognize that different studies examine different periods of time, which is natural because we have lived through several major M&A waves, and there are lots of choices on how many years to cover, which can generate varying results.
For our study, we set out to explore how acquirers’ investors fared around deal announcement, which we measured as the 11-day return of five trading days before and after announcement, and how they fared over the course of one-year post announcement (including the announcement period). Both measures were adjusted by a peer index (i.e., industry adjusted) within the S&P 500, as classified by the Capital IQ platform. We used shareholder returns because companies are often judged by whether they are superior performers based on that measure. We report the mean industry-adjusted returns, often called relative total shareholder returns (RTSRs).
We drew from widely used databases and used straightforward measures that both characterize shareholder returns from M&A and are readily replicable. (Note that our overall announcement return to acquirers of −1.6% is close to Graffin, Haleblian, and Kiley’s 2016 finding of −1.4% in a study that used CARs from 770 deals.)1
We decided to begin where Mark had left off in The Synergy Trap with deals announced from January 1, 1995, through December 31, 2018—a 24-year period. We assembled a preliminary sample of roughly 2,500 deals worth over $100M using Thompson ONE, where we applied the following criteria: Both companies had to be listed on a US stock exchange, the relative size of the seller to the buyer had to be at least 10% based on pre-deal equity market capitalization, and the buyer could not have completed another material deal in the year following, so that the one-year performance measurement period was not affected by other material deals.
These criteria yielded a sample of 1,267 deals representing $5.37 trillion of equity value and $1.13 trillion of premiums paid. Capital IQ was the source for buyer and seller share prices, market capitalizations, and shareholder and industry returns data (adjusted for stock splits and dividends). All data and results are reported at the mean (average value).2
Shareholder Returns to Acquirers: Overall Results
Adding combo deals (mix of cash and stock) to our overall findings table on shareholder returns to acquirers from chapter 1, we find a similar pattern as for all-cash (“cash”) and all-stock (“stock”) deals, as shown in table A-1.
Highlights
- For the 1,267 deals, industry-adjusted announcement returns are negative (−1.6% return) with 60% of deals met with a negative reaction (percent negative reaction (PNR) of 60%); 56% of deals have negative one-year returns (−2.1% return). Overall, nearly 40% of all deals are persistently negative while 23% of all deals are persistently positive.
- Cash deals significantly outperform stock and combo deals on announcement (+1.8% vs. −2.9% and −2.1%, respectively) and one-year returns (+3.8% vs. −5.7% and −1.9%, respectively). That outperformance for cash deals is also reflected by the cash PNR of only 43% versus 65% and 64% for stock and combo deals, respectively. That contrast is also shown by the percentage of persistently negative cash, stock, and combo deals (27%, 46%, and 39%, respectively) versus persistently positive deals (35%, 20%, and 19%, respectively).3
- Initially positive and initially negative portfolios remain significantly positive and negative over the course of one year, respectively, for each deal type—market reactions matter. For example, overall, the initially positive portfolio with a +7.7% return maintains a strong positive one-year return of +8.4%, and the initially negative portfolio with a −7.8% return maintains a strong negative return of −9.1%.
- Negative reactions are more persistent than positive reactions, with 65.2% of initially negative deals remaining negative and 57.1% of initially positive deals remaining positive. Negative reaction stock deals are the most persistent with 71.1% remaining negative.4
- The persistence spread (the difference between the one-year returns on the persistently positive and persistently negative portfolios) is 59.4% overall, with cash deals having the largest persistence spread of 65.3%.
- Premiums paid get progressively higher as we move from the persistently positive through persistently negative portfolios. Overall, the premium paid for persistently negative deals is 27% higher (33.8% vs. 26.6%) than those paid for persistently positive deals. That contrast is even more pronounced for cash and stock deals, with 33% higher (36.6% vs. 27.6%) and 46% higher (32.8% vs. 22.5%) premiums paid, respectively, for the persistently negative versus persistently positive deal portfolios.5
Table A-2 offers some illuminating characteristics of the 1,267 deals, adding details behind the overall results.


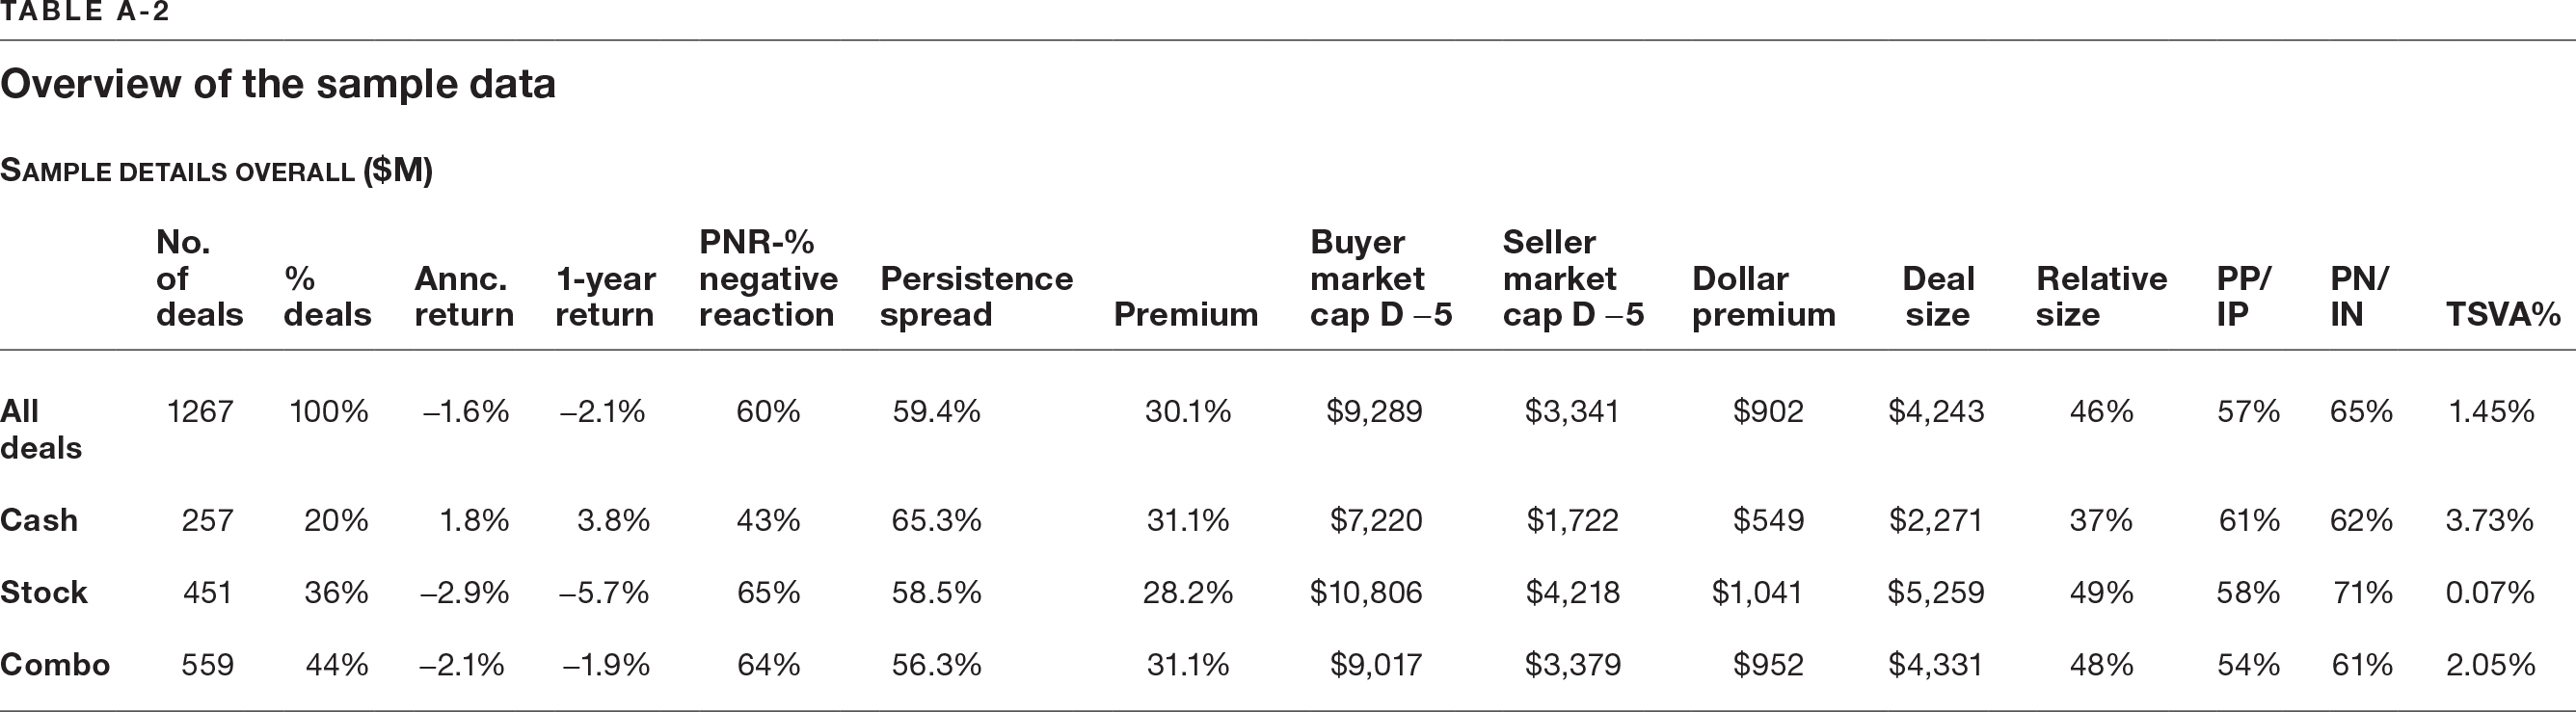
Highlights
- Overall, the average size of buyers is $9.3B and the average size of sellers is $3.3B.
- Cash buyers are smaller ($7.2B) than stock and combo buyers ($10.8B and $9B, respectively).
- Deal size (Day −5—five trading days before announcement—seller market cap plus the dollar premium) for cash buyers is much smaller ($2.3B) than the deal sizes for stock and combo deals ($5.3B and $4.3B, respectively).
- Premium paid is 30.1% or $902M overall. Dollar premiums paid for stock and combo deals are much higher than for cash deals because those deals are much larger as is their relative size.
- Relative size (seller to buyer market cap 5 days before announcement) is 46%. Cash deals have a much lower relative size (37%) than stock and combo deals (49% and 48%, respectively).
- Stock deals are the most persistent for initially negative reactions (Persistently Negative/Initially Negative or PN/IN of 71%) and cash deals are the most persistent for initially positive reactions (Persistently Positive/Initially Positive or PP/IP of 61%).
- Total shareholder value added percentage (TSVA%)—the sum of the dollar announcement returns to buyers and sellers as a percentage of their combined market caps—is positive (+1.45%), with cash deals having the highest TSVA% (+3.73%). Mergers create value overall; see the section on TSVA below.
Shareholder Returns to Acquirers over Time
Time period is an important consideration, so we divided the sample into three eight-year periods: 1995–2002, 2003–2010, and 2011–2018. Admittedly, these three periods are arbitrary, but each period contains a wave of M&A activity, and there is a fairly even distribution of deals across the three periods (410, 415, 445, respectively). Table A-3 shows the overall results for the 1,267 deals across the three periods.

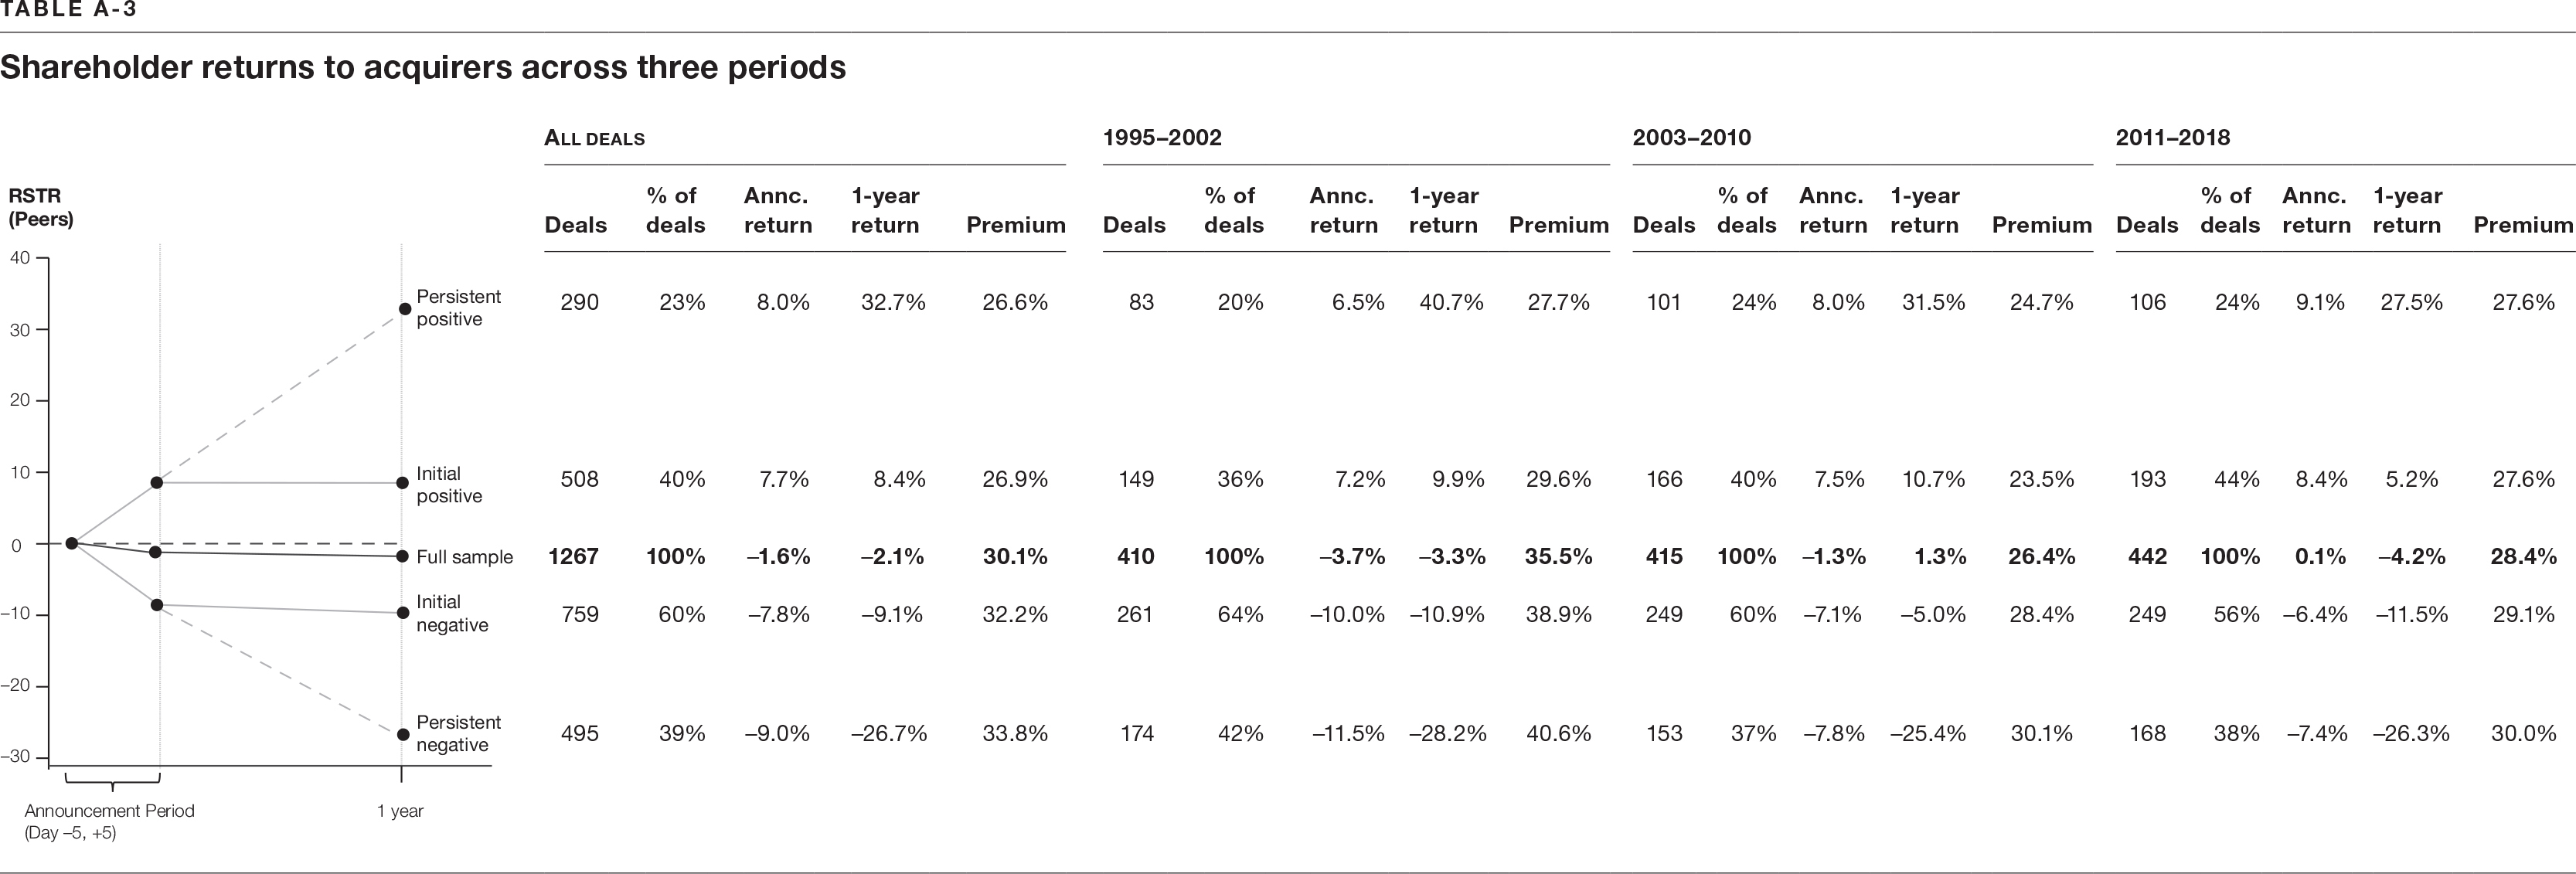
Highlights
- Announcement returns have improved over time (a trend consistent with the 2017 finding of Alexandridis, Antypas, and Travlos) from −3.7% in the first period to nearly zero in the third.6 However, one-year returns, after a significant improvement from −3.3% to +1.3% in the first to second period, remain challenged in the third period with a −4.1% return.
- PNRs have improved across the three periods (64%, 60%, 56%, respectively).
- Initially positive and initially negative portfolios remain significantly positive and negative, respectively, as represented by their one-year returns across the three periods (+9.9%, +10.7%, +5.2% vs. −10.9%, −5.0%, −11.5%, respectively)—market reactions matter.
- Persistence for initially positive deals across the three periods (56%, 61%, 55%, respectively) emphasizes the need for acquirers to effectively deliver and report results. Persistence for initially negative reactions, in contrast, remains compelling across the three periods (67%, 61%, 67%, respectively), further supporting the point that negative reactions are tough to turn around.
- The persistence spread has decreased from 68.9% in the first period to 56.9% in the second to 53.8% in the third period—there remains an enormous spread of returns between the persistently positive and persistently negative portfolios.
- The relationship of higher premiums paid as we move from persistently positive through persistently negative portfolios has maintained, although the differences in the extremes have narrowed and premiums overall have declined from their overall highs of 35.5% in the first period to 28.4% in the third period.
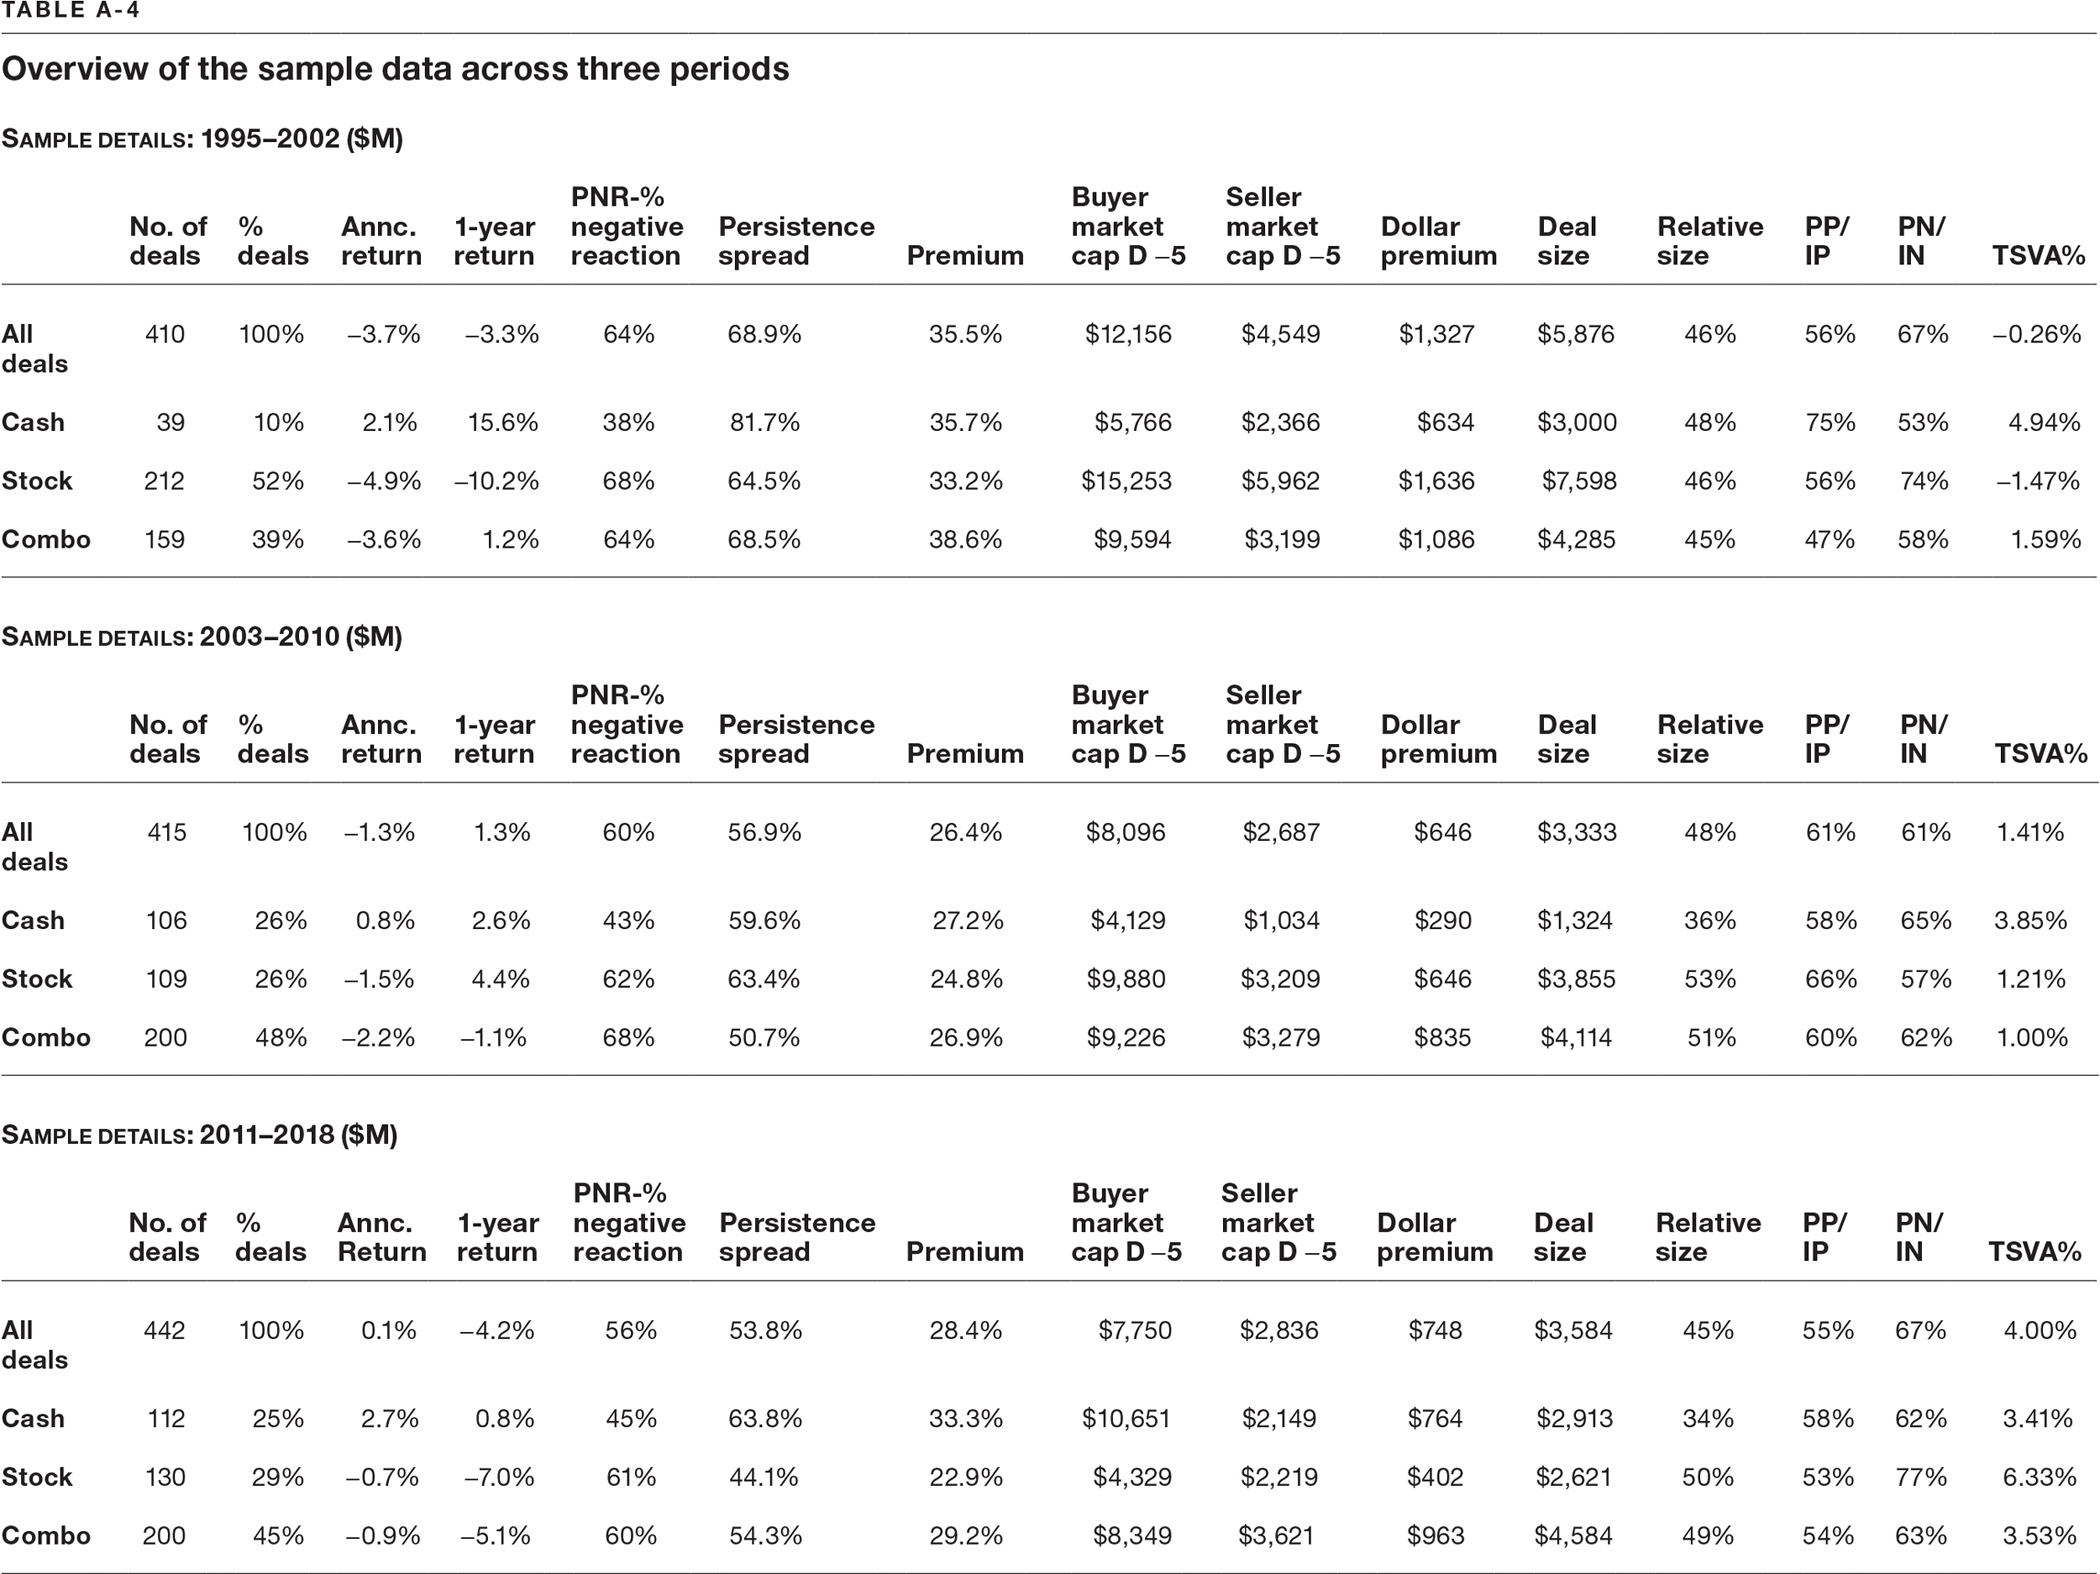
Table A-4 provides an overview of additional details of the sample of 1,267 deals across the three time periods.
Highlights
- Overall, the average size of buyers and deal size has declined from the first period, largely attributable to stock deals, which fell sharply from $15.3B and $7.6B in the first period to $4.3B and $2.6B in the third period, respectively. Also notable, in the other direction, the size of cash buyers and their deal size more than doubled from $4.1B and $1.3B in the second period to $10.7B and $2.9B in the third period, respectively.
- Cash deals have increased as a percentage of total deals from their low of only 10% during the 1990s merger boom to 26% and 25% in the second and third period, respectively.
- Announcement returns have improved for stock and combo deals, though still negative, from −4.9% and −3.6% in the first period to −0.7% and −0.9% in the third period, respectively. Announcement returns for cash deals have been positive across the three periods (+2.1%, +0.8%, +2.7%, respectively).
- One-year returns have varied by deal type, and by period, but are showing sharp declines in returns in the third period for all deal types, especially for stock and combo deals (−7.0% and −5.1%, respectively). That reflects our point in chapter 1 that we are not out of the woods on buyer performance; see also the overall year-by-year charts below.
- PNRs have increased for cash deals from 38% in the first period to 43% in the second and 45% in the third period but are still significantly lower than PNRs for stock and combo deals in each period. PNRs for stock deals are 68%, 62%, and 61% across the three periods, respectively, and for combo deals are 64%, 68%, and 60%.
- Premiums paid have declined overall from their high of 35.5% ($1.3B) in the first period to 28.4% ($748M) in the third, especially for stock and combo deals, which declined from their highs of 33.2% and 38.6% in the first period to 22.9% and 29.2% in the third period, respectively. Premiums paid for cash deals have approached their first period level of 35.7% in the third period at 33.3%—along with a higher PNR.
- Positive reaction cash deals were the most persistent (PP/IP of 75%) in the first period in contrast to negative reaction stock deals, which were strongly persistently negative (PN/IN of 74%) in the same period. Stock deals, after an improvement in the second period leading to their best one-year returns of +4.4% with an improved PP/IP (66%) and PN/IN (57%), dropped sharply to a −7.0% return in the third period and were again the most strongly persistently negative (PN/IN of 77%) and the weakest persistently positive (PP/IP of 53%) in the third period.
- The narrowing persistence spread of returns for persistently positive versus persistently negative deals occurred for cash, stock, and combo deals from 81.7%, 64.5%, and 68.5% in the first period to 63.8%, 44.1%, and 54.3% in the third period, respectively—the persistence spreads remain enormous between the “good guys” and “bad guys” across the board.
- TSVA% overall has improved across the three periods to +4.0% overall in the third period, with the largest improvement coming in stock deals, from −1.47% in the first period (thanks largely to the very large loss on the AOL/Time Warner deal) to +6.33% in the third period—supporting the interpretation that mergers continue to create value overall and that has increased over time.
Year-by-Year Results for Selected Data
The results overall and across the three periods are informative but looking at some of the data year-by-year offers a more granular view of the variation over time, and offers some additional perspective. Even with year-by-year variations (as should be expected), our major findings are supported.
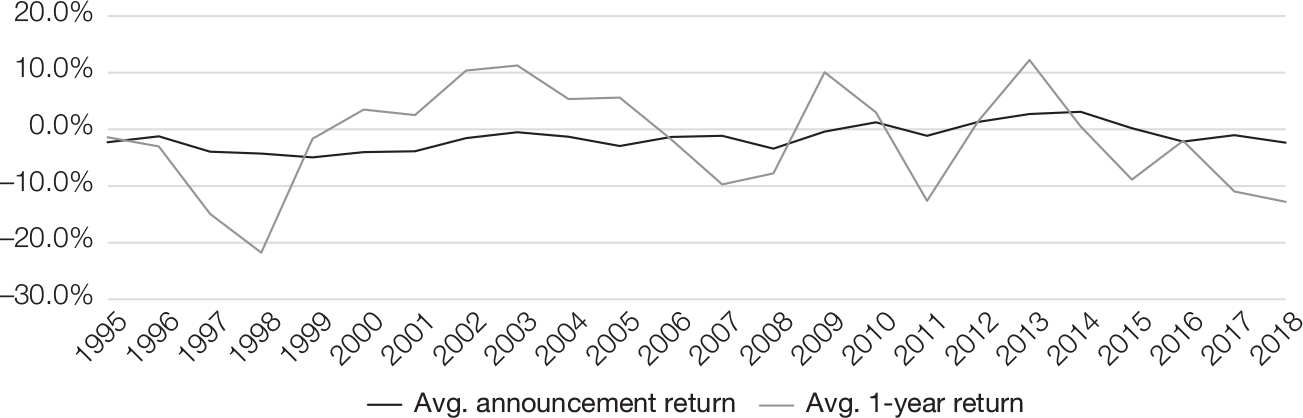
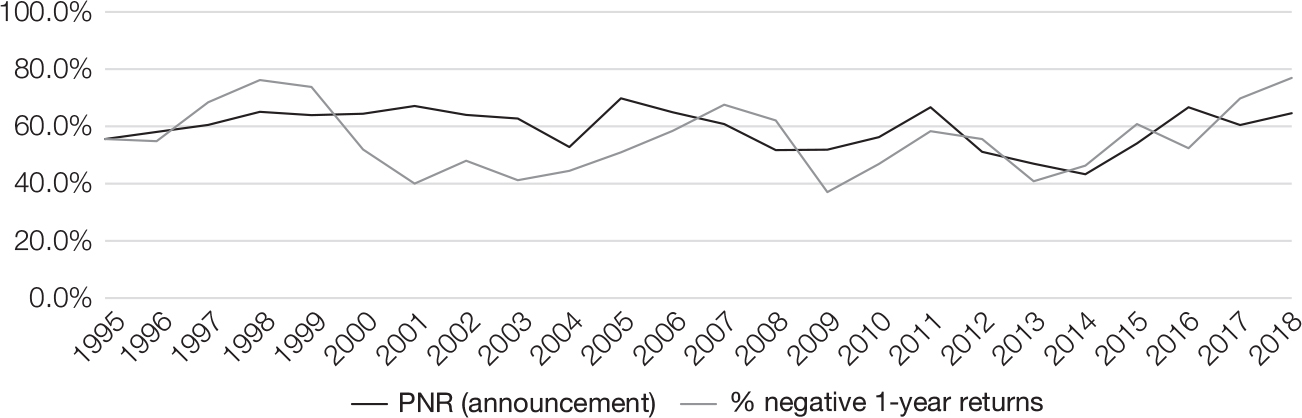
Figure A-1 indicates that announcement and one-year shareholder returns to acquirers, after an improvement, are both trending lower in the last four years of the study period.
Figure A-2 shows that PNRs and percentages of negative one-year shareholder returns to acquirers have increased significantly from 43.3% and 46.3% in 2014 to 64.6% and 76.9% in 2018, respectively—after some improvement following the 2008 downturn—a negative and disappointing trend.
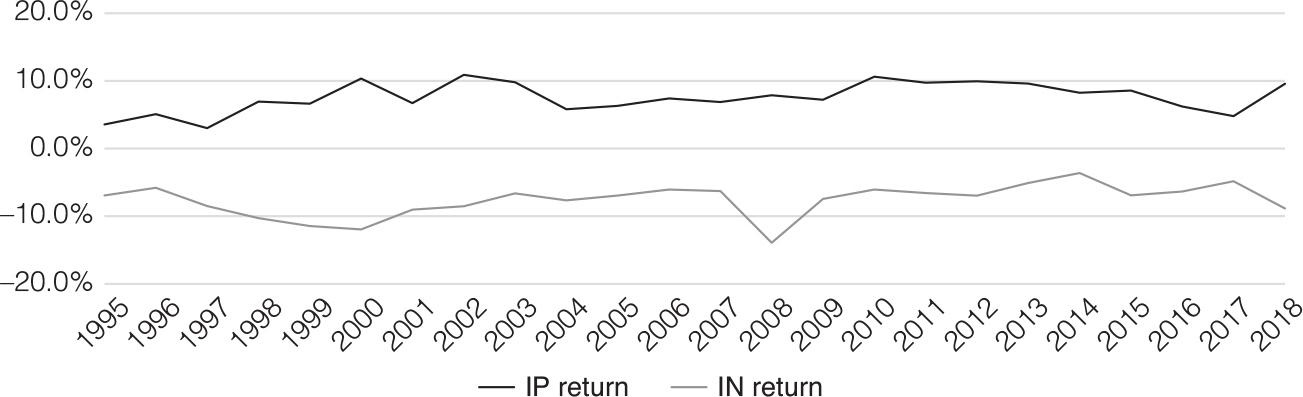
The results in figure A-3 show that the announcement returns to acquirers on the initially positive and initially negative portfolios (the market reactions) have remained not only remarkably different, but also relatively stable and close to their overall means over time, respectively (+7.7% for the initially positive portfolio and −7.8% for the initially negative portfolio).
Announcement and 1-year returns to acquirers

Percentage negative reaction and percentage negative 1-year returns to acquirers

Announcement returns to acquirers on the initially positive and initially negative portfolios

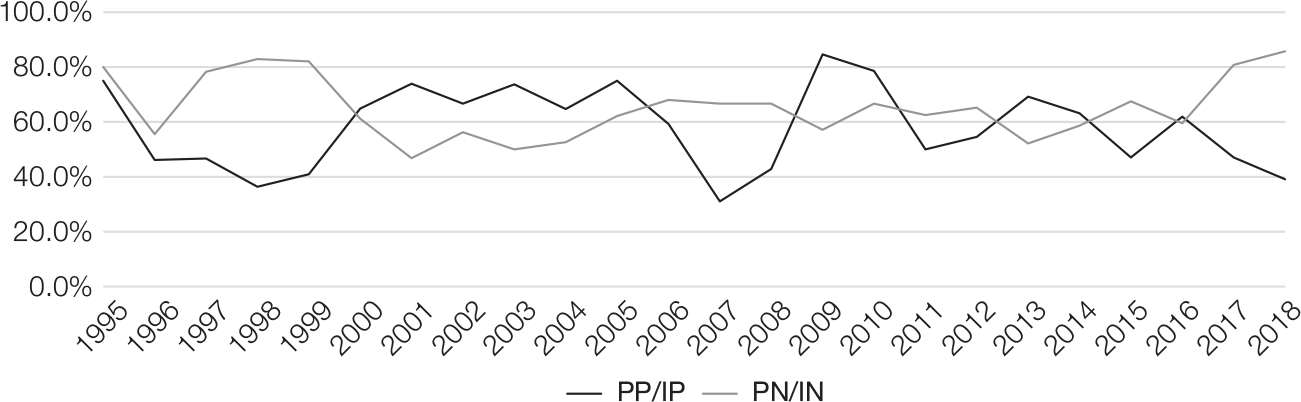
Although a positive investor reaction is no guarantee of subsequent returns, if positive news and results are not forthcoming, a negative reaction is very difficult to reverse. The rising persistence of negative reactions, and declining persistence of positive reactions, in the last two years (2017 and 2018) in figure A-4 is a partial explanation of the corresponding decline in overall one-year returns (shown in figure A-1). Combined with increasing PNRs (shown in figure A-2), the increasing PN/IN creates a sobering picture. It is important to note that even with the variations in persistence levels over time, for the initially positive and initially negative portfolios, that the shareholder returns on the respective market reaction portfolios remain indicative of the returns on those portfolios over the course of one year (largely due to the size of the returns on the persistent portfolios), as we reviewed in the previous sections.
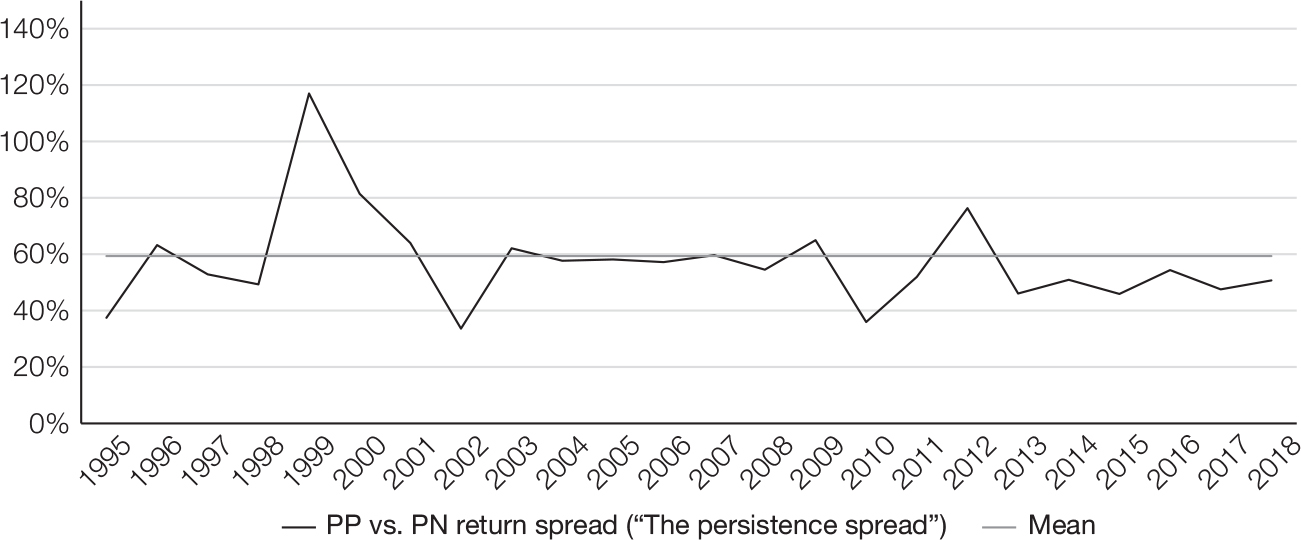
Although the persistence spread—the difference between industry-adjusted one-year shareholder returns to acquirers on the persistently positive and persistently negative deal portfolios—has varied (with 1999 having a handful of very positive persistent deals), it’s clear that enormous benefits accrue to being a persistently positive versus a persistently negative performer. Figure A-5 illustrates the persistence spread over time.
Persistently positive/initially positive and persistently negative/initially negative deals (PP/IP and PN/IN)

The persistence spread

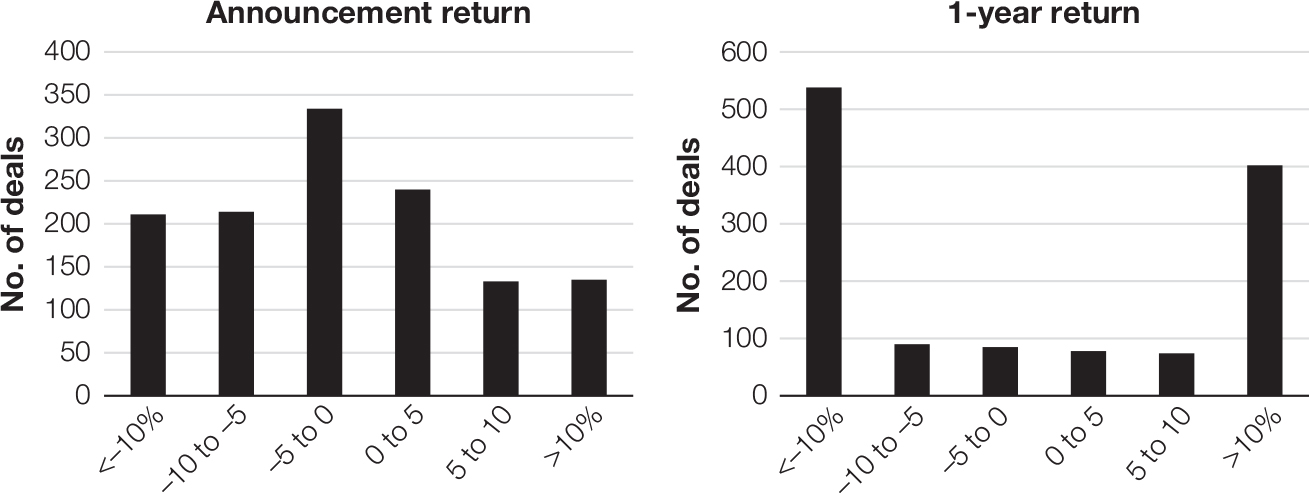
Distribution of returns
The view that initial market reactions are a forecast of the future and the effects of positive and negative persistence, and the persistence spread, are illustrated in figure A-6. These two charts illustrate how the announcement returns—investor reactions—appear to be a forecast of the future and that returns fan out over the course of a year as additional information is released and investors reconsider their initial forecast. Not surprisingly, 71% of the most negative one-year returns (those with returns lower than negative 10% in the one-year return chart, representing 42% of the total sample) were initially negative.
Distribution of announcement and 1-year returns to acquirers

Although there is variation in the year-by-year results, our major findings hold across the study period: Announcement returns have improved but one-year returns remain challenged overall, initial market reactions are meaningful forecasts of the future, negative market reactions are very tough to reverse, and the persistence spread has been enormous over the years.
Total Shareholder Value Added
Often, when mergers are debated, the level of analysis of the discussion gets confused. There is a difference between whether M&A is good for buyers or for sellers and whether M&A creates value overall. In other words, mergers may not benefit buyers, on average, but the question is: Does adding the gains or losses to the buyer and gains to the seller result in a positive number at the aggregate level? The answer appears to be yes.
We calculated the TSVA as the sum of the 11-day peer-adjusted dollar return around deal announcement for all buyers and sellers. In effect, TSVA is the sum of the buyer and seller SVAs (their individual dollar announcement returns). We summarize the average dollar returns for the full sample, and by method of payment and portfolio type (initial reactions and subsequent persistence) for the 24-year period of our study in table A-5.
We then used our TSVA dollar values, for the full sample and by method of payment and portfolio type (which we reported in table A-5), and divided by two different denominators for two perspectives: 1) TSVA divided by combined pre-deal market caps of the buyers and sellers for a percentage change in the total combined market cap, and 2) TSVA divided by pre-announcement seller market cap plus the premium paid (or total price paid) for a return on investment (ROI) measure. That yields a TSVA% based on total market capitalization change and a TSVA% as an ROI based on the total price paid for the target, respectively. The results using both measures are shown in table A-6.
TABLE A-5
TSVA for deals by method of payment and portfolio type ($M)
|
Method of payment |
Acquirer SVA |
Target SVA |
TSVA | |||
|---|---|---|---|---|---|---|
|
All deals |
−285.15 |
468.67 |
183.52 | |||
|
Cash |
−55.03 |
388.14 |
333.11 | |||
|
Stock |
−434.51 |
446.63 |
11.12 | |||
|
Combo |
−270.44 |
524.28 |
253.83 |
|
Portfolio type |
TSVA | |||||||
|---|---|---|---|---|---|---|---|---|
|
All Deals |
Cash |
Stock |
Combo | |||||
|
Persistent positive |
1005.33 |
669.88 |
1082.10 |
1214.44 | ||||
|
Initial positive |
995.49 |
671.06 |
1194.78 |
1072.14 | ||||
|
Full sample |
183.52 |
333.11 |
11.12 |
253.83 | ||||
|
Initial negative |
−359.94 |
−111.40 |
−639.69 |
−209.19 | ||||
|
Persistent negative |
−446.72 |
−35.60 |
−650.96 |
−383.20 | ||||
TABLE A-6
TSVA% for deals from two perspectives by method of payment and portfolio type
|
Portfolio type |
COMBINED PRE-DEAL MARKET CAPS |
PRE-DEAL SELLER MARKET CAP PLUS PREMIUM | ||||||||||||||
|---|---|---|---|---|---|---|---|---|---|---|---|---|---|---|---|---|
|
All deals |
Cash |
Stock |
Combo |
All deals |
Cash |
Stock |
Combo | |||||||||
|
Persistent positive |
9.42% |
8.88% |
8.79% |
10.27% |
26.23% |
38.53% |
20.39% |
28.27% | ||||||||
|
Initial positive |
9.11% |
9.40% |
8.28% |
9.85% |
25.10% |
39.07% |
20.45% |
26.11% | ||||||||
|
Full sample |
1.45% |
3.73% |
0.07% |
2.05% |
4.32% |
14.66% |
0.21% |
5.86% | ||||||||
|
Initial negative |
−2.61% |
−0.98% |
−4.17% |
−1.58% |
−8.13% |
−3.71% |
−12.95% |
−4.69% | ||||||||
|
Persistent negative |
−3.08% |
−0.35% |
−4.29% |
−2.52% |
−9.76% |
−1.34% |
−13.16% |
−7.94% | ||||||||
TABLE A-7
Equally weighted TSVA% for deals from two perspectives by method of payment and portfolio type
|
Portfolio type |
COMBINED PRE-DEAL MARKET CAPS |
PRE-DEAL SELLER MARKET CAP PLUS PREMIUM | ||||||||||||||
|---|---|---|---|---|---|---|---|---|---|---|---|---|---|---|---|---|
|
All deals |
Cash |
Stock |
Combo |
All deals |
Cash |
Stock |
Combo | |||||||||
|
Persistent positive |
11.26% |
11.58% |
9.97% |
12.09% |
38.33% |
44.34% |
32.33% |
38.48% | ||||||||
|
Initial positive |
10.98% |
11.30% |
10.49% |
11.15% |
36.90% |
41.85% |
33.83% |
35.76% | ||||||||
|
Full sample |
3.63% |
6.95% |
1.33% |
3.96% |
10.44% |
23.77% |
3.28% |
10.08% | ||||||||
|
Initial negative |
−1.29% |
1.24% |
−3.71% |
−0.11% |
−7.28% |
−0.02% |
−13.52% |
−4.44% | ||||||||
|
Persistent negative |
−2.21% |
0.87% |
−4.41% |
−1.10% |
−9.53% |
−0.47% |
−15.68% |
−6.56% | ||||||||
We also calculated TSVA% on an equally weighted basis—that is, using the TSVA for each deal (the sum of the SVA of the buyer and the SVA of the seller) and dividing by the two denominators (for our two perspectives) for each deal separately, and then taking an average for the full sample and by method of payment and portfolio type. We find a very similar pattern of results, as shown in table A-7.
The major takeaway from this TSVA section is that M&A overall, based on our announcement-return results, creates value in the aggregate, but the initially negative and persistently negative portfolios of deals do not.