Parametric Analysis of Thermal Comfort and Energy Efficiency in Building in Subtropical Climate
Ashfaque Ahmed Chowdhury, M.G. Rasul and M.M.K. Khan, School of Engineering and Technology, Central Queensland University, Gladstone, Qld, Australia
This chapter presents a comparative analysis of human thermal comfort and energy efficiency achieved using traditional and alternative building envelopes. In this study, an alternative envelope system, which is scientifically and environmentally sustainable, is considered. It primarily consists of outside rendered walls with polystyrene, reinforced concrete and plasterboard inside to measure the thermal comfortability index and energy efficiency within the building environment. The results are then compared with the current brick veneer building thermal comfort index and energy performance. A parametric analysis is presented highlighting the impact of traditional and alternative envelopes on thermal comfortability and energy efficiency of buildings in a subtropical climate in Australia. The results found that the new building envelope reduces the average annual cooling energy consumption by about 11% compared to that of the current building envelope with adequate thermal comfort of the occupant.
Keywords
Thermal comfort; energy efficiency; building envelope; parametric analysis
7.1 Introduction
In tropical climates, buildings consume a large portion of the essential energy supply. A significant quantity of energy savings can be achieved by designing and planning appropriate energy-efficiency measures and optimization of envelope components, heating, ventilation, air-conditioning, and other associated systems. In Australia, building industries consume almost 40% of total energy consumption, contributing significantly to greenhouse gas emissions [1]. According to a study, Australia produced 210.3 bkWh of electricity and consumed 195.6 bkWh in 2002 [2]. Recent studies showed that a significant portion of the total energy consumption is sourced from building construction and dwellings. About 11.2% of Australia’s total energy use is in residential and commercial buildings [3,4]. In 2008, a study by the Australian Federal Government reported that the energy utilization was 402 PJ by the residential housing sector, whereas the energy consumption rate was about 300 PJ in 1990. The article also forecast that energy usage would be about 467 PJ in 2020, which is an increase of 56% over the period of 30 years. The number of residential dwellings will be around 10 million in 2020 compared to 6 million in 1990 [5]. A recent study showed that the buildings sector accounts for 130 Mt of greenhouse gas emissions each year, which is about 23% of Australia’s emissions reported by the Government for 2005. Greenhouse gas emissions in building sectors are anticipated to grow to 280 Mt by 2050. However, 30–35% of buildings sector greenhouse gas emissions could be reduced by adopting demand-side abatement strategies by 2050 [6].
Chan and Chow [7] studied the energy impact of building envelopes in subtropical climates. The authors surveyed a number of existing buildings to get an understanding of envelope heat gain and cooling load demand by applying an overall thermal transfer value. The results indicated that envelope construction systems have a significant effect on the magnitude of heat gain through building envelope and cooling energy consumption. It was reported that an energy-efficient envelope can reduce heat gain through the envelope and the cooling energy consumption by as much as 35% compared to a weak envelope in a building in a tropical climate. Pfafferott et al. evaluated and merged a parametric model with the field data to create a technique for data assessment in office buildings and provided a straightforward method for incorporation in a building performance management system [8].
A parametric analysis of substitute energy preservation actions in an office building has been carried out in Saudi Arabia to investigate the impact of preservation actions on energy requirements. Among other findings, the study reported only 2% energy savings by increasing the current insulation thickness from 50 to 75 mm, about 7% annual energy savings using low-e double-glazed windows, about 3% annual electric energy saving by changing the set point temperature, 17% by adopting a variable air volume air-conditioning system and so on. The combined effect of all energy preservation actions can result in about 36% of annual energy savings [9]. In a study by Ourghi et al. [10], a simplified analysis method was developed combining several parameters to predict the influence of building shape on yearly cooling and total energy use in the office buildings. The study reported that a strong correlation exists between a building and its energy utilization profile. Moreover, the comparative building size, type and glazing size were also found to influence the total energy usage profile of a building [10].
A study was conducted to find the effects of cool coatings on thermal comfort and the energy usage profiles in buildings in various climatic conditions. The authors found that about 18% and more cooling loads and 11–27% peak cooling requirement in air-cooled buildings can be trimmed down by escalating the solar reflectivity of the building rooftop. The study also reported that thermal comfort conditions in the inside of the buildings were improved by reducing the hours of discomfort [11]. A parametric study was performed to evaluate building cooling performance by night ventilation which is a straightforward and energy-effective way to increase thermal comfort. Among all the parameters, climatic states and air flow rate during overnight air circulation were found to have the greatest influence on thermal comfort. Moreover, the thermal mass of the building and the interior warmth gains have a considerable impact on the cooling operation of building systems and thermal comfort [12].
A study conducted by Lam et al. investigated the sensitivity of energy performance of a complete air-cooled building in a subtropical climate through parametric analysis to identify the significance of input design parameters and the corresponding energy preservation actions. The study suggested that a change of indoor air temperature from 22°C to 25.5°C, produced a humble reduction of 2 W m−2 lighting energy and Chiller COP could offer around 14%, 5.2%, and 11% energy savings, respectively, in buildings [13]. A case study on the performance analysis of a building envelope of a university building was performed to assess the actual energy performance of the building envelope. A number of parameters were measured and recorded. The results of the analysis showed that the lightweight and the highly insulated envelope reduce the functional and initial costs of the air-conditioning system. However, lifecycle cost analysis revealed that the studied envelope is the most economical and the investment cost required a discounted payback period of only 3–5 years. Higher savings and more favorable savings can be obtained with the highly energy-efficient envelope [14].
A low-energy envelope was designed to analyze the energy efficiency of an air conditioner by Yu et al [15]. The envelope was also tested to find the influences of energy-saving schemes on the electricity utilization of an air-conditioning system in rooms with distinctive orientation in the summer and winter periods in China. The outcomes showed that the envelope shading and the exterior wall thermal insulation are the top strategies to reduce the air-conditioning energy consumption. The optimization of dissimilar strategies decreased the air-conditioning yearly energy consumption by 2%, and the cooling and heating energy utilization is decreased by about 21% and 35%, respectively [15]. AlAnzi et al. investigated the influence of building shapes on energy efficacy of an office building in Kuwait. The outcomes of the comprehensive parametric study showed that the influence of building shape on the whole building energy consumption depends on the comparative compactness, the window-to-wall ratio, and glazing type [16].
Thermal inertia is a key criterion for enhancing thermal comfort conditions of building occupants and reducing heating and cooling energy demand in buildings [17,18]. A number of literatures reported a wide range of energy-saving potential associated with adequate inertia from a few percentages to about 80%. In a study, several external wall systems with the same U-value and dissimilar dynamic properties were explored to measure energy savings. It was found that the wall system with peak energy performance results from a combination of dynamic thermal transmittance and thermal admittance values [19]. In another study, Hwang and Shu investigated the effect of building envelopes on thermal comfort in a glass facade building and potential of energy savings for the control of comfort based on predictive mean vote (PMV). The result indicated that the building envelope regulation index has a significant effect on thermal comfort. Also, the energy saving potential in a PMV index-based controlled area increases with low building envelope regulation index [20]. A parametric investigation of the energy utilization of a double-skin facade building in hot environmental conditions was carried out considering the ventilation rate, shading requirements, and cavity dimensions as the parameters of interest. It was reported that the ventilation rate in the double-skin facade design is important during the cooling season. Also, it was found that the lack of suitable aeration raises the cooling loads and weakens the efficacy of double-skin facades [21].
The influences of thermal atmosphere on dwellers’ comfort in several climates were reviewed in several ASHRAE projects where thermal displeasure was related to greater air changes established on ASHRAE standard [22,23]. A few investigations were undertaken by several researchers on thermal comfort where the seasonal differences of heat balances among humans, environment, as well as thermal sensation were analyzed using measured metabolic rate and set-point temperatures in different seasons [24–29]. Clarke et al. performed a study through simulation to investigate the thermal comfort and dwellers’ actions to preserve a comfortable status. The authors suggested an approach to incorporate the effects of thermal comfort and dwellers’ behavior in an existing simulation program [30]. Another study by Chowdhury et al. suggested that the indoor environmental condition, the comfort and discomfort condition of occupants in a building can be predicted through mathematical modeling [31].
In the current study, a new building envelope system with better energy efficiency is adopted to reduce peak energy demand, reduce the dependence on fossil fuel, and improve thermal comfortability of the occupants in a hot and humid area of Australia. By using smart materials, an unique building wall construction system is employed which is distinct from the current brick building walls for a mainstream building.
7.2 Climate Condition
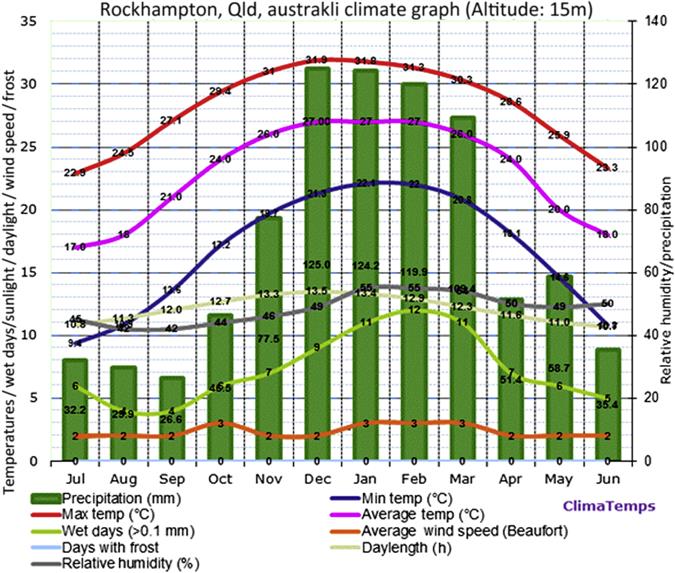
The climate of Rockhampton in Central Queensland, Australia, is considered as subtropical. This study analyzed the thermal comfort and energy effectiveness of a building located in Rockhampton. In summer and winter, the typical daytime temperature varies between 22–32°C and 2–23°C, respectively (Figure 7.1). As per the Bureau of Meteorology, maximum temperatures of 40°C and minimum temperatures of 0°C have been recorded in October to March and in April to September, respectively. Winter and early spring fogs are quite common in Rockhampton. The average rainfall is just over 800 mm annually. The rainfall pattern suggests that December to March is generally the wet season and June to September is the dry season.
7.3 Envelope Construction
7.3.1 Conventional Construction Systems
Currently, a conventional building is made of concrete slab, external walls, internal walls, timber roof structure with tiles or steel roofing such as color bond in Australia. Depending on the climatic conditions, external walls are generally made of external brick veneer, air cavity, thin foil, a timber structure filled with insulation batts and plasterboard. Internal walls are generally made with timber structure and plasterboard on both sides. A cross-sectional view of a traditional building envelope construction is shown in Figure 7.2. This traditional building envelope is still a leading construction method in many parts of Australia. The method turn out to be less energy-effective over time compared to new construction methods. Literature suggest that the material procurement, construction and dwelling phases of this traditional system are not very environmentally friendly as they contribute to greenhouse gas emissions.

7.3.2 Novel Construction Systems
In this study, an alternative building envelope construction method, which is distinctive from a conventional method, is evaluated. The new envelope is more energy-efficient, decomposable, ecofriendly, and cost-effective compared to conventional building envelopes. It primarily consists of concrete foundations, walls with rendered outside, polystyrene, reinforced concrete, and plasterboard from inside (Figure 7.3). Indoor walls are composed of compressed rice/wheat straws. Table 7.1 represents the construction phases of the conventional and new building envelope systems and the potential diminution of environmental impact.
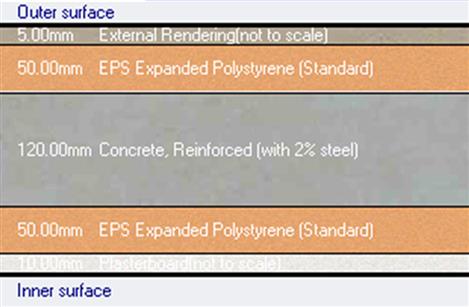
Table 7.1
Comparison of conventional and new building external and internal envelopes [3]
| Conventional | New |
| Exterior wall | Exterior wall |
| Brick+foil+timber frame+insulation batts+plasterboard | Cladding+polystyrene foam+reinforced |
| Concrete+polystyrene foam+plasterboard | |
| Environmental impact | Environmental impact |
| Greater greenhouse gas emissions and carbon footprint | Ecofriendly and high energy efficiency, reduced greenhouse gas release and carbon footprint, better durability, less waste |
| Interior wall | Interior wall |
| Plasterboard+timber frame | Flattened wheat and rice straws without any chemical mixtures |
| Environmental impact | Environmental impact |
| Greater greenhouse gas emissions and carbon footprint | Ecofriendly, little to no greenhouse gas emissions, carbon footprint, nontoxic |
| Roof | Roof |
| Concrete/tiles/color bond+truss made of timber/steel+insulation batts+plasterboard | Concrete/tiles/color bond+polystyrene foam+plasterboard |
| Environmental impact | Environmental impact |
| Greater greenhouse gas emissions and carbon footprint | Ecofriendly and high energy efficiency, reduced greenhouse gas release and carbon footprint, better durability, less waste |
7.4 Simulation Principles
In this study, simulation software DesignBuilder, based on EnergyPlus simulation algorithm for evaluating building conditions and operational scenario, is adopted to assess thermal comfortability and energy efficiency of a conventional and a new building envelope system in a building situated in Rockhampton, Australia. DesignBuilder software allows EnergyPlus to act as the computational technique to assess the energy performance of a building. The software offers a virtual environment where building systems are defined, monitored, and evaluated. Whole building energy and climate analyses have been completed to estimate the potential of new building envelope systems.
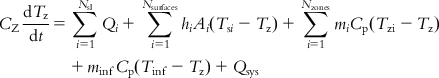
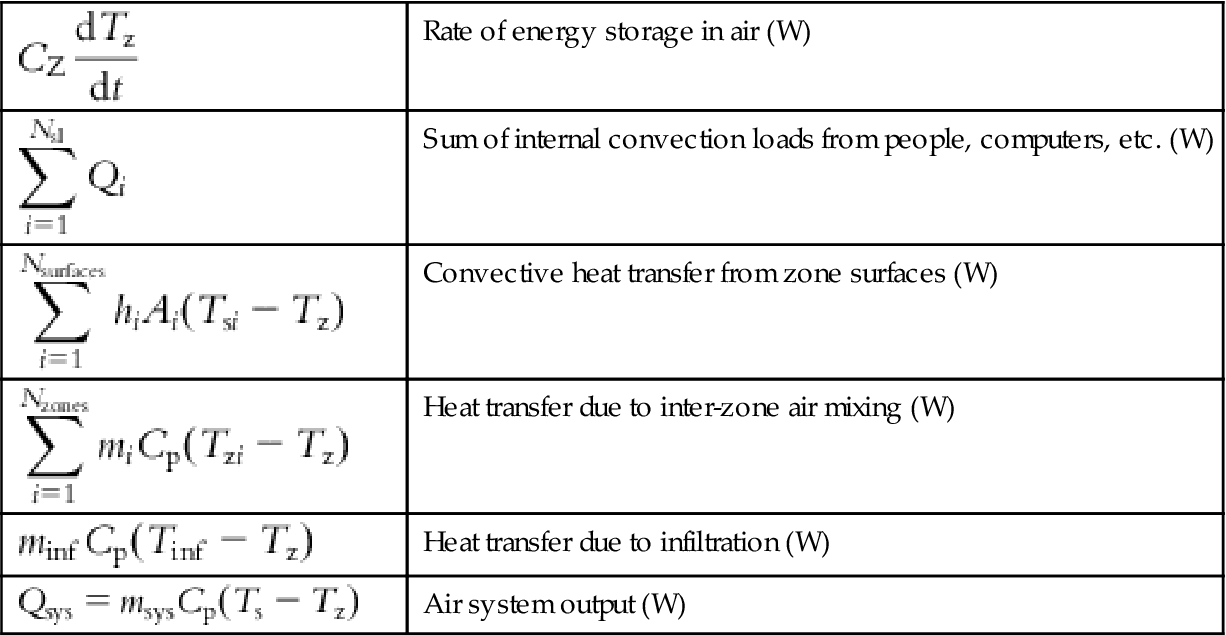
EnergyPlus simulates the energy and environmental performance of a building by considering the interaction of all the building components and systems, for instance, building envelope, windows, structure, heating, ventilation, air-conditioning system, lighting, plug loads, internal heat gain from different systems, etc. The software adopts a predictor–corrector technique to communicate with building systems and different zones within the building and predicts the system load to maintain air temperature within the zone. After that, the software simulates the building system to determine the equipment size and rework the zone air heat balance and actual zone air temperature. According to EnergyPlus Engineering Reference [33], the air heat balance is given by,
Where,
| Rate of energy storage in air (W) | |
| Sum of internal convection loads from people, computers, etc. (W) | |
| Convective heat transfer from zone surfaces (W) | |
| Heat transfer due to inter-zone air mixing (W) | |
| Heat transfer due to infiltration (W) | |
| Air system output (W) |
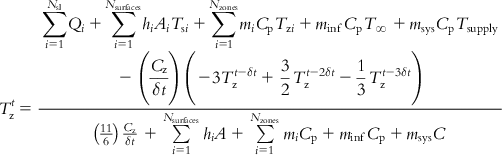
The equation to determine the steady-state system output is as follows:

The zone temperature can be calculated using the following equation.
Researchers worked for many years to identify the factors that influence people’s comfort in built environments. A number of mathematical models were developed combining the thermal influence of environmental, personal and physiological variables which play a major role in stating the condition of thermal comfort [31]. Integration of the whole building performance simulation tools with thermal comfort models assists in identifying the comfort level of the occupants. Generally a thermal comfort model adopts a seven- or nine-point thermal sensation scale to represent the comfort level as shown in Table 7.2. Some of the notable thermal comfort models are Fanger Comfort Model, Pierce Two-Node Model, and KSU Two-Node Model [34]. It can be noted that ASHRAE’s model and Fanger’s model forecast thermal comfort at the steady-state condition. Fanger established a heat balance equation and PMV index based on human thermal balance, the average temperature comfortable for human skin and optimal sweat exhausting rate which shows the thermal sensational index developed by a combination of environmental parameters [30]. According to EnergyPlus Engineering Reference [33], Fanger’s PMV can be calculated as

Table 7.2
Thermal sensation scale [33]
| Sensation value | |||||||||
| 4 | 3 | 2 | 1 | 0 | −1 | −2 | −3 | −4 | |
| Seven-point scale | Hot | Warm | Slightly warm | Neutral | Slightly cool | Cool | Cold | ||
| Nine-point scale | Very cold | Hot | Warm | Slightly warm | Neutral | Slightly cool | Cool | Cold | Very cold |

The new version of Pierce Two Node Model converts the actual environment into a Standard Environment at a Standard Effective Temperature and Effective Temperature. According to EnergyPlus Engineering Reference [33], PMV index using Pierce model can be calculated as


The Kansas State University’s KSU Two Node Model is analogous to Pierce Two Node Model. One major difference is that the KSU Two Node model forecasts Thermal Sensation Vote (TSV) differently for warm and cold environments. According to EnergyPlus Engineering Reference [33] TSV can be calculated as

7.4.1 Model Development
The building has only one level and the entire area is fully air-conditioned. A model case with the conventional and new building envelopes has been developed in the DesignBuilder platform and shown in Figures 7.4 and 7.5. Some of the input data are local climate data, building occupancy, building constructional records, internal component load, air-conditioning, ventilation and lighting data, equipment data, etc., as needed to define the building in virtual space. Some of the input data have been considered following the Building Code of Australia.


As per the simulation documentation, the thermal performance in a closed environment is generally affected by a number of elements, for instance, outside weather, heat gain and losses through the envelope, ventilation, internal loads, thermal mass, dwellers’ activity, equipment, etc. A whole building simulation program, for instance, DesignBuilder, is a powerful tool to evaluate the performance of building systems because the software takes into account building structure, interior atmosphere, local climate, mechanical and electrical systems and the energy supply system to analyze the cooling requirements of the building to achieve a better interior environment for the occupants. Some of the building’s operational and constructional settings that are used for the simulation are listed below:
7.5 Results and Analysis
Cooling and heating design analyses were performed by considering worst-case summer and winter season weather data, respectively. The analyses were performed to define the heating and cooling equipment size and also to sustain the cooling/heating requirement in the hottest and coldest winter and summer in Rockhampton. Minimum outside dry bulb temperature, speed and direction of wind were considered in the winter design calculation. On the other hand, the maximum and minimum outside dry bulb temperature and wet bulb temperature were considered in the summer design calculation. In the cooling design calculations, the daily temperature profile was calculated based on the maximum and minimum temperature values. It is anticipated that the maximum temperature trails the maximum solar elevation by 3 hours. In the simulation, the software considers that indoor air temperature in a single building zone is uniform and copiously mixed. Heating design calculation is carried out by predicting the heat loss in each building zone at the steady-state condition with zero solar gain. This is based on the worst-case winter weather information for the building site.
The internal heat gains within the building are due to computers, office equipment, lighting, building occupants, etc. In the simulation, geometric information, infiltration method and day lighting were detailed when defining the internal loads. The simulation software then calculates the heating and cooling capability in the building zone based on the output from the heating and cooling design analyses. The operational timetable is described in the building to control internal gains for the duration of the building operation. The heat gain through the conventional and new building envelope systems has been compared in Figure 7.6 and found that the heat gain through the new building envelope is up to 1.8 kW m−2 less in summer months compared to the conventional building envelope.

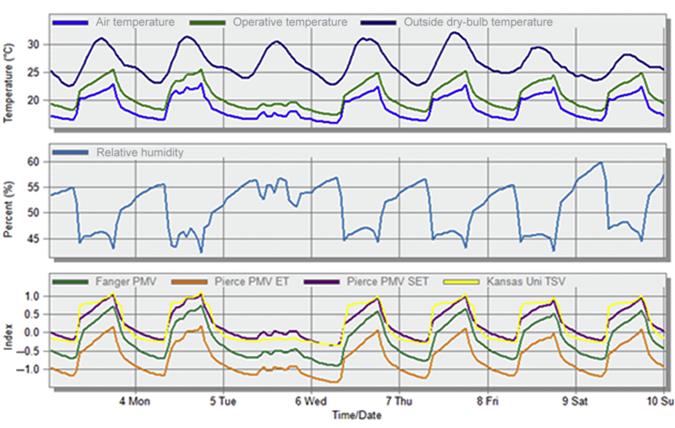
Using the software, building thermal comfort is analyzed to understand the environmental control strategies for the occupants in the building to be thermally comfortable. The results of the thermal comfort models are plotted in Figures 7.7 and 7.8 for the new building envelope in typical summer and winter days (hourly data). In the simulation, it is found that the average air temperature of the building with the new envelope is within the range of the 20s that also meets the comfort temperature range during the operational hours of the building. The exceptions were observed on holidays and nonoperational hours of the building. The comfort index is within the prescribed limits as per ISO 7730-1994 during the building operational hours in summer and winter. There is a slight cool and warm index provided during the nonoperating hours of the building. The air temperature is also maintained close to the set point during the operating hours except the nonoccupancy hours of the building.

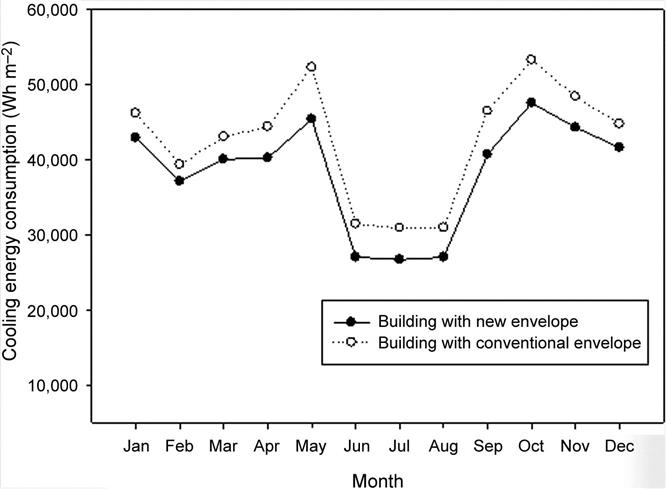
The energy simulation of the whole building has been performed for both the base case scenario with the conventional envelope and the novel building envelope based on hourly weather data available from the Rockhampton AERO station. Figures 7.9 and 7.10 show the total cooling energy consumption and total electricity consumption (monthly) by the building. It can be noted from Figure 7.9 that the cooling energy requirement rises in the summer months when the outside air temperatures are quite high. The energy consumption is relatively less during the winter season. It is evident from Figure 7.9 that, on average, about 14 kWh m−2 per month cooling energy consumption can be saved by employing the new envelope pattern compared to the conventional envelope pattern. This contributes to about 11% of cooling energy consumption savings per year that can be achieved using the new building envelope. The difference in the electrical energy consumption is consistent and can be due to heat gain by the external walls, cooling load, and room electricity. The new building envelope reduces the average total electricity consumption by the building of about 8% or 169 kWh m−2 per year compared to conventional building envelopes.

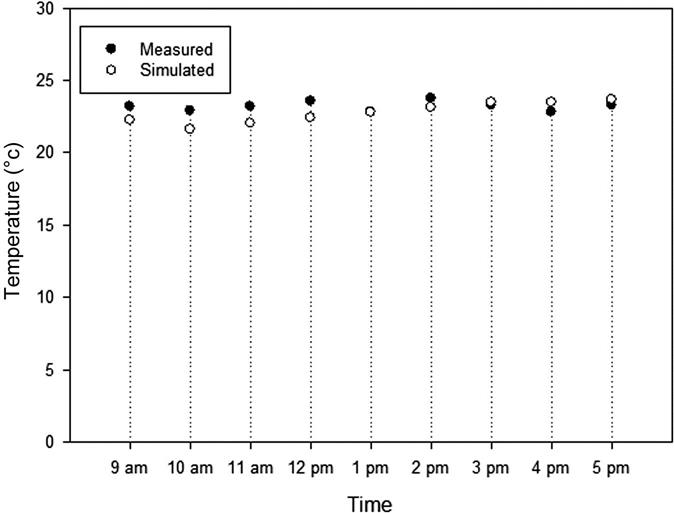
The validity of the modeling results depends on the eminence of the code adopted, the basis of the assumptions made and as also the parameters and boundary conditions considered in the simulation. The basic modeling algorithm of EnergyPlus was confirmed through formal independent analytical, comparative and empirical testings. As reported in the software website, comparative testing of the algorithms was completed for the low mass and high mass construction by adopting the ASHRAE Standard 140P series of tests. It is reported that EP results were in acceptable agreement with other popular modeling tools such as DOE-2, BLAST, TRNSYS, and ESP for simple cases [35]. The recent version of EP results was also compared with a variety of HVAC apparatus specification, HVAC BESTEST E100-E200 series. The capacity of EnergyPlus to predict the loads in each zone, cooling coil loads, energy consumption by cooling equipment and resulting zone environment were found to be within 1% of the analytical results except for mean zone humidity ratio. The ratio was found to be within 2.7% for high sensible heat ratio cases and within 0.65% for low sensible heat ratio cases [36]. In this study, an initial validation of the base model is performed by recording temperature data using HOBO data loggers. Data from a single representative day temperature were extracted from the measured data to be compared to the 24-h day prediction provided by the simulation tool. In Figure 7.11, the average hourly temperature values through simulation (base case) and measurement are shown for representative data. The comparison shows that about 23°C temperature is maintained on average during the operational hour of the day.
7.6 Conclusions
In this parametric study, the impact of novel building envelopes on the indoor thermal comfort of the dwellers and energy consumption is studied. The new building envelope has the higher potential for energy savings in subtropical climate regions like Rockhampton, therefore, the novel building envelope is recommended. The use of new building envelope could have a significant role in reducing dependency on air-conditioning systems in buildings located in subtropical climates with satisfactory thermal comfort for occupants. Moreover, the study revealed that the new building envelope can be applied to buildings located in the subtropical climate where high energy use of an air-conditioning system is required. This novel wall construction system is possibly adaptive for different climate zones and will allow the building to be constructed quicker and will provide a badly needed technological edge in taking housing industries to a new level with further investigations and trials. It is also considered to investigate the proposed envelope more comprehensively with some field trials in future research. Moreover, this promising technology can be considered as one of the sustainable strategies on recent climate change concern for the sustainable urban development. This construction method with a new building envelope has enormous prospect to match higher building energy ratings compared to the conventional construction method.