
Performance Evaluation of Hybrid Earth Pipe Cooling with Horizontal Piping System
S.F. Ahmed, M.M.K. Khan, M.T.O. Amanullah, M.G. Rasul and N.M.S. Hassan, School of Engineering and Technology, Higher Education Division, Central Queensland University, Rockhampton, QLD, Australia
Earth pipe cooling technology is a building design approach for cooling a room in a passive process without using any customary units. It can reduce energy consumption of the buildings for hot and humid subtropical zones. This chapter investigates the performance of horizontal earth pipe cooling (HEPC) in combination with a green roof system. To measure the performance, a thermal model was developed using Fluent in ANSYS 15.0. Data were collected from three air-conditioning modeled rooms installed at Central Queensland University, Rockhampton, Australia. One of the rooms was connected to a HEPC system, the second to a green roof system, and the third standard room had no cooling system. The effect of air temperature, air velocity, and relative humidity of the hybrid earth pipe cooling performance were assessed. A temperature reduction of 4.26°C is predicted for a combined HEPC and green roof system compared to the standard room, which will assist the inhabitants to achieve thermal comfort and save energy in the buildings.
Keywords
Passive air cooling; earth pipe cooling; horizontal piping system; green roof; air temperature; air velocity
1.1 Introduction
A significant amount of energy is consumed by buildings today and buildings are accountable for about 40% of world annual energy consumption [1]. There has been an enormous increase in energy demand worldwide in recent years due to industrial development and population growth. World energy use is projected to rise from 524 quadrillion Btu in 2010 to 630 quadrillion Btu in 2020 and 820 quadrillion Btu in 2040 as shown in Figure 1.1 [2]. This represents an energy consumption increase of 56% during this period. More than 85% of this growth in global energy demand is predicted to occur among the developing nations outside the Organization for Economic Cooperation and Development (OECD) nations, where demand is driven by strong long-term economic growth and expanding populations. In contrast, the greater part of OECD member countries are now more established energy consumers with slower expected economic growth and particularly no foreseen population growth [3].
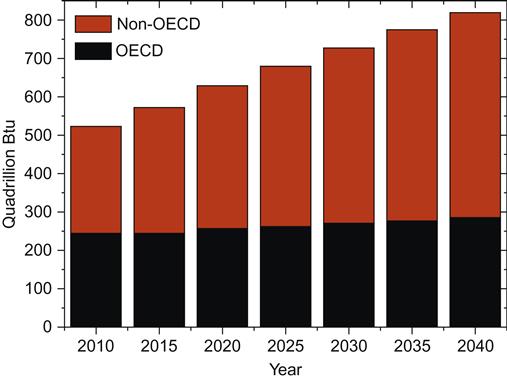
Energy use in non-OECD nations will increase by 85% compared to an increase of 18% for the OECD economies. Country-wise world energy consumption over this period of 2010–2040 is summarized in Table 1.1.
Table 1.1
World energy consumption by country grouping (quadrillion Btu) [2]
| Region | 2010 | 2015 | 2020 | 2025 | 2030 | 2035 | 2040 | Average annual change, 2010–2040 (%) |
| OECD | 242 | 244 | 255 | 263 | 269 | 276 | 285 | 0.5 |
| Americas | 120 | 121 | 126 | 130 | 133 | 137 | 144 | 0.6 |
| Europe | 82 | 82 | 85 | 89 | 91 | 93 | 95 | 0.6 |
| Asia | 40 | 41 | 43 | 44 | 45 | 46 | 46 | 0.5 |
| Non-OECD | 282 | 328 | 375 | 418 | 460 | 501 | 535 | 2.2 |
| Europe and Eurasia | 47 | 50 | 53 | 57 | 61 | 65 | 67 | 1.2 |
| Asia | 159 | 194 | 230 | 262 | 290 | 317 | 337 | 2.5 |
| Middle East | 28 | 33 | 37 | 39 | 43 | 46 | 49 | 1.9 |
| Africa | 19 | 20 | 22 | 24 | 27 | 31 | 35 | 2.1 |
| Central and South America | 29 | 31 | 33 | 35 | 39 | 42 | 47 | 1.6 |
| World | 524 | 572 | 630 | 680 | 729 | 777 | 820 | 1.5 |

Almost all of the world population uses energy at some point for their own needs and the greater amount of this energy is used in buildings for cooling, heating, and lighting. The building sector consumes a lot of energy which is responsible for more than 40% of global energy use [4] and 40–50% of the total delivered energy in the United Kingdom and the United States [5,6]. In 2010, the sector accounted for more than one-fifth of global energy consumption [2]. Ventilation, cooling, and heating in buildings can be responsible for as much as 70% of the total energy use in buildings [7]. This growth, along with unprecedented changes in the underlying living standards and economic conditions, will make developments within the building sector. Total world delivered energy demand for buildings shown in Figure 1.2 increases from 81 quadrillion Btu in 2010 to nearly 131 quadrillion Btu in 2040 at an average annual growth rate of 1.6%.

Energy consumption in Australia has also been increasing rapidly with the rest of the world. This energy is used for residential, commercial, agricultural, and industrial purposes. The energy consumption for the Australian residential sector in 1990 was about 299 petajoules (PJ) and that by 2008 had grown to about 402 PJ and is projected to increase to 467 PJ by 2020 under the current trends [8]. This represents a 56% increase in residential sector energy consumption over the period 1990–2020. The contribution of electricity to this residential energy consumption is predicted to increase from 46% of total energy consumption in 1990 to 53% in 2020 as shown in Figure 1.3. Gas consumption is also expected to increase from 30% in 1990 to 37% in 2020, while wood is predicted to decrease from 21% to 8% over the same period [8]. Liquefied petroleum gas use in the residential sector remains unchanged and is expected to contribute to 2% in 2020.

Residential electricity consumption grew 1.5% per annum at a compound rate between 2008 and 2011 [9]. Energy consumption in this sector has been less responsive to electricity price increase since 2008 than before 2008. Per capita residential energy consumption was nearly static between 2003 and 2012, suggesting higher consumption due to population growth rather than higher spending per capita. In Australia, this residential energy consumption varies state to state as shown in Figure 1.4.

Victoria, NSW, and Queensland show steady growth of residential energy consumption over the period of 1990–2020 as shown in Figure 1.4. This energy consumption is primarily due to extensive use of gas for space heating and cooling. Australian homes use 38% of their total energy consumption on heating and cooling [10]. Moreover, the average annual temperature in Australia has increased by 0.9°C since 1950 [11]. Projections from Commonwealth Scientific and Industrial Research Organization (CSIRO) indicate an increase of average annual temperature by a further 0.6–1.5°C by 2030 and 1–5.0°C by 2070, depending upon the levels of global emissions [12]. According to this projection, more energy will be needed to achieve the same level of thermal comfort. It is essential to save energy today in the Australian residential sector, as well as globally, for the betterment of the world economy and environment. This residential energy consumption can be reduced significantly by employing energy-efficient technologies.
There has been renewed interest toward building energy efficiency because of environmental concerns and the high cost of energy in recent years. Energy efficiency in building might be enhanced by adopting either active or passive energy-efficient methods. Upgrades to heating, ventilation, and air conditioning frameworks, lighting, and so on might be dealt with as active strategies, while the changes to building envelope components could be classified under passive strategies [13]. Among these passive strategies, passive air cooling of the earth pipe cooling strategy is an appealing choice to reduce the energy consumption in buildings for all subtropical climates. Earth pipe cooling technology offers a great potential for energy saving in buildings located in hot and humid climates like Australia. It can increase cooling capacity and hence improve the coefficient of performance.
To assess the cooling capacity of earth pipe cooling technology, an estimation of its thermal performance is important. To measure the thermal performance, two thermal models were developed using two different piping systems for a subtropical climate in Queensland, Australia [14–16]. In some cases, the earth pipe cooling system is assisted with a heat pump as a heat exchanger located within the buried pipe. As a space cooling innovation using natural energy, earth–air–pipe frameworks have attracted increasing interest for energy conservation [17–20]. To predict the cooling capacity and thermal performance of earth pipe cooling technology, a transient and implicit model was developed based on numerical heat transfer and computational fluid dynamics (CFD) [21]. The result demonstrated that a daily cooling capacity of up to 74.6 kW h can be obtained from an earth–air–pipe system. Al-Ajmi et al. [22] calculated the cooling capacity of earth–air heat exchangers for domestic buildings in a desert climate. It was reported that the earth–air heat exchanger has the potential to reduce by 30% cooling energy demand in a typical house in summer. Thermal performance of the earth-pipe-air heat exchanger was analyzed for cooling in summer [23]. A 23.42 m long pipe was used in this study that produced cooling in the range of 8.0–12.7°C for the air velocities of 2–5 m s−1. The earth–air heat exchangers were also used in cooling agricultural greenhouses [24–27].
Many researchers found that the resulting temperature at the buried pipe outlet decreases with increasing pipe length, decreasing pipe diameter, decreasing mass flow rate of flowing air in the pipe and increasing depths up to 4 m [25,28]. A parametric study was carried out into earth pipe cooling systems to evaluate the influence of pipe length, pipe radius, pipe depth, and air flow rate on the general performance of the earth tube under different conditions during the cooling season [29]. The pipe depth and pipe length turned out to influence the earth tube cooling rate, while air flow rate and pipe radius primarily influenced the inlet temperature of the earth tube.
A low-energy cooling technique using earth became increasingly popular in Europe and America after the oil crisis in 1973. There is a great deal of on-going research into the earth pipe cooling technique using both simulation and experimental analysis. However, no credible research is seen on the earth pipe cooling technique in combination with any other active or passive strategy (hybrid earth pipe cooling system). Consequently, this chapter explores the performance of the hybrid earth pipe cooling system utilizing another passive cooling strategy, that of the green roof system.
1.2 Earth Pipe Cooling Technology
Earth pipe cooling technology utilizes the earth’s near-constant underground temperature to cool air for residential, agricultural, or industrial uses. It is often a viable and economical alternative to conventional cooling since there are no compressors, chemicals or burners, or regular mechanical units. The technology works with a long buried pipe with one end for the ambient air intake and the other end for providing air cooled by the soil to the house [30] as shown in Figure 1.5. The pipe is buried underground at an optimum depth that will give the most effective results. It uses the ground as a heat sink for cooling purposes in warm countries where the channeled ambient air, through the buried pipe, transfers excess heat to the ground by convection. There should be adequate air flow into the buried pipe intake to produce cool air at the other pipe end for achieving thermal comfort. A blower is needed to set into the pipe above the ground and near to the room to achieve adequate air flow.

The infinite thermal capacity of has makes it a very useful heat sink for building cooling or even heating purposes. This fact has been studied and proven by several researchers [24]. The rationale behind this is due to the daily and seasonal temperature variation, which is greatly reduced in the ground with increasing depths up to a depth where the soil temperature remains constant throughout the year [32]. The constant soil temperature is usually approximately equal to the mean annual air temperature. In winter, the soil temperature increases with increasing depth up to a certain depth and hence the use of earth as a heat source. Meanwhile, the soil temperature decreases in summer with increasing depth, which provides the use of earth as a heat sink. Different soil temperature characteristics were investigated in Athens, Greece, through Fourier analysis [26]. The soil temperatures at depths of 1–5 m and at the surface for both bare and short-grass-covered areas were taken into consideration for this study. It was found that the first three harmonics can reproduce the majority of the observed patterns in soil temperatures at different depths and the surface.
There are two main strategies for the earth pipe cooling system: direct earth contact and indirect earth contact. Direct earth contact involves a total or partial building envelope being placed in contact with the ground surface directly, and the indirect earth contact involves an earth-to-air heat exchanger system through which air is circulated between the interior and exterior of the building and is subsequently brought into the building [33]. The direct earth-to-building contact ground cooling has many advantages in its performance. It is a low-maintenance passive cooling strategy with minimal heat gains and solar exposure. Despite the advantages of the direct-to-building contact ground cooling, it also creates environmental problems such as indoor condensation and poor indoor air quality [26].
The northern part of Australia, including Queensland, has very high humidity and temperature with only wet and dry seasons [34]. Low humidity and cooler temperatures occur during the dry season, whereas extreme rainfalls with thunderstorms and monsoon periods occur during the wet season. Furthermore, Australia has a low average air velocity throughout the year and having a direct earth contact to the building method would minimize the number of openings, which result in a reduction in natural ventilation into the building and hence an even lower air velocity. Therefore, considering the potential consequences of direct earth contact ground cooling and the benefits of indirect earth contact ground cooling, this chapter investigates the latter ground cooling strategy.
Earth pipe cooling systems can be organized in two ways: open loop and closed loop, as shown in Figure 1.6. In an open loop system the air comes through the buried pipes into the room and then is vented to the outside, which was investigated by Goswami and Biseli [35].

In a closed-loop system the air is constantly re-circulated from the buried pipes underground to the room. The system is more effective than the open-loop system. This system does not exchange air with the outside of the house. The latter pipe arrangement can also reduce the tunnel length since the conditioned air is re-circulated within the buried pipe [35]. In a closed-loop system, the buried pipes may be fitted in horizontal trenches or borings, vertical borings, slinky coil, or even in a water body as shown in Figure 1.7.

1.3 Green Roof System
A green roof is a rooftop garden, which is completely or partially covered with vegetation and a growing medium, positioned over a waterproof membrane. It may incorporate extra layers such as a protection board, insulation, irrigation system, drainage, and filter fabric. It absorbs heat and acts as an insulator for buildings, reducing the amount of energy required to provide cooling [37]. A waterproofing membrane is used to prevent moisture entering into the building. It is normally applied on the top of roof deck structure as shown in Figure 1.8. Therefore, the green roof replaces traditional roofing materials with a lightweight, living arrangement of soil, compost, and plants. By utilizing soil and plants on rooftops in place of hard roofing materials, the homeowners can extend the life of the roof two and three times more.

Planted roofs reduce the thermal load applied to the buildings. The plants can absorb significant amounts of solar energy through their biological functions. Of this solar radiation, 27% is reflected into the atmosphere, 60% is absorbed by the soils and plants, and 13% is transmitted into soil [38].
Green roofs meet one of the key conditions of sustainable development, the reconciliation between economy and ecology. The benefits of this technology are absolute from the thermal point of view. It can make a unique contribution to the quality of our urban environment. It generates a wide range of social, economic, and ecosystem benefits, for both public and private use, as listed below [40]:

Green roofs have a long history over several centuries. However, modern green roof technology contrasts with the aged framework, despite the fact that the concepts and benefits are indistinguishable. Germany is the pioneer in current green roofs and has actively used this technology since the 1960s. There are several on-going researches on green roof technology to improve the efficiency of the system. To evaluate the performance of the technology, fluxes for dry and wet green roofs were calculated and compared with a similarly insulated roof without greening [41]. The result demonstrated that the heat lost through evapotranspiration for the wet green roof is more than double that of the dry green roof. The extra evapotranspiration of the wet roof indicates that it not only prevents the heat flux into the building but provides passive cooling, actually removing heat from the building. The dry green roof diminished the approaching heat flux by 60% contrasted with a traditional roof. The thermal performance of rooftop gardens was also investigated in Singapore through a field measurement [42]. The room temperature reduction of 4.2°C was found with the rooftop garden compared to the bare roof.
The green roof systems rely on the structural load-bearing requirement, client, budget, access, and design elements. Green roofs are categorized into two techniques: intensive and extensive, which are shown in Figure 1.9. The basic difference between these two categories is summarized in Table 1.2. Intensive roofs utilize hardier plants and involve a growing medium of more than 300 mm. Roofs of this system can support additional functions such as providing an outdoor garden space for food production. It includes a greater load of more than 150 kg m−2 and requires maintenance in the form of weeding, fertilizing, and watering [40].
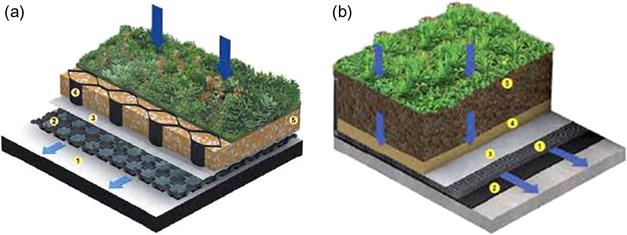
Table 1.2
Green roof categories [44]
| Extensive | Intensive |
| Shallow<300 mm | Deep>300 mm |
| Light | Heavy |
| Low maintenance | High maintenance |
| <Species diversity | >Species diversity |
| Retrofit opportunity | >Benefits/marketing |
| <Cost installation and maintenance | >Cost installation and maintenance |
Extensive green roofs are more common and employ a shallow growing medium of less than 300 mm. A well-designed extensive green roof include subsystems of drainage, plant nourishment and support, protection of the underlying waterproofing system, and an insulation system. The plants selected for extensive roofs typically include succulents and moss. The extensive green roof design is outfitted toward low maintenance and a limited watering system. A maximum maintenance of one to two times each year is required [45]. It can be distinguished by being low-cost and lightweight at 50–150 kg m−2. The extensive green roof technology has been adopted in this study because of these advantages.
1.4 Experimental Design and Measurement
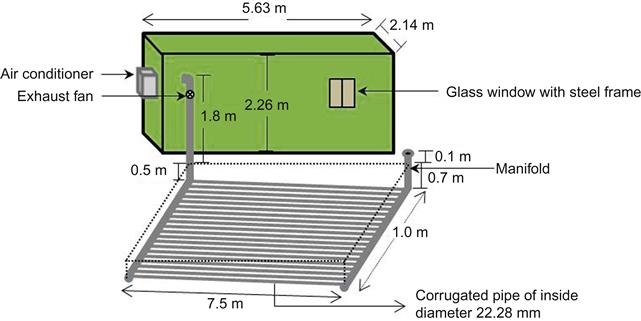
Three shipping containers, each of dimensions of 5.63 m×2.14 m×2.26 m were installed and fitted in the sustainable precinct at Central Queensland University, Rockhampton, Australia, for the experimental measurement. One was connected to the horizontal earth pipe cooling (HEPC) system as shown in Figure 1.10, another to a green roof system as shown in Figure 1.11, and another to without any of these systems. For excess rain water runoff, the containers were set with a 3° pitch from north to south. An air conditioner was installed in each of the rooms to cool the interior space in combination with the HEPC and green roof system. All the air conditioners were set at 24°C to achieve optimal comfort and energy savings.


For the HEPC system, an excavation of dimension 8.1 m×2 m was made for fitting the corrugated buried pipes horizontally. The excavation maintained a slope of 0.2 m down the length of the excavation to cause moisture to fall toward the sand and gravel drainage pit. The sloped base ensures the flow of water to a low point, where a gravel rubble drain enables water spillover and/or provides a point from which excess water can be mechanically extracted by pump.
The horizontal piping system shown in Figure 1.12 includes two simple polyvinyl chloride (PVC) pipes of outer diameter 0.125 m, which are also known as manifold. The manifold contains 20 holes of 21 mm diameter each accepting 20 corrugated PVC buried pipes. Manifolds were joined with the buried pipes aligned horizontally, each of length 8 m, diameter 20 mm, and thickness 1 mm. These corrugated pipes were pressed (friction fitting) into one row. Each buried pipe in the row was separated from its neighbor by approximately 20 mm.
An exhaust fan was set into a manifold to draw in intake air. The air is cooled by soil as it passes through the buried pipes before entering the room. To increase the cooling effect of the system, small trees were planted to provide shade to the soil which covered the pipes underground.
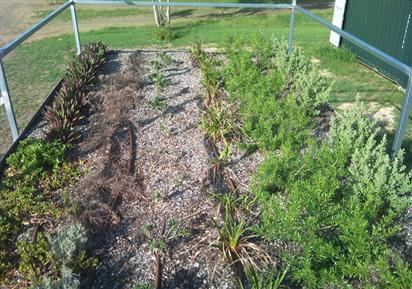
Each roof of the containers, of area 15 m2, was constructed of die-stamp corrugated steel sheets. For the green roof system, both handrail and guardrail were made as per Australian Standard (AS 1657–1992), which ensures the safety to work on the rooftop garden. A galvanized aluminum frame of 230 mm was bolted onto the roof securely to hold the green roof materials as shown in Figure 1.11. Waterproofing membrane, drainage system, filter fabric/geotextile, substrate, and plants were used as the green roof materials for the experimental green roof system. One pail of 22 kg waterproofing membrane was used to cover the roof and protect the structure from water penetration. The schematic diagram of the green roof system is shown in Figure 1.13.

A gutter was positioned on the south wall top for collecting excess water from the green roof. An Elmich Versicell lightweight drainage module was used to capture any high volumes of water and protect the waterproofing membrane. A needle-punched filter fabric made of polypropylene was utilized to restrict fine particles of growing media from entering the drainage layer. A bioganic earth substrate of Enviroganics was used for growing the plants. It has high water storage capacity, includes peat moss, composted sawdust, coco peat, washed sand, fertilizer, and water-retaining crystals. The plants selected for a green roof must endure severe sun and hot temperatures, along with changes in humidity and moisture. Different types of local native plants were chosen for the rooftop garden including species such as Rhoeo, Helichrysum italicum, Callistenon Captain Cook, Dianella Little Jess, Eremophila maculata and Grevillea obtusifolia Gingin Gem. An auto-irrigation system was installed to water the plants. The rooftop garden for the green roof system is shown in Figure 1.14.
Through a suite of experimental design, experimental tests, and field investigation, the cooling performance of the HEPC in combination with the green roof (hybrid HEPC) system was assessed against various parameters. Average room air temperature, air velocity, and relative humidity were measured from all the modeled rooms to investigate their impact on room cooling performance. Average air temperature and velocity were collected at the pipe inlet of the HEPC modeled room. Indoor room temperature close to the roof was also measured from the green roof modeled room to evaluate the performance of the hybrid system. Data were collected in January, 2014, from 10:00 am to 5:00 pm. The data for this time period were taken into consideration for this study as the maximum heat loads during a day occurred in this period. All data were logged at 5 min intervals.
1.5 Model Description
The hybrid HEPC involves the heat transfer problem where the earth transfers the heat to the buried pipes underground. CFD is well known as a powerful method to study heat transfer over many years. CFD codes are designed around the numerical algorithms that can tackle fluid flow problems. It solves partial differential equations, numerically governing air flow and heat transfer in a discretized form. A CFD model, namely the RNG ![]() turbulence model was used for the heat transfer problem of the hybrid HEPC system. It is more accurate and reliable for a wider class of turbulent flows in industrial flow and heat transfer simulations. The turbulence model was selected for the thermal modeling as the flow passing through the buried pipes was turbulent. The model satisfies certain mathematical constraints on the Reynolds stresses and is consistent with the physics of turbulent flows. The heat transfer problem of the hybrid earth pipe cooling system was solved numerically by using the CFD code “Fluent in ANSYS 15.0,” which uses the finite volume method for discretization of the computational domain.
turbulence model was used for the heat transfer problem of the hybrid HEPC system. It is more accurate and reliable for a wider class of turbulent flows in industrial flow and heat transfer simulations. The turbulence model was selected for the thermal modeling as the flow passing through the buried pipes was turbulent. The model satisfies certain mathematical constraints on the Reynolds stresses and is consistent with the physics of turbulent flows. The heat transfer problem of the hybrid earth pipe cooling system was solved numerically by using the CFD code “Fluent in ANSYS 15.0,” which uses the finite volume method for discretization of the computational domain.
1.5.1 Modeling Equation
The RNG ![]() model is derived from Navier–Stokes equations. The Navier–Stokes equation of motion and the transport equations for the RNG
model is derived from Navier–Stokes equations. The Navier–Stokes equation of motion and the transport equations for the RNG ![]() model are described as below:
model are described as below:
[1.1]
and
[1.2]
[1.3]
 [1.3]
[1.3]where, ![]() ,
, ![]() are the components of fluctuating velocity (m s−1);
are the components of fluctuating velocity (m s−1); ![]() are the components of length (m);
are the components of length (m); ![]() is the pressure (Pa),
is the pressure (Pa), ![]() is the molecular kinetic viscosity of the fluid (m2 s−1);
is the molecular kinetic viscosity of the fluid (m2 s−1); ![]() is the effective viscosity
is the effective viscosity ![]() , where
, where ![]() is the fluid viscosity (kg m−1 s−1);
is the fluid viscosity (kg m−1 s−1); ![]() is the density of the fluid particle (kg m−3); t is the time (s);
is the density of the fluid particle (kg m−3); t is the time (s); ![]() is the turbulent kinetic energy (m2 s−2);
is the turbulent kinetic energy (m2 s−2); ![]() is the dissipation rate (m2 s−3);
is the dissipation rate (m2 s−3); ![]() is the generation of turbulence kinetic energy due to the mean velocity gradients (kg m−1 s−2);
is the generation of turbulence kinetic energy due to the mean velocity gradients (kg m−1 s−2); ![]() is the generation of turbulence kinetic energy due to buoyancy (kg m−1 s−2);
is the generation of turbulence kinetic energy due to buoyancy (kg m−1 s−2); ![]() represents the contribution of the fluctuating dilatation in compressible turbulence to the overall dissipation rate (kg m−1 s−2);
represents the contribution of the fluctuating dilatation in compressible turbulence to the overall dissipation rate (kg m−1 s−2); ![]() and
and ![]() are the inverse effective Prandtl numbers for
are the inverse effective Prandtl numbers for ![]() and
and ![]() respectively (kg m−1 s−2);
respectively (kg m−1 s−2); ![]() is the gas-law constant for
is the gas-law constant for ![]() (8.31447×10³ J kg−1 mol−1 K−1); user-defined source terms,
(8.31447×10³ J kg−1 mol−1 K−1); user-defined source terms, ![]() and
and ![]() , are the mean strain rates for
, are the mean strain rates for ![]() and
and ![]() respectively (m2 s−2);
respectively (m2 s−2); ![]() ,
, ![]() and
and ![]() are constants.
are constants.
The energy equation for this heat transfer problem is solved throughout the entire domain and is given by
[1.4]
where ![]() is the effective conductivity (W m−1 K−1),
is the effective conductivity (W m−1 K−1), ![]() is the turbulent thermal conductivity,
is the turbulent thermal conductivity, ![]() is the component of diffusion flux (m−2 s−1),
is the component of diffusion flux (m−2 s−1), ![]() is the temperature (K),
is the temperature (K), ![]() is the heat transfer due to convection,
is the heat transfer due to convection, ![]() is the enthalpy (J kg−1),
is the enthalpy (J kg−1), ![]() species diffusion,
species diffusion, ![]() is the heat transfer due to viscous diffusion, and
is the heat transfer due to viscous diffusion, and ![]() is the total entropy (J K−1).
is the total entropy (J K−1).
1.5.2 Geometry of the Model
A 2D geometry for this model was created in DesignModeler, which is shown in Figure 1.15. The geometry consists of a pipe inlet of diameter 0.15 m, which is connected to the HEPC room with dimensions of 5.63 m×2.26 m.

1.5.3 Mesh Generation
A typical mesh was generated using DesignModeler in ANSYS 15.0, which is shown in Figure 1.16. The mesh generates a high percentage of cells in a Cartesian layout in the far field to deliver accurate fluid flow results. An optimum number of cells, namely 510,956, were created in the meshing to get an accurate result as a large number of cells may result in long solver runs and a small number of cells may lead to inaccurate results. Cell zone condition for the surface body was defined as fluid. All the zones used in the geometry were defined, such as pipe inlet, door, window, roof, and room walls. No slip boundary conditions were applied on the door, window, roof, and room walls.

1.5.4 Solver Approach
A 2D pressure-based segregated solver was used for the thermal modeling of the hybrid HEPC system. The solver uses a solution algorithm where the governing equations are solved sequentially (i.e., segregated from one another). Several iterations of the solution loop were performed before a converged solution was obtained, since the governing equations are non-linear. The pressure implicit with splitting operators (PISO) pressure–velocity coupling scheme was adopted for numerical calculations as it is useful for steady-state calculations on highly skewed meshes. PISO is based on the higher degree of the approximate relation between the corrections for pressure and velocity. The PISO scheme allows for a rapid rate convergence without a significant loss of solution stability and accuracy [46]. Pressure was discretized with a PRESTO scheme because of its strong convergence capability [47]. The PRESTO scheme is also available for all meshes such as tetrahedral, triangular, hexahedral, quadrilateral, and hybrid meshes.
Spatial discretization of a second-order upwind scheme was used for momentum, turbulent kinetic energy, and turbulent dissipation rate as the second-order discretization of the viscous terms is always accurate in Fluent. Moreover, the second-order upwind differencing scheme was used to overcome numerical diffusion. At the end of the solver iteration, the lift, drag, and moment coefficient were computed and stored to generate a convergence history. The standard initialization in the entire domain used in this study allows setting the initial values for the flow variables and initializing the solution using these values.
1.6 Results and Discussion
Experimental results were obtained through a series of experimental tests and measurements. The measuring tools of Reed Vane Anemometer and HOBO Pendant Temp were used to measure air velocity and air temperature, respectively. All the measurements were conducted in January 2014. In summer, the indoor and outdoor air temperature of Rockhampton, Australia, varies significantly due to its geographical location. Rockhampton lies in the south-east trade wind belt, too far south to experience regular north-west monsoonal effects, and too far north to be affected by higher latitude cold fronts [48].
One HOBO Pendant Temp logger recorded the outdoor air temperature. The maximum temperature of 41.56°C and minimum temperature of 25.21°C occurred outside the rooms as shown in Figure 1.17. This figure also shows the performance of both the HEPC and green roof system in terms of indoor room temperature, where the HEPC system displays a better performance than the green roof system. However, the outdoor temperature fell suddenly on January 7, 2014 due to rainfall for a few hours.

The HOBO Pendant Temps were also located in the middle of all three rooms to collect indoor air temperature and relative humidity measurements. The indoor air temperature profile of the HEPC, green roof, and standard rooms are shown in Figure 1.18. The figure illustrates that the indoor temperature varies from 24°C to 25.62°C for HEPC, 24.35°C to 26.39°C for the green roof system, and 25.39°C to 28.16°C for the standard room. Average indoor temperatures of 24.81°C, 25.05°C, and 27.06°C were found for HEPC, green roof, and standard room. Depending on these average indoor temperatures, the HEPC and green roof technology assisted in reducing the temperature by 2.25°C and 2.01°C, respectively, in comparison with the standard room. Therefore, a substantial temperature reduction of 4.26°C may be achieved for the HEPC system in combination with the green roof system, that is, for the hybrid HEPC system.

An average air velocity of 1.7 m s−1 and air temperature of 23.48°C were measured at the pipe inlet of the modeled room connected to the HEPC system. In many cases, inadequate supply of outdoor air causes poor indoor air quality. Indoor air velocities below 0.25 m s−1 do not produce substantial distraction even in tasks requiring substantial attention. The relative humidity of the air has little impact in the thermal comfort. It is still an essential variable to measure, especially in hot climates. The relative humidity of the rooms was measured to assess its impact inside the rooms, which is summarized in Table 1.3. Figure 1.19 shows the indoor relative humidity that varies from 54.25% to 83.87% for HEPC, 57.52% to 79.56% for the green roof, and 51.08% to 76.28% for the standard room. Overall relative humidity was below 80% for all the rooms except the maximum relative humidity of 83.87% which occurred on January 7, 2014 due to rainfall.
Table 1.3
Air temperature and relative humidity for all the rooms
| Indoor temperature | Outdoor temperature | Relative humidity | |||||||
| Modeled rooms | Min (°C) | Max (°C) | Avg (°C) | Min (°C) | Max (°C) | Avg (°C) | Min (%) | Max (%) | Avg (%) |
| HEPC | 24.00 | 25.62 | 24.81 | 25.21 | 41.56 | 33.35 | 54.25 | 83.87 | 70.88 |
| Green roof | 24.35 | 26.39 | 25.05 | – | – | – | 57.52 | 79.56 | 69.00 |
| Standard room | 25.39 | 28.16 | 27.06 | – | – | – | 51.08 | 76.28 | 63.27 |


Relative humidity levels below 20% can result in discomfort through drying of the mucous membranes and skin, whereas relative humidity above 70% may lead to the development of condensation on surfaces and within the interior equipment and building structures. Average relative humidity of around 70% was observed for both the HEPC and the green roof system, which is acceptable in the context of thermal comfort for the measured temperature of 24.81°C and 25.05°C, respectively. The relative humidity of the HEPC and green roof systems was higher than the standard room due to the moisturizer effect.
The average room temperature and relative humidity for the hybrid HEPC system would be around 22.8°C and 73.34%, respectively, with a 4.26°C temperature reduction using both the HEPC and green roof technology together. This measurement was compared with ASHRAE standard 55-2010 using the adaptive method in the Centre for the Built Environment (CBE) thermal comfort tool. It was found that this level of temperature and relative humidity complies with the ASHRAE standard 55-2010 [49], Brown’s bioclimatic chart [50], and Givoni’s chart [51,52].
In combination with the green roof system, performance of the HEPC (hybrid HEPC) system was also calculated numerically at different iterations. The solution was convergent at the iteration of 47,033. Temperature and velocity profiles for hybrid HEPC system are shown in Figures 1.20 and 1.21 at four different iterations of 500, 10,000, 25,000, and 47,033. The flow and thermal variables for the boundary and cell zone conditions were set on the boundaries of the model. Average air velocity of 1.7 m s−1 and air temperature of 23.48°C collected from the HEPC system were set at the pipe inlet of the boundary conditions. An average indoor room temperature of 27.06°C measured from the standard room was set as the indoor room temperature and an indoor roof temperature of 25.21°C was set as the roof temperature of the model. The simulation result was obtained under the boundary conditions shown in Table 1.4.


Table 1.4
Parameters and thermal properties of the materials used under the boundary conditions of the model
| Parameters | Value |
| Pipe inlet velocity | 1.7 m s−1 |
| Air temperature at pipe inlet | 23.48°C |
| Indoor room temperature | 27.06°C |
| Roof temperature | 25.21°C |
| Glass thermal conductivity | 0.8 W m−1 K−1 |
| Air thermal conductivity | 0.024 W m−1 K−1 |
| Air density | 1.204 kg m−3 |
| Specific heat of air | 1006.43 J kg−1 K−1 |
| Air viscosity | 1.850387e–05 kg m−1 s−1 |
The predicted indoor room temperature of 297.20 K (24.05°C) was observed at the midpoint of the room for the hybrid HEPC system as shown in Figure 1.20(d). This predicted temperature is 3.01°C less than the measured standard room temperature of 300.21 K (27.06°C). Cool air came through the inlet and cool roof temperatures surrounding the room are the main reasons behind this temperature reduction. In HEPC technology, air comes through the series of buried underground pipes that was cooled by the soil in summer due to heat convection, whereas the roof temperature was cooled due to heat conduction in green roof technology.
A study was carried out to check the effect of the grid variation and to establish the optimum mesh size which ensures consistent results for every mesh size. The numerical result shows a temperature reduction of 3.01°C for the hybrid HEPC system while the experimental result displays 4.26°C for the HEPC and green roof systems together. The main reasons behind this variation are described below:
• There was no experimental room which combined both the HEPC and green roof systems together. They were installed separately in two different rooms.
• Air pressure reduced inside the pipe in the HEPC system as air was passed through the long pipes of 157 m in length.
• Roof temperature measured from the green roof system may vary, if the two systems are installed together in a single room.
1.7 Conclusion
Earth pipe cooling systems are often an alternative for controlling temperature and saving energy in residential, agricultural, andindustrial buildings and greenhouses. Green roof systems for buildings also represent an energy-efficient technology to provide different private and public benefits. The main purpose of this study was to evaluate the thermal performance of both these systems together. The thermal performance of the hybrid HEPC system was assessed by developing a thermal model for a subtropical climate in Queensland, Australia. HEPC and green roof systems were involved in the hybrid HEPC system. A CFD model of RNG turbulence was used to develop the thermal model. the impact of air temperature, air velocity, and relative humidity were evaluated on the room cooling performance using simulation in Fluent within ANSYS 15.0. Inlet air velocity and air temperature at the pipe inlet and roof temperature inside the room were set to predict their effects on the indoor room temperature. A minimum reduction of 3.01°C for room temperature was found in the simulation result, while 4.26°C was observed in the experimental result. The numerical result was compared with the experimental result and a good agreement was obtained between these two results although there was a deviation of 4.62%. Further investigation is being undertaken in this study.
Acknowledgments
S.F. Ahmed is grateful to Central Queensland University, Australia for the international postgraduate research award (IPRA) to support this study. The authors gratefully acknowledge the support provided by Ergon Energy, Australia for supplying the HEPC system and the installation cost of the measuring tools.