Cement Kiln Process Modeling to Achieve Energy Efficiency by Utilizing Agricultural Biomass as Alternative Fuels
Azad Rahman, M.G. Rasul, M.M.K. Khan and S. Sharma, School of Engineering and Technology, Central Queensland University, Rockhampton, QLD, Australia
Cement manufacturing is an energy-intensive and heavy pollutant emissions process. Waste-derived alternative fuels are widely used to reduce the pollutant emissions and the use of fossil fuel. Within the cement kiln, it requires about 40–50% of total thermal energy to complete the complex chemical reactions of clinker formation. High kiln temperature and the intrinsic ability for clinker to absorb and lock contaminants into the clinker allow the kiln to burn a wide range of alternative fuels. Agricultural biomasses are one of the emerging alternative fuels in the cement industry due to their availability and very low price. This chapter presents the effects of using agricultural biomasses as alternative fuels on the energy efficiency and emission from the kiln by using Aspen Plus process modeling. The suggested model is verified against measured data from industry and data available in literature. Results show that up to 3% of energy efficiency improvement along with 3.5% reduction of CO2 can be achieved through the utilization of various agricultural biomasses.
Keywords
Cement; kiln; emission; process modeling; energy efficiency
9.1 Introduction
The production of cement consumes approximately 3.2–6.3 GJ of energy (thermal and electrical) and 1.7 tonnes of raw materials (mainly limestone) per tonne of clinker produced [1,2]. Energy cost accounts for 50–60% of the production costs [3], while thermal energy equates to 20–25% of the total production cost [4]. In the manufacturing process thermal energy is used mainly during the calcination in a preheater tower and the burning process in the kiln [4]. Fossil fuels such as coal, petroleum coke (petcoke), and natural gas are the main source of thermal energy in the cement industry and they are used in the kiln section as well as in the preheater-precalciner tower calciner. The kiln and calciner require about 40% and 60% of the total thermal energy, respectively [5]. Concerns of environmental impact and increasing fossil fuel price led cement manufacturers to switch to alternative energy sources. Using waste tires, municipal solid waste, and industrial waste as alternative fuels in cement manufacturing has become well established over the last three decades. Meat and bone meal [6], agricultural biomass, and spent pot linings [7] have recently been identified as potential alternative fuels for the cement industry.
The cement industry accounts for 5–6% of all CO2 generated by human activities, which causes about 4% of global warming [8]. Along with that the cement manufacturing process releases NOX, SO2, and some other heavy metals into the environment which need to be suitably controlled. The environmental impact of alternative fuels need to be assessed before employing them in the manufacturing process. Economic risks associated with the experimentation of alternative fuels restrict the researchers conducting tests in the cement plant. Computer process models are currently being used worldwide to predict the effects of selected alternative fuels on plant performance and emissions. Process simulation models allow testing of a wide range of alternative fuels with minimal cost, time, and risk.
Major clinker formation reactions occur in the rotary kiln, which makes it the key equipment of the entire process. In the last decade numerous approaches have been taken to create computational fluid dynamics (CFD)-based models to simulate rotary kilns [9–12]. Due to the complexity of modeling the behavior of solid particles in conventional CFD framework, researchers use one-dimensional models with material and energy balance equations. Numerical techniques associated with solving boundary value problems are incorporated to achieve accurate temperature profiles and specific mass fractions [13–16]. The aforementioned models were used to study flame shape, temperature of the kiln, velocity profile of particles in the kiln system [17], and oxygen enrichment in the burning zone [18]. Unlike CFD-based modeling Kaantee et al. [6], Zhang et al. [19], and Rahman et al. [20] used Aspen Plus software to simulate the cement clinker production focusing on clinker chemistry and thermodynamics in the rotary kiln and in the calciner. Aspen Plus is a process engineering software which is capable of simulating the entire process by using the mass and energy balance of all chemical reactions within the process. In the current study a process model of rotary kiln in the cement industry is built using the unit operation block available in Aspen Plus to study the impact of some selected alternative fuels on the emissions and quality of the clinker.
Numerous studies on the impact of alternative fuels on cement manufacturing were carried out over the last two decades. Unfortunately, not many studies were found in the literature regarding the use of agricultural biomass as an alternative fuel in the cement industry. Researchers have carried out experimental and numerical studies to determine the heating value of different agricultural biomasses [21–26]. During the last decade researchers concentrated on the impact of co-firing biomass and coal on emissions [27,28], flame characteristics [29], and cost effectiveness [30]. Specific agricultural biomass, for example bagasse [31], coffee husk [32], rice husk [33], and saw dust [34], were studied to justify their performance in power generation. In spite of worldwide usage of agricultural biomass as an alternative fuel in the cement industry, scant literature was found regarding the effect on clinker quality and emissions from cement plant. Sharma et al. [34] studied the use of saw dust in cement manufacturing along with the effect on clinker quality. Warnken and Giurco [35] identified the benefits and barriers to using various biomass fuels including wood, wheat residues, and rice husks in the cement industry. In this chapter, five agricultural biomasses, namely bagasse, almond shell, rice husk, coffee husk, and olive husk were examined by using the Aspen Plus-based cement kiln model. The outcomes in terms of emissions, production, and quality of clinker have been presented.
9.2 Cement Manufacturing Process
The manufacturing processes of cement vary with respect to equipment design, method of operation, and fuel consumption [36]. The cement manufacturing process basically includes quarry, raw meal preparation, preheating of raw meal, kiln, clinker cooling, grinding, storage, and dispatch, which is illustrated in Figure 9.1 [6]. The chemical reaction within the cement manufacturing process starts with the decomposition of calcium carbonate (CaCO3) at about 900°C to leave calcium oxide (CaO, lime) and liberates CO2; this process is known as calcination. Then the clinkerization occurs inside the kiln at high temperature (typically 1400–1500°C). Inside the kiln, calcium oxide reacts with silica, alumina, and ferrous oxide to form the silicates (C3S, C2S), aluminates (C3A), and ferrites (C4AF) respectively, which are the main constituent of the clinker. This clinker is then ground in a ball-mill together with gypsum and other additives to produce cement. Fuels are required to generate thermal energy during the process of calcination in the preheater-precalciner tower and during the clinkerization process in the kiln.

9.2.1 Kiln
The kiln is the most important component of a cement manufacturing plant as most of the chemical reactions take place in it at high temperature. Rotary kilns are used which consist of a huge rotating steel furnace with a length and diameter ratio between 10 and 40 [37]. The range of its length varies from 60 to 200 m while the diameter ranging from 3 to 9 m [4]. The slight inclination (2.5–4.5%) together with the slow rotation (0.5–4.5 revolutions per minute) allow for a material transport sufficiently long to achieve the thermal conversion processes required [37]. Kilns are operated in a counter-current configuration where gases and solids flow in opposite directions through the kiln, providing more efficient heat transfer. The raw meal is fed in at the upper end of the rotary kiln, and the slope and rotation cause the meal to move toward the lower and hot end. The kiln is fired at the lower end, usually with coal or petcoke as the primary fuel. As the meal moves through the kiln and is heated, it undergoes drying and pyroprocessing reactions which cause chemical and physical changes to form the clinker. The red-hot clinker is discharged from the end of the kiln and passed through coolers to cool down. Depending on the manufacturing process, rotary kilns can be classified into the following types [38]:
The main energy-intensive phases of the cement production process take place inside the precalciner, kiln and during the production of clinker. A large amount of thermal energy is required to create enough heat for the cement kiln and precalciner. Typical thermal energy consumption of clinker manufacturing with different kiln processes is illustrated in Table 9.1 [5].
Table 9.1
Specific thermal energy consumption in kiln processes [5]
| Kiln process | Thermal energy consumption (GJ tonne−1 clinker) |
| Wet process with internals | 5.86–6.28 |
| Long dry process with internals | 4.60 |
| 1-Stage cyclone preheater | 4.18 |
| 2-Stage cyclone preheater | 3.77 |
| 4-Stage cyclone preheater | 3.55 |
| 4-Stage cyclone preheater plus calciner | 3.14 |
| 5-Stage preheater plus calciner plus high-efficiency cooler | 3.01 |
| 6-Stage preheater plus calciner plus high-efficiency cooler | <2.93 |
Within the kiln major chemical reactions occur to form the constituent of clinker. Apart from the calcination reaction at the opening end of the kiln the major reactions in the kiln are:
• C3S formation: 3CaO+SiO2→3CaO·SiO2
• C2S formation: 2CaO+SiO2→2CaO·SiO2
A schematic diagram of the temperature profile along with the qualitative phase of the main reaction in the kiln is given in Figure 9.2 [39]. The exact temperature of the kiln flame is not typically measured as adequate temperature sensors are not generally built into the kiln. However, a predicted temperature profile can be constructed based on the temperature of the kiln gas and the state of the solid inside the kiln [39]. About 40% of total thermal energy is required in the kiln to complete the clinkerization process. Depending on the process type one or more alternative fuels can be utilized in the kiln along with the primary fuel, coal. Typically, alternative fuels are injected with the primary fuel by using a multi-channel burner, which is capable of introducing solid and liquid fuel at the same time in the burning zone.

9.3 Alternative Fuels
Most waste materials contain some heating value and thus can be considered as an alternative fuel in the cement industry for heat generation. Increasing pressure from environmental groups and the commitment for sustainable cement production led cement manufacturers to lean toward readily available alternative fuels. Alternative fuels have been utilized at a commercial level in the cement industry for the past 30 years. In calciner lines, close to 100% alternative fuel firing at the precalciner was achieved at a very early stage [40]. Use of alternative fuels in rotary kilns is still in progress as the manufacturers are facing some challenges regarding environmental, social, and product quality issues.
Generally, cement producers choose the alternative fuels on the basis of price and availability but these criteria of selecting alternative fuels are not adequate. Composition of the fuel including the energy content, moisture, and volatile contents are very important criteria for selection. The specific criteria that a material must meet in order to be considered as a fuel are typically set by the individual cement producer according to their own needs. Some important criteria of alternative fuels are listed below [4,41]
• physical state (solid, liquid, gaseous) and physical property (scrap size, density, homogeneity) of the fuel,
• content of circulating elements (Na, K, Cl, S),
• toxicity (organic compounds, heavy metals),
• composition and content of ash and content of volatiles,
• calorific value—over 14.0 MJ kg−1 for kiln, and over 8.0 MJ kg−1 for calciner,
• chlorine content—less than 0.2% and sulfur content—less than 2.5%,
• polychlorinated biphenyl content—less than 50 ppm and heavy-metals content—less than 2500 ppm,
• the cement quality and its compatibility with the environment must not decrease,
The range of alternative fuels is extremely wide. Alternative fuels are divided into three distinct categories: solid, liquid, and gaseous fuels [42,43]. Different types of alternative fuel regarding their physical state are listed in Figure 9.3 [44].

The cement industry can acquire alternative fuels from a wide variety of sources. The diversity of sources and inconsistent nature of these waste materials pose a difficult challenge to the cement producers regarding the storage, handling, and feeding of alternative fuels into the system. Utilization of a modern dryer and shredder, conveyer belt, and multi-channel burner facilitates the maximum usage of alternative fuels in the cement industry currently.
9.4 Agricultural Biomass
The use of agricultural biomass in power generation is a recent trend mostly in rural developing countries such as India, Thailand, and Malaysia [43]. In 2001, agricultural biomass accounted for 0.25% of thermal energy substitutes in the cement industry around the world [45]. The share of kiln fuel replaced by agricultural biomass is about 5% [46] and it is increasing slowly. Rice husk, corn stover, hazelnut shells, coconut husks, coffee pods, palm nut shells, and bagasse are the most common varieties of biomass currently being used in the cement industry [45]. Most of the agricultural biomasses have a moderate heating value, ranging from 14 to 21 MJ kg−1 [47], which is suitable to burn in a cement kiln as well as in a calciner. Research shows that 20% substitution of the thermal energy in cement by agricultural biomass can be achieved without major capital investment [27].
Agricultural biomass is considered as a CO2 neutral fuel since CO2 consumed by them during their life is almost the same amount of CO2 that it releases during combustion [28]. Different studies show that co-firing of agricultural biomass results in the reduction of NOX, SOX, and some heavy metal emissions [28,45,48]. Inconsistent supply of biomass and fluctuation of the heating value of some biomasses may restrict their use as an alternative fuel [43].
9.4.1 Agricultural Biomasses in Australia
In the world scale, Australia is a relatively small producer of agricultural crops. In spite of that, every year Australia exports a large amount of crops after fulfilling the demand of the local population. Australian crop production can be divided into two parts based on the period of production, namely summer crops and winter crops. Winter crops include barley, canola, chickpeas, field peas, lentils, linseed, lupins, oats, safflower, triticale, and wheat, while summer crops include cottonseed, grain sorghum, corn (maize), mung beans, rice, peanuts, soybeans, and sunflower [49]. Most regions in Australia are only able to produce one crop per year; however a few areas are capable of two crops in the same year due to favorable soil and climate conditions [50]. In 2013–2014, the area and production of the winter crop in Australia were 2,245,900 ha and 44,101 kt, respectively, while the same for the summer crop were 113,000 ha and 3705 kt, respectively [49]. Table 9.2 summarizes the production of different crops in Australia in 2012–2013 and 2013–2014 [49].
Table 9.2
Crop production of Australia [49]
| Winter crop | 2012–2013 kt | 2013–2014 estimated kt | Summer crop | 2012–2013 kt | 2013–2014 estimated kt |
| Wheat | 22,856 | 27,013 | Grain sorghum | 2230 | 1107 |
| Barley | 7472 | 9545 | Cottonseed | 1439 | 1287 |
| Canola | 4142 | 3760 | Cotton lint | 1018 | 910 |
| Chickpeas | 813 | 629 | Rice (paddy) | 1161 | 825 |
| Faba beans | 377 | 328 | Corn (maize) | 507 | 335 |
| Field peas | 320 | 342 | Soybeans | 92 | 63 |
| Lentils | 185 | 254 | Sunflower | 44 | 32 |
| Lupins | 459 | 625 | |||
| Oats | 1121 | 1326 | |||
| Triticale | 171 | 263 |

The amount of production of different crops indicates that there is plenty of agricultural waste that needs to be treated in an economic and environmentally friendly way. The major portion of agricultural waste is utilized as cattle feed and the rest is burnt and the ash used as soil fertilizer. The second option causes serious environmental damage in terms of air pollution and leaching of heavy metals into the soil. This study presents a sustainable way to incinerate agricultural waste inside the cement kiln to reduce air pollution and heavy metal emissions.
9.4.2 Selection of Agricultural Biomass
Numerous studies are available in literature regarding co-firing of agricultural biomass with coal but only a few identify the impact of burning them in cement kilns. This study examines the feasibility of five agricultural biomasses, namely bagasse, almond shell, rice husk, coffee husk, and olive husk, as alternative fuels in cement kilns. The biomasses were selected on the basis of their availability, world-wide application, and inadequate disposal option.
The sugar cane industry waste bagasse is generally consumed by the same plant for heat and electricity generation. However, the combustion residues need to be disposed of in landfills which may pose some environmental threat. Incinerating bagasse in a cement kiln ensures that all the combustion residue is confined within the clinker and enhances the quality of cement. In Australia, the total annual sugar cane crop is about 35.5 million tonnes (Mt), of which 14% is cane fiber, resulting in a total available energy of above 90 PJ [51].
The rice husk (or hull) is the outermost layer of the paddy grain which contains about 20% of the paddy weight [52] (Figure 9.4). It is separated from the rice grains during the milling process and generally burned as waste or disposed of in landfills or used as cattle feed [52]. In 2013–2014, Australia produced about 852 kt of rice which implies over 170 kt of rice husk production [49].

Australia is the world’s second highest almond producer (7%) and the total production in 2013 was about 73,361 tonnes [54,55]. The major wastes from the almond industry are the husk and the shell (Figure 9.5). In Australia, the estimated production of almond husk and shell was 189,768 tonnes for the 2014 [55]. Almond husk and shell are primarily used as cattle feed in Australia and its demand is low when other cost-effective feed sources (e.g. grain) are available. During this period almond husk and shell can be utilized as an alternative fuel for power generation. The cement industry could be an attractive option for almond producers for waste management.

During the last decade, Australian olive oil production has increased significantly and it is expected that the production will reach 90,000 tonnes or 15 million liters of olive oil for 2014/2015 [57]. This expansion in the Australian olive industry can be expected to result in the production of over 62,500 tonnes of solid waste and over 350×106 L of liquid waste per annum [58]. Disposal of olive solid and liquid wastes is a major environmental issue in several olive-growing countries. Inappropriate disposal of solid waste by spreading on farm lands and storing the liquid waste in anaerobic ponds causes ammonia to be released into the atmosphere and leaching of nitrates and other pollutants into the ground water [58]. The cement industry could be the destination of the solid waste from the olive industry to achieve sustainable production under a clean environment.
Australia grows around 600,000 kg of coffee, which is very small in the global scale and almost 99% of coffee consumed in Australia is imported [59]. Though the availability of coffee husk is very low in Australia, it is being used in major coffee-producing countries as an alternative fuel in the cement industry. In Uganda, the Hima cement plant has reduced fossil fuel consumption by around 30% by using coffee bean husks as a source of alternative fuel. In 2004, Brazil reduced fossil fuel use by about 42% by using biomass or waste of which a major portion consisted of coffee husk [56]. In this study we include coffee husk to promote local coffee production by improving the cost competiveness of the local coffee industry and produce an environmental friendly fuel for the cement industry at the same time.
9.4.3 Chemical Composition of Alternative Fuels
Before the implementation of any alternative fuel in the cement industry the manufacturer needs to examine the impact of the alternative fuel on emission and quality of the clinker. The chemical composition of the chosen alternative fuels could provide an initial insight into the potential emission from combustion. For instance, an alternative fuel containing more fixed carbon is expected to produce higher CO2, and higher sulfur content may cause higher SOX emission. Still proper modeling and simulation is required to better estimate the amount of pollutant emission since many chemical reactions occur in the kiln. Researchers have studied extensively the chemical composition of different agricultural biomasses along with the combustion characteristics. Table 9.3 presents the proximate and ultimate analysis of the selected five alternative fuels [21,26,27,28,32].
Table 9.3
| Coal (plant data) | Bagasse [28] | Almond shell [26] | Rice husk [27] | Coffee husk [32] | Olive husk [21] | |
| Proximate analysis (wt%) | ||||||
| Moisture | 4.2 | 10 | 9.7 | 9.96 | 10 | 9.2 |
| Ash | 19.1 | 11.27 | 3.72 | 22.88 | 2.4 | 3.6 |
| Volatile matter | 36.6 | 73.78 | 74.12 | 60.55 | 78.5 | 70.3 |
| Fixed carbon | 53.0 | 14.95 | 22.16 | 16.63 | 19.1 | 26.1 |
| Elemental analysis on dry basis (wt%) | ||||||
| C | 69.43 | 44.8 | 49.68 | 33.96 | 47.5 | 48.2 |
| H | 3.83 | 5.35 | 8.18 | 5.31 | 6.4 | 5.98 |
| N | 1.5 | 0.38 | 1.04 | 0.11 | – | 1.54 |
| S | 0.36 | 0.01 | – | – | – | – |
| Cl | 0.2 | 0.01 | – | – | – | – |
| O | 5.58 | 38.13 | 37.38 | 37.8 | 43.7 | 40.68 |
| LHV (MJ kg−1) | 27.4 | 17.3 | 29.86 | 13.5 | 18.39 | 19.0 |

9.5 Model Development and Validation
The cement manufacturing process consists of several complex chemical reactions along with heat transfer in solid liquid and vapor phases of different materials. Aspen Plus, Aspen HYSYS, and Ansys FLUENT are software commonly used by researchers to predict the performance and other characteristics of cement plants. Aspen Plus has a database covering a wide range of physical and chemical properties for chemicals, solids, and polymers and it has the capability to simulate chemical reactions within solid, liquid, and vapor phases [60]. Along with those two special features Aspen Plus contains a large number of predefined operation blocks which are very helpful to model any complex process such as cement manufacturing. In the current kiln model few predefined operation blocks were utilized and their descriptions and functions were summarized in Table 9.4.
 RYIELD
 RGIBBS
 RSTOIC
 Heater
9.5.1 Model Principle
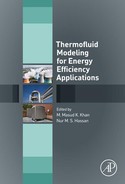
In this study, Aspen Plus software is used to model a cement kiln on the basis of energy and mass balance principle with the stoichiometry known of the chemical reactions. Different unit operation blocks were used to carry out specific tasks of the process, such as fuel decomposition, combustion, chemical reactions, cooling, and separation. In the current model all combustion was carried out on an energy balance basis. Combustion of the conventional fuel as well as the alternative ones took place in two Aspen Plus operation blocks. The two blocks were RYIELD and RGIBBS, where decomposition and combustion occur, respectively. Stoichiometric air was fed directly into the RGIBBS reactor block. Decomposition heat from the RYIELD reactor was transferred directly to the RGIBBS reactor block. The combustion residue and generated heat were then carried to the next series of operating blocks where clinkerization reactions occur in the presence of heat. The clinkerization process of the kiln was carried out by using three reactor blocks with the mass balance principle. A typical mass balance system of the kiln is given in Figure 9.6 which shows the required input and predicted output from the kiln to produce 1 kg of clinker. The reaction stoichiometry of the clinkerization process is known as the process is well established. The mass balance principle along with the reaction stoichiometry allow the use of the Aspen Plus RSTOIC reactor block to model the kiln. A series of reactor blocks were used for the different phases of clinkerization that occur at increasing temperatures inside the kiln. Kiln gas is separated from the product flow and hot product is cooled down using a heat exchanger operation block. Air with ambient temperature is used to cool the hot clinker and finally the tertiary air and clinker are separated by a separator block.

Large numbers of methods are available in the Aspen Physical Property System and two property methods, namely the IDEAL and SOLIDS property methods, were chosen for the current kiln model. The properties of solid and fluid phases cannot be calculated with the same type of model. Therefore the components were distributed over the sub-streams of types MIXED, CISOLID, and NC and their properties were calculated with appropriate models. When the solids are decomposed into individual components, they normally occur in the CISOLID sub-stream. A CISOLID component can be in simultaneous phase and chemical equilibrium in the RGIBBS model. Fluid components always occur in the MIXED sub-stream and they were treated with the IDEAL model which accommodates Raoult’s law and Henry’s law. Permanent gases may be dissolved in the liquid and can be modeled by using Henry’s law. NC sub-stream represents the nonconventional component stream and all the alternative fuels are categorized in this class. HCOALGEN and DCOALIGT models were used for enthalpy and density calculation which is suitable for coal and other solid alternative fuels.
9.5.2 Model Assumption
For the current study an Aspen Plus model was developed for a proposed alternative fuel kiln. The production capacity of the kiln was assumed to be 2200 tonnes day−1, with an option of burning alternative fuel along with the primary one, coal. To reduce the complexity of the model a few basic assumptions were made without any loss of generality. Assumptions for the current study were:
• Unlike the real process fuel combustion took place in two different reactors; a fuel decomposition unit and combustion unit, namely RYIELD and RGIBBS, respectively.
• Throughout the model, N2 of air was considered inert and NOX generation from the processes was due to the combustion of the fuel in the kiln.
• CO2 was produced through calcination of kiln feed and the combustion of fuels.
• For simplicity the entire kiln was modeled by using three unit operation blocks which distribute all the chemical reactions in a continuous manner.
• Ash was considered to be nonreactive in the combustion process.
• Any air leakages in the calciner system were not considered throughout the model.
• The thermal energy requirement in the kiln was assumed to be 40% of the total energy requirement.
• The energy requirement for the process was set according to the reference plant specification.
The process model of the kiln in the Aspen Plus flow sheet is given in Figure 9.7, which consists of reactors, separator, and cooler unit operation block. All the blocks were connected with material and heat streamlines. The operating conditions of kilns in terms of mass flow, temperature, and pressure were set according to the collected data from the reference plant.
The kiln feed data were collected from the output of preheater–precalciner tower and were used to construct the model to obtain output results in terms of clinker composition and gaseous emission. A wide range of operating parameters was required for the successful construction of the model which includes:
9.5.3 Model Validation
Simulation results were verified against the measured data which were collected from the local cement plant. The data consisted of the constituents of raw feed, clinker and fuel (coal), temperature and pressure at reference points, mass flow rate, thermal energy requirements, and other operating parameters. Data related to the clinker in terms of component as well as chemical breakdown were also available in the literature. For validation only coal was considered as a fuel in the process. The simulation results in terms of clinker element were in very good agreement with the plant data and the data available in the literature. Simulation results were presented along with the plant data in Table 9.5, which indicate that the proposed model has the capability to predict the outcomes of the cement manufacturing process. Small variations were found in the chemical components of some minor constituents, such as MgO, Na2O, K2O, and SO3, which may be due to the assumptions used when constructing the model. Ash content was assumed to be inert in the system, while actually ash can be highly reactive in the high temperatures inside the kiln and may increase those aforementioned minor constituents.
Table 9.5
Validation of simulation results against plant data
| Input | |
| Material streams | Plant data |
| Kiln feed (kg s−1) | 27.902 |
| Coal (kg s−1) | 1.1338 |
| Excess air in the system | 10% |
| Output | ||||||
| Component of clinker | Plant data | Simulation results | Chemical breakdown of clinker | Reference data [63] | Plant data | Simulation results |
| C4AF | 11.83 | 11.7 | CaO | 60–67 | 66.79 | 66.718 |
| C3A | 8.56 | 8.93 | SiO2 | 17–25 | 21.84 | 21.68324 |
| C2S | 19.71 | 18.99 | Al2O3 | 3–8 | 5.72 | 5.806836 |
| C3S | 56.89 | 57.36 | Fe2O3 | 0.5–6.0 | 3.89 | 3.839131 |
| LSF | 100.04 | 93.93 | MgO | 0.1–5.5 | 1.1 | 0.142451 |
| AR | 1.42 | 1.51 | Na2O+K2O | 0.5–1.3 | 0.68 | 0.186283 |
| SR | 2.25 | 2.25 | SO3 | 1–3 | 0.22 | 0.018356 |
| HM | 2.23 | 2.13 | ||||
| Free lime | 1.1 | 1.19 | ||||

LSF, lime saturation factor; AR, alumina ratio; SR, silica ratio; HM, hydraulic modulus.
9.5.4 Modified Kiln Model
The major challenges of implementing alternative fuels are to ensure that pollutant emission or the quality of the clinker is within acceptable levels. Using alternative fuels in the kiln system may lower the flame temperature which will affect the clinker quality. Also, introducing alternative fuel should not reduce the daily production of clinker which may offset the advantage achieved by energy saving. Alternative fuel can substitute 20% of the total thermal energy requirement according to the rule of thumb. In a real plant case this may not be true due to lots of constraints. To predict the outcome of implementing the selected alternative fuels, the proposed model was upgraded by adding a unit operation block to burn alternative fuels. Figure 9.8 shows the modified kiln model to examine the use of alternative fuels.

The proposed alternative fuel kiln model was constructed to simulate a 2200 tonnes day−1 production kiln with the alternative fuel burning option. For the current study five agricultural biomasses were considered to be used in the kiln system as alternative fuels. The energy requirement of the kiln was assumed to be 40% of total and energy requirement according to data that were collected from the local cement plant. For simplicity of the model 10% excess air was allowed in the burning zone of the kiln. The feed rate of alternative fuels was varied from 5% to 25% of total thermal energy required in the kiln. Calculation of mass flow rate were carried out by using the built-in calculator block in Aspen Plus. The output results were scrutinized from an air emission standpoint and by clinker constituents.
9.6 Simulation Results and Discussion
A processes model for a cement kiln was constructed and verified against plant and literature data. The model was modified to facilitate alternative fuel burning options. Five agricultural biomasses were selected to be used in the kiln model as alternative fuels. The model was run with different substitution rates of alternative fuels. The concentrations of pollutants in the flue gas were examined along with the quality of the clinker.
Total CO2 emissions from the clinker production process depend on the fuel and quality of raw feed. Approximately 977 kg of CO2 is produced for each tonne of clinker [64]. In a preheater and calciner kiln system about 75% of the CO2 emitted from the calcination and fuel combustion is in the preheater tower. This indicates that the kiln itself is accountable for about 200 kg CO2 generation per tonne of clinker. Figures 9.9 and 9.10 represent the simulation results in terms of CO2 and CO emission from a kiln system while burning alternative fuels in a fixed ratio. It was found that all selected alternative fuels were competent to reduce the CO2 emission from the kiln to some extent. Among the selected alternative fuels, almond shell were found to reduce the CO2 by about 5.4%, while with others the reduction was 1–2%. In terms of CO emission from the kiln, again almond shell was found to be the best option among the selected agricultural biomasses. Thermal energy substitution of 25% by almond shell leads to a 3.6% reduction in CO emission. In the European standard CO emission from cement plant is allowed to be as high as 2000 mg Nm−3 [65], whereas in the present study it was found to be within 1050 mg Nm−3. Unfortunately, in Australia the specific emission standard for a cement plant varies from state to state [66] and in Victoria the emission limit of CO is 2500 mg Nm−3. In order to keep CO concentration on the kiln gas below 3.1 kg tonne−1 clinker, which is equivalent to 1000 mg Nm−3, alternative fuel substitution was allowed up to 20%, 15%, 12%, and 13.5% for bagasse, rice husk, coffee husk, and olive husk, respectively. In the case of almond shell, it can fulfill at least 25% of the thermal energy requirement without any increase in CO emission.


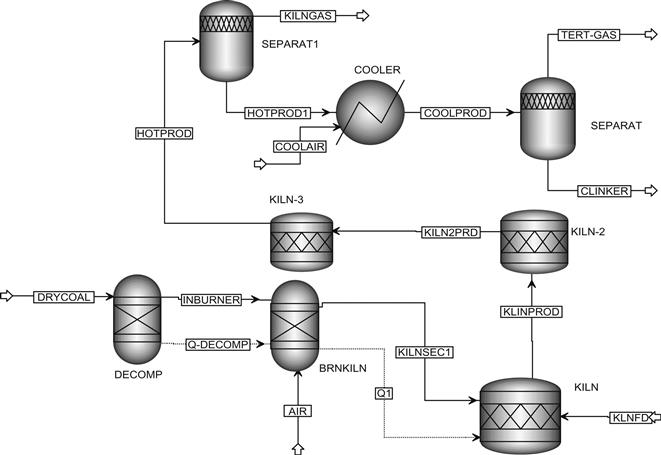
Percentages of NOX and SOX in the kiln gas are dependent on the fuel type, feed rate, excess air in the burning zone, and flame temperature [67]. One tonne of cement production is accountable for 1.5–10 kg of NOX emission [68]. Figure 9.11 illustrates NOX concentration in the kiln gas. In Australia (New South Wales) [66], the maximum limit of NOX emission from a cement kiln is 800 mg Nm−3. The results show that thermal substitution up to 15% for each selected alternative fuel is permissible regarding the NOX emission. In fact, substitution of almond shell up to 25% will keep the NOX concentration on the kiln gas below the limit. Figure 9.12 indicates that using any of the selected agricultural biomass leads to a consistent reduction of SOX in the kiln gas, which agrees with the earlier published results [28]. It is worth mentioning that the tolerable limit of SOX emission around the world is 200–500 mg Nm−3 [66] and in the model results it was below 100 mg Nm−3. This rate of emission is acceptable, though it is higher than the limit of New South Wales (Australia), which is 50 mg Nm−3.

Clinker production may be affected due to introducing alternative fuels to the kiln system and the economic benefits gained by using alternative fuel can be eliminated with the reduced production. Results illustrated in Figure 9.13 indicate that, apart from rice husk, all the other alternative fuels of this study may cause a reduction in clinker production. The modeled kiln capacity was 2200 tonnes day−1 and if allowed up to 2198 tonnes day−1 all the alternative fuels can be used to substitute 15% of thermal energy. The temperature of the flame in the kiln is another property of the kiln which controls the quality of the clinker. Low flame temperature may result in rapid crystallization of clinker, which changes the constituent percentage in the clinker. Since there is no suitable sensor to measure the flame temperature, kiln gas temperatures are often used to estimate the environment inside the kiln. Standard kiln gas temperature varies from 1700 to 2100°C. Figure 9.14 shows the simulated kiln gas temperature while using different alternative fuels. All the alternative fuels, except almond shell, were found to reduce the kiln gas temperature within the allowable limit.


An important parameter in clinker production is free lime, which is usually used to identify how the clinker is burnt [69]. The appropriate free lime level is useful to monitor the kiln process and to achieve considerable thermal energy savings [70]. Figure 9.15 shows the free lime data generated from the simulation. The result shows that only the use of rice husk reduces the free lime content in the clinker. The increases in free lime due to the use of other agricultural biomasses are not substantial and may not affect the clinker quality.

To examine the energy efficiency achieved, the kiln model was used with the substitution rates for the alternative fuels of 20%, 15%, 15%, 12%, and 13.5% for bagasse, almond shell, rice husk, coffee husk, and olive husk, respectively. Those percentage values were determined by the pollutant emission restrictions and daily production of clinker required. After fixing the substitution rate the amount of total fuel feed in the system was reduced until the model generates the results which agree with all the cut-off points. The substitution of any alternative fuel leads to an improvement in terms of energy efficiency. The results obtained from the simulation were summarized in Table 9.6.
Table 9.6
Simulation results for energy efficiency
| Fuels (% of thermal energy) | Kiln gas temperature, °C (simulation results) | Energy requirement, MJ kg−1 clinker (simulation results) | CO2 emission, kg tonne−1 clinker (simulation results) |
| Only coal | 1744 | 3.098 | 194.912 |
| Bagasse 20%+coal 80% | 1724 | 3.037 | 192.6658 |
| Almond shell 15%+coal 85% | 1756 | 3.042 | 188.167 |
| Rice husk 15%+coal 85% | 1723 | 3.018 | 191.6343 |
| Coffee husk 12%+coal 88% | 1729 | 3.006 | 192.3346 |
| Olive husk 13.5%+coal 86.5% | 1731 | 3.026 | 192.7872 |

The results presented in the Table 9.6 show that the selected biomasses are capable of reducing the energy requirement as well as the CO2 emission. Twelve percent substitution of coffee husk could improve the energy efficiency by 3% along with a 1.3% decrease in CO2 emission. Almond shell is capable of reducing the CO2 by 3.5% but with some reduction in total clinker production and a lower flame temperature. From the simulation results it was found that using rice husk for 15% of thermal energy substitution may increase the total clinker production by around 3 tonnes day−1. Along with that it reduces the energy requirement and CO2 emissions by about 2.6% and 1.7% respectively. Kiln gas temperature was found to be low while using rice husk as an alternative fuel and that may be a concern for the clinker quality issue. Bagasse can be used up to 20% of total thermal energy which will lower the CO2 emission by 1.2% and improve the energy efficiency about 2%. Olive husk has the potential to achieve a 2.3% energy efficiency improvement with a 1.1% reduction in emitted CO2.
9.7 Conclusion
The cement industry is considered a major emission source of greenhouse gas (mainly CO2) and acidic gases (mainly NOX and SO2) in the industry sector. Reducing pollutant emissions along with the energy efficiency improvement becomes a challenge for cement manufacturers due to the recent environmental regulations. Alternative fuels offer a feasible option to the manufacturer to mitigate the emissions. Based on the available data from plants and the literature, this chapter presented an Aspen Plus-based cement kiln process model to examine the impact of five agricultural biomasses as alternative fuel. Aspen Plus was used to study the operational parameters which influence the constituents of clinker and kiln gas composition. The model was verified against plant data for the reference case of only coal combustion. A modified kiln model was established to simulate alternative fuel burning in the kiln.
The simulation results obtained showed that thermal energy substitution of 20%, 15%, 15%, 12%, and 13.5% can be done by bagasse, almond shell, rice husk, coffee husk, and olive husk, respectively. Coffee husk was found to gain about 3% of energy efficiency over the reference case of 100% coal burning in spite of a small reduction in the total production of clinker. In contrast, rice husk could increase daily production with a 2.6% reduction in CO2 emission. NOX emission was found to be higher than the reference case for all selected alternative fuels and can be kept below the regulation limit by lowering the substitution rate. SO2 emission was lower for all five agricultural biomasses, while the other alternative fuels, except almond shell, are accountable for a higher discharge of CO. Simulation results shows that the temperature inside the kiln was lower while using the agricultural biomasses with the exception of almond shell. Kiln temperature is one of the key factors which control the quality of the clinker and need to be monitored closely. Results for the amount of free lime present in the clinker show that only rice husk has the ability to reduce it and for the other alternative fuels it might increase by a small amount which may not affect the clinker quality. The proposed model could be useful to study different alternative fuels prior to an experimental study or implementation in a plant, and might be helpful to predict the possible outcomes in terms of pollutant emissions. The proposed model does not predict the heavy metal emissions from the kiln as the ash involved in the process was considered inert as a basic assumption. Future study is recommended for heavy metal emissions and for the quality of clinker.