Residential Building Wall Systems
Energy Efficiency and Carbon Footprint
Fayez Aldawi1,2 and Firoz Alam1, 1School of Aerospace, Mechanical and Manufacturing Engineering, RMIT University, Melbourne, Australia, 2Department of Mechanical Engineering Technology, Yanbu Industrial College, Yanbu Al-Sinaiyah, Saudi Arabia
Rapid urbanization due to global economic development and population growth necessitates the expansion of cities and towns with new buildings and associated energy requirements. The floor space area and volumetric dimensions of modern residential houses are increasing at a constant rate in most developed countries including Australia. Therefore, the energy consumption for ongoing heating and cooling is also increasing. A substantial amount of energy required for heating and cooling is lost through house wall systems. Despite the importance of house wall systems for energy efficiency, little research has been undertaken on energy-efficient house wall systems made of combined thermal masses and insulation materials that can be used and adapted for variable climate conditions with minimal design changes and cost. Hence, this book chapter reports the thermal performance of two house wall systems (one conventional and the other a new design) with single- and double-glazed windows for variable climate conditions in order to develop an optimal energy-efficient house wall system with minimal material modification and cost.
Keywords
House wall systems; thermal performance; energy efficiency; carbon footprint; thermal mass; insulation material
8.1 Introduction
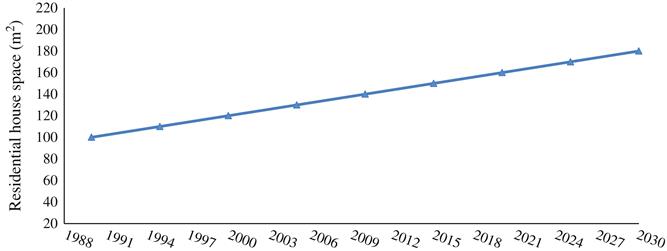
The rising population, economic development and urbanization compel cities and towns to expand with new residential houses, and commercial and public buildings, which require ever-increasing energy leading to more greenhouse gas emission. The residential housing sector alone generates around 30% of greenhouse gas emissions as it uses fossil fuel energy [1–5]. The number of residential houses in Australia is projected to be around 10 million in 2020 compared to 6 million in 1990 [1]. Similarly, the floor space area and volumetric dimensions of modern residential houses are also increasing at a constant rate in most developed countries including Australia [6]. Figure 8.1 illustrates the increment of living space in residential houses in Australia.
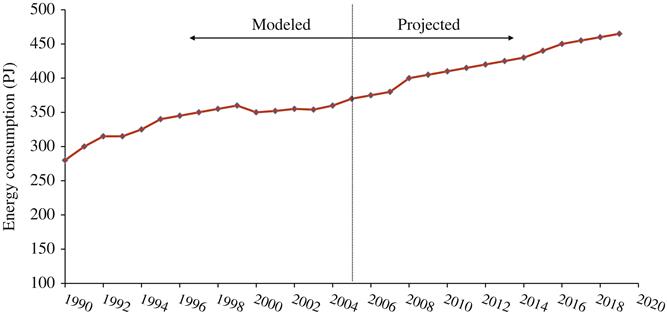
According to a recently published Australian government report, the energy consumption in the residential housing sector will be around 467 PJ in 2020 compared to 299 PJ in 1990, which means that energy demand will increase by over 50%. Figure 8.2 shows a continuous rising energy consumption trend in the Australian housing sector in coming years. The increasing energy consumption leads to greater greenhouse gas emissions [1,7–9].
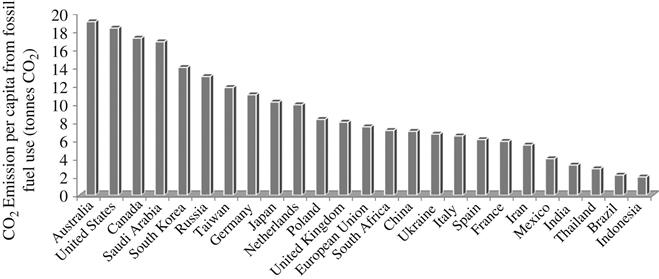
The top three polluting nations (Australia, the United States, and Canada based on their per capita greenhouse gas emissions) generate over 18 tonnes CO2 emission per year per person, which is nearly four times higher than that of India and China [32]. The Australian per capita CO2 emission has been contributed largely by coal-based power generation and inefficient use of energy in the housing sector, which led to around 15% of greenhouse gas emitted from the Australian residential building sector in 2006 [2]. Despite various policies and measures undertaken by the Australian government, the per capita CO2 emission is still very high. The residential housing sector is one of the areas where a notable reduction in energy consumption can be achieved [4,10–12], (see Figure 8.3).
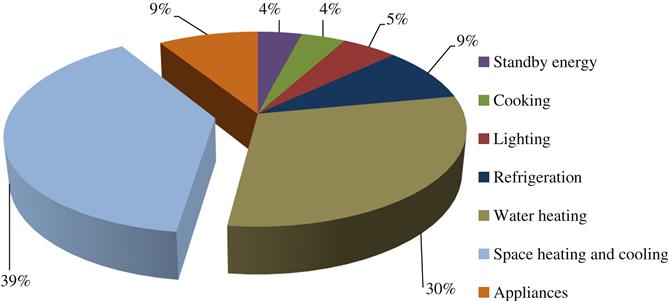
According to Kaynakli [13], building energy consumption accounts for approximately 40% of global energy demands. In Australia, Korea, Turkey, and China, each household consumes around 40% of the total energy used for space heating and cooling [7,14–17]. The second highest energy consumption component is for hot water systems, as shown in Figure 8.4.
In order to develop energy-smart residential buildings, many important aspects such as thermal comfort, thermal insulation, thermal mass, fire resistance, toxicity, sustainability, and economic viability need to be considered.
8.1.1 Thermal Comfort
Thermal comfort is defined as the conditioned temperature satisfying occupants’ feeling with the temperature in their place of living. ANSI/ASHRAE standard 55 defined thermal comfort as the condition of the human body that expresses satisfaction with the thermal environment assessed by subjective evaluation [31]. Heating and cooling play a significant role in human thermal comfort [20] by maintaining a standard temperature in the house.
8.1.2 Thermal Insulation
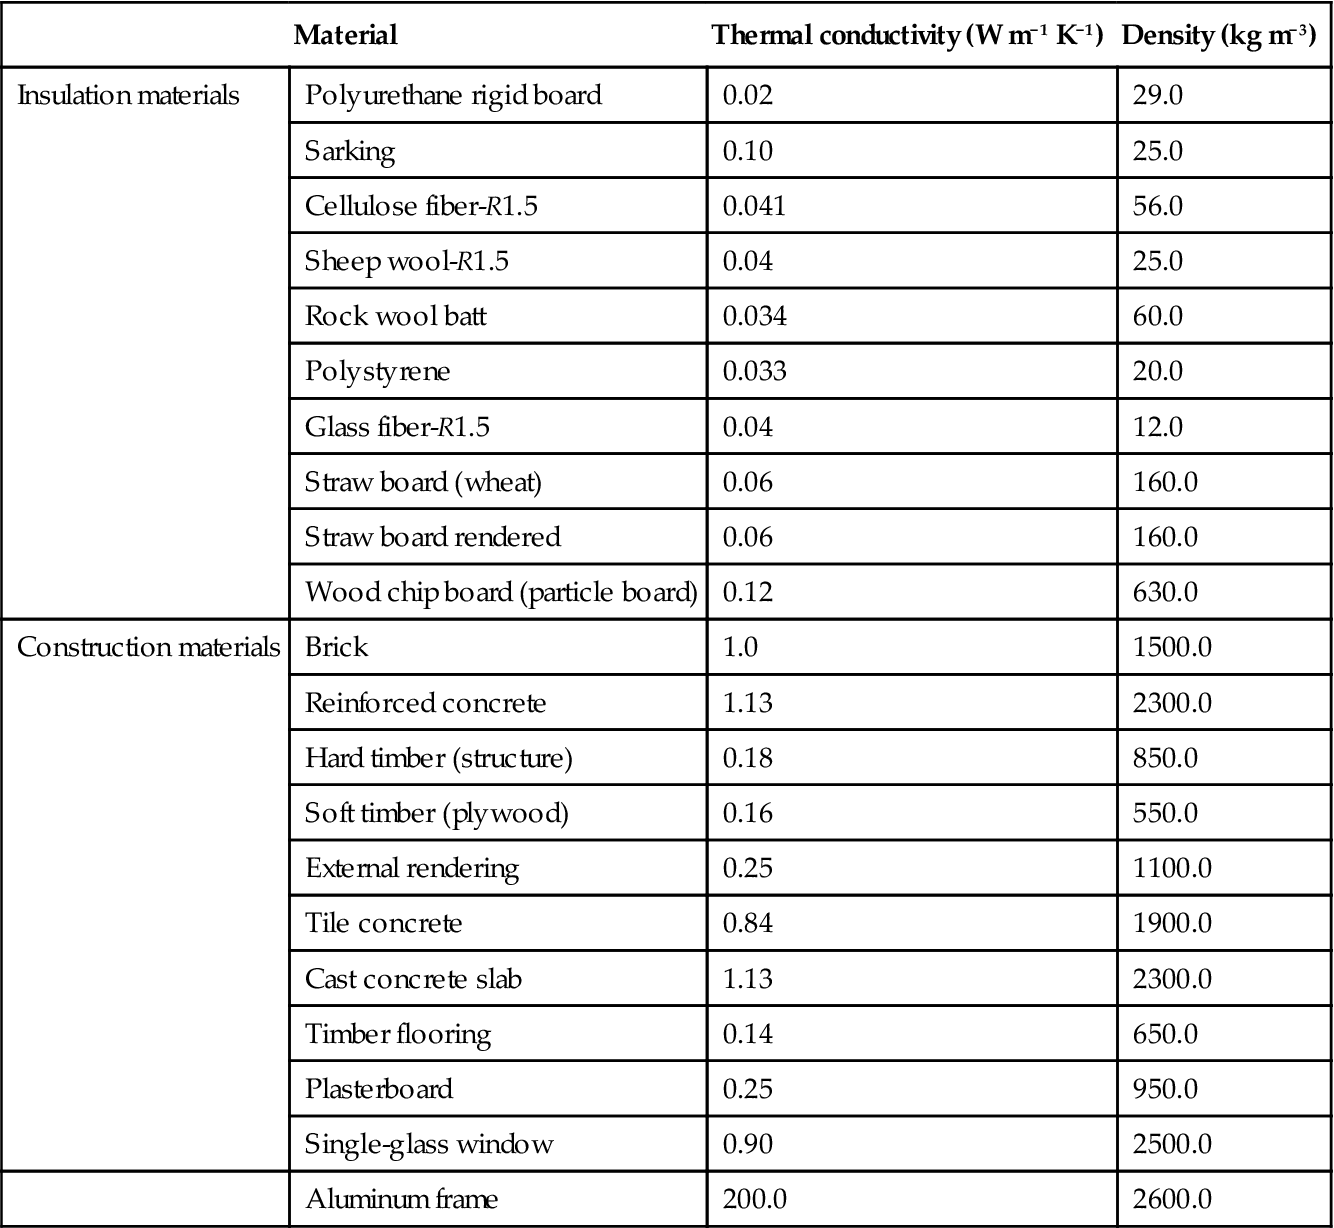
Thermal insulation is used by the building industry to reduce the heat loss or gain through the house envelope (external walls, windows, roofs, foundation, etc.). Thermal insulation creates thermal comfort inside the houses by keeping the temperature in suitable condition. It also creates a barrier between the warm air inside the house and the cold air outside and vice versa. The better this barrier is the less energy the house needs for cooling and heating. Therefore, using insulation materials can assist reducing energy consumption and increase thermal comfort [21]. Table 8.1 gives detailed thermal properties of some popular building materials.
Table 8.1
Building materials thermal properties
| Material | Thermal conductivity (W m−1 K−1) | Density (kg m−3) | |
| Insulation materials | Polyurethane rigid board | 0.02 | 29.0 |
| Sarking | 0.10 | 25.0 | |
| Cellulose fiber-R1.5 | 0.041 | 56.0 | |
| Sheep wool-R1.5 | 0.04 | 25.0 | |
| Rock wool batt | 0.034 | 60.0 | |
| Polystyrene | 0.033 | 20.0 | |
| Glass fiber-R1.5 | 0.04 | 12.0 | |
| Straw board (wheat) | 0.06 | 160.0 | |
| Straw board rendered | 0.06 | 160.0 | |
| Wood chip board (particle board) | 0.12 | 630.0 | |
| Construction materials | Brick | 1.0 | 1500.0 |
| Reinforced concrete | 1.13 | 2300.0 | |
| Hard timber (structure) | 0.18 | 850.0 | |
| Soft timber (plywood) | 0.16 | 550.0 | |
| External rendering | 0.25 | 1100.0 | |
| Tile concrete | 0.84 | 1900.0 | |
| Cast concrete slab | 1.13 | 2300.0 | |
| Timber flooring | 0.14 | 650.0 | |
| Plasterboard | 0.25 | 950.0 | |
| Single-glass window | 0.90 | 2500.0 | |
| Aluminum frame | 200.0 | 2600.0 |
Various types of insulation materials are often hastily incorporated into conventional house construction. They may provide good performance by increasing the energy efficiency in buildings and houses. However, it is necessary to reassess the current construction method and insulation approach due to low thermal performance. An alternative house with higher thermal masses and efficient insulation materials can minimize the problem of heat loss/gain through the house envelope. Insulation materials should be compared in order to specify the most efficient and effective insulating material. These materials include mineral wool, cellulose, fiberglass, plastic fiber, cotton, natural fiber, sheep’s wool, straw, polystyrene, polyisocyanurate, polyurethane, vermiculite, perlite, urea-formaldehyde, cementations foam, phenolic foam and facings insulation. The effectiveness/usefulness of the insulating materials is rated by an R-value. The R-value of an insulating material is the thermal resistance to conductive heat flow. The greater the R-value, the greater the insulating effectiveness and this depends on its thickness, density, and type of insulation.
8.1.3 Lag Time
Lag time can be defined as the time taken by a periodic time wave to penetrate the wall of a building from the outside to the inside. This time is directly proportional to the thickness and resistivity of materials. The more resistive and thicker the material is, the longer it will take for heat waves to penetrate. The time lag should be considered in the design of buildings. For instance, buildings in desert climates should be constructed with material with a time lag of 10–12 h, since during the day temperatures can reach 40°–50° while that during the night may be freezing. If 10–12 h time lag insulation materials are used, then the low night temperatures will reach the inside of the building around midday, thus cooling the air inside, and high temperatures during the day will reach the inside at night, thus warming the inside.
8.1.4 R-Value
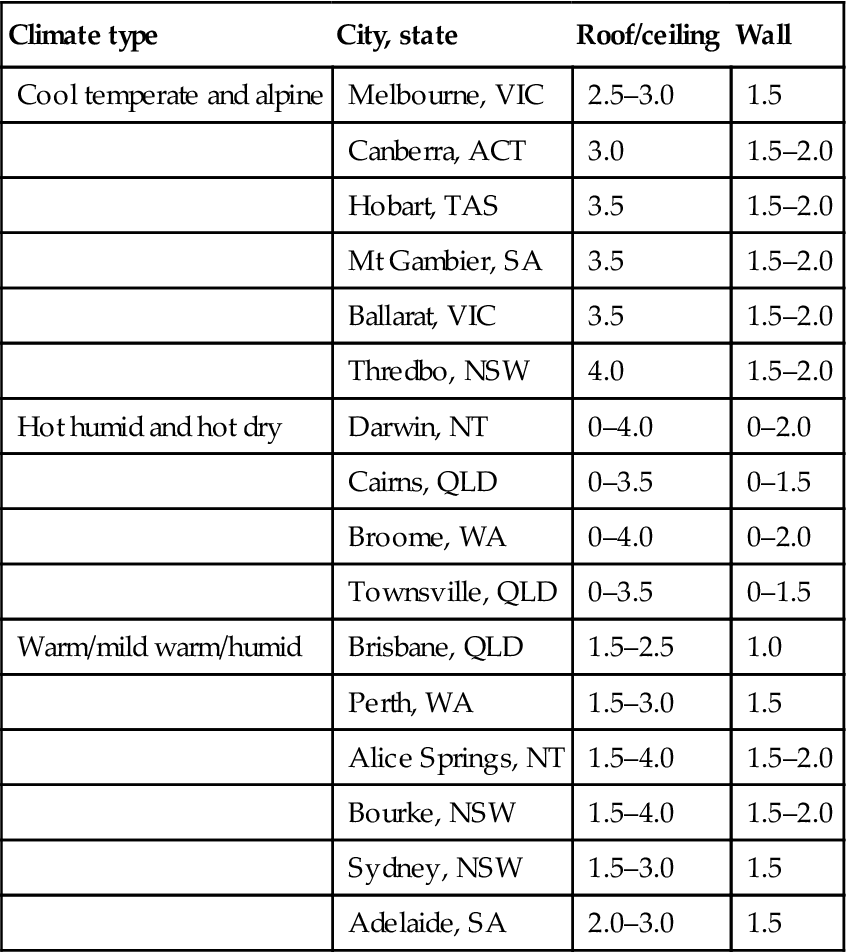
The R-value refers to the ability of insulation material to resist heat flow. This term is mostly used as commercial identification when buying insulation materials. R-values can vary depending on the heat flow direction through the product. Insulation with higher R-value is better for thermal performance. However, it does not mean higher thickness. For example, 50 mm thick polystyrene and 80 mm thick glass wool both have similar R-values (approximately 1.5). R-values are expressed in metric units (m2 K W−1) and they can be calculated for the building components such as wall, floor, ceiling, and roof. The R-values used here for walls, ceilings, and floors are R1.5, R2.5, R2.5, respectively. Based on house location and climate condition, different R-values are recommended by the building standards (for the Australian case, the Building Code of Australia—BCA). The recommended minimum R-value for residential houses located in different cities and territories is shown in Table 8.2.
Table 8.2
Recommended R-value for residential houses in Australia
| Climate type | City, state | Roof/ceiling | Wall |
| Cool temperate and alpine | Melbourne, VIC | 2.5–3.0 | 1.5 |
| Canberra, ACT | 3.0 | 1.5–2.0 | |
| Hobart, TAS | 3.5 | 1.5–2.0 | |
| Mt Gambier, SA | 3.5 | 1.5–2.0 | |
| Ballarat, VIC | 3.5 | 1.5–2.0 | |
| Thredbo, NSW | 4.0 | 1.5–2.0 | |
| Hot humid and hot dry | Darwin, NT | 0–4.0 | 0–2.0 |
| Cairns, QLD | 0–3.5 | 0–1.5 | |
| Broome, WA | 0–4.0 | 0–2.0 | |
| Townsville, QLD | 0–3.5 | 0–1.5 | |
| Warm/mild warm/humid | Brisbane, QLD | 1.5–2.5 | 1.0 |
| Perth, WA | 1.5–3.0 | 1.5 | |
| Alice Springs, NT | 1.5–4.0 | 1.5–2.0 | |
| Bourke, NSW | 1.5–4.0 | 1.5–2.0 | |
| Sydney, NSW | 1.5–3.0 | 1.5 | |
| Adelaide, SA | 2.0–3.0 | 1.5 |
8.1.5 Thermal Masses
High thermal masses are generally high-density building materials such as bricks, concrete, etc. A large amount of heat energy can be stored by high-density materials. High thermal mass materials also take a longer time to release the heat content once the heat source is removed. Conversely, lightweight materials such as timber have low thermal mass, requiring a lower time to release the heat content [15]. Figure 8.5 illustrates the time taken to release the heat through different house thermal masses. Materials with high thermal mass such as double brick layers can absorb and keep heat during the day or night and release it gradually over 6–8 h. However, materials with light weight and low thermal mass such as timber or weatherboard take less time to store or release heat over 2–3 h, and will also lose heat faster [22]. Therefore, the optimal use of thermal masses for the house wall envelope can provide a comfortable house environment and reduce energy consumption for heating and cooling. In this chapter, two types of houses (conventional brick veneer envelope and a new house wall envelope) would be discussed. In order to understand the volumetric heat capacity of various thermal masses of conventional and smart design house wall systems, the total volumetric heat capacity of materials is shown in Tables 8.3 and 8.4 respectively. The tables show that the smart house wall system has higher volumetric heat capacity (17%) compared to the conventional house wall system. This higher heat capacity enables the smart wall system to store heat for longer periods as it has higher thermal mass (reinforced concrete).
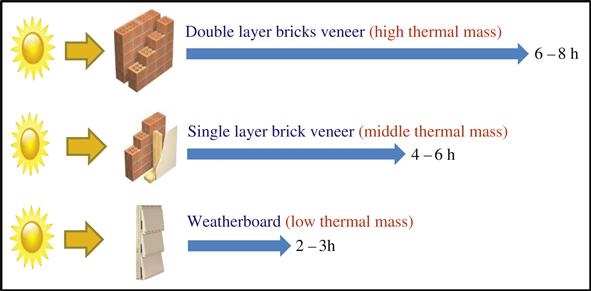
Table 8.3
Volumetric heat capacity of conventional house wall system
| Material | Volume/unit area of wall surface | Volumetric heat capacity (kJ m−3 K−1) | Specific heat per layer (kJ m−2 K−1) |
| Brick veneer | 0.110 | 1400.0 | 154.000 |
| Air cavity | 0.050 | 0.001 | 0.00005 |
| Sarking | 0.005 | 10.6 | 0.053 |
| Timber | 0.090 | 1057.0 | 95.130 |
| Plaster board | 0.010 | 924.0 | 9.240 |
| Total | 0.265 | 258.420 |
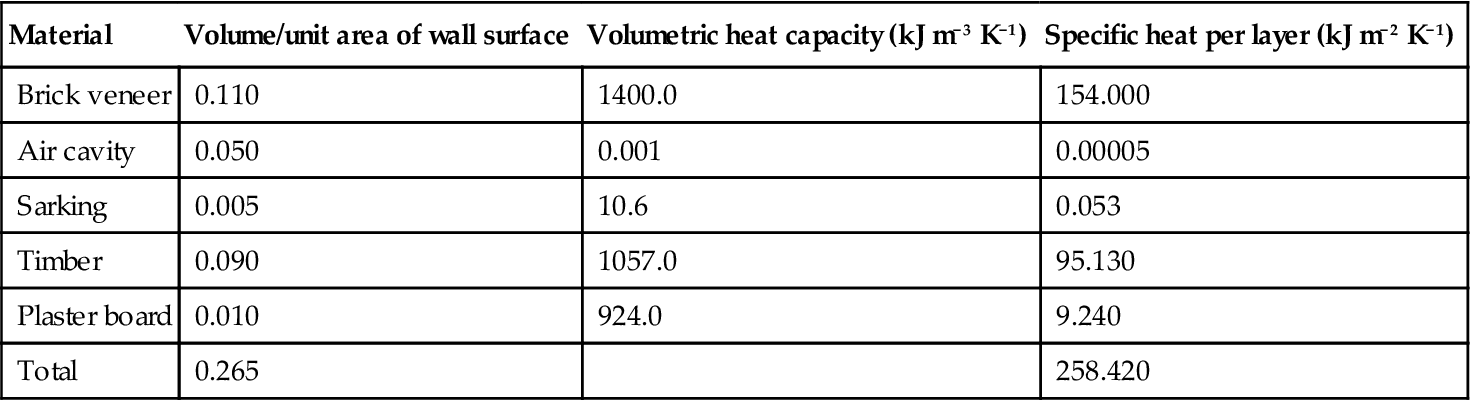
Volumetric heat capacity of conventional wall system=258.420/0.265=975.17 kJ m−3 K−1.
Table 8.4
Volumetric heat capacity of a smart house wall system
| Material | Volume/unit area of wall surface | Volumetric heat capacity (kJ m−3 K−1) | Specific heat per layer (kJ m−2 K−1) |
| Render | 0.010 | 1200.0 | 12.00 |
| Polystyrene | 0.059 | 5.5 | 0.32 |
| Reinforced concrete | 0.150 | 2112.0 | 316.80 |
| Polystyrene | 0.059 | 5.5 | 0.32 |
| Plaster board | 0.010 | 924.0 | 9.24 |
| Total | 0.288 | 338.68 |
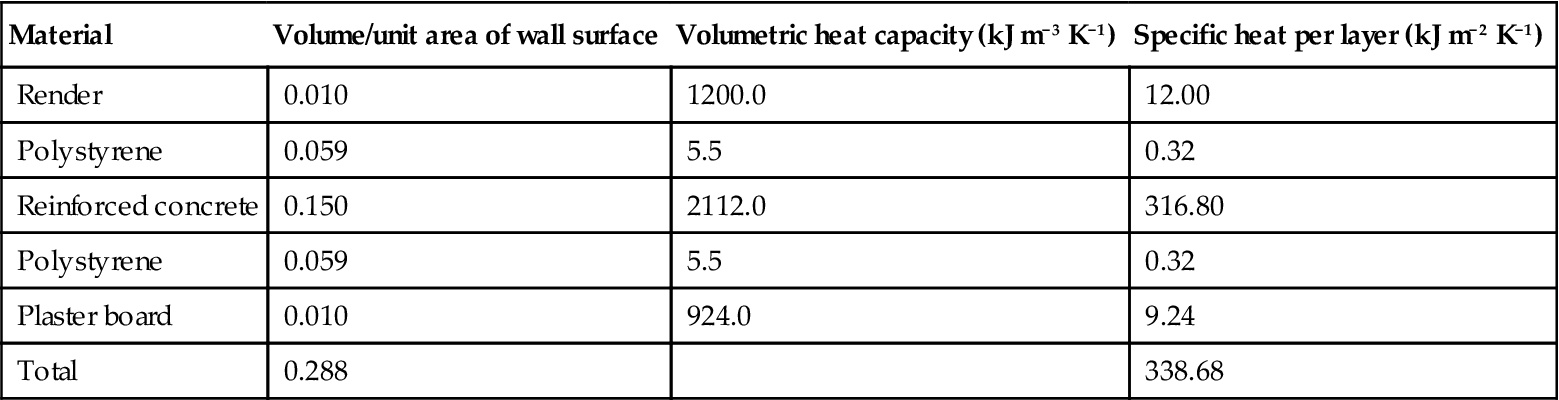
Volumetric heat capacity of new wall system=338.68/0.288=1176 kJ m−3 K−1.
8.2 Design Patterns of Australian Houses
Over the last two centuries, Australia’s residential landscape has contained a rich mix of different house architectural styles. Building in Australia can be divided into two main categories: residential and nonresidential (commercial and public) buildings. For Australian residential houses, there are four types of external house walls in use. These are: (i) timber weatherboard, (ii) fibro cement weatherboard, (iii) single brick veneer, and (iv) double brick veneer house wall.
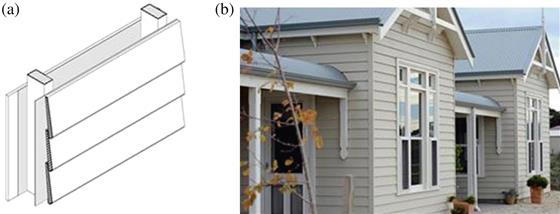
8.2.1 Timber Weatherboard House
Timber weatherboard houses were a general housing choice in the nineteenth and early twentieth centuries. The external wall is made of cladding timber with plasterboard for internal walls as shown in Figure 8.6. Today, timber weatherboard houses are rarely built due to their lower energy performance and higher fire hazard risk.
8.2.2 Fibro Cement Weatherboard House
Fibro cement cladding house construction is quite similar to that of weatherboard houses. Fibro cement is made of composite material (cement, cellulose fibers, and ground sand). Nowadays this house wall is becoming a replacement for timber weatherboard. The use of fibro cement as an external façade material has grown for both commercial and residential buildings. The advantage of this construction is that it is lightweight and easier to build. A typical fibro cement house is shown in Figure 8.7. This type of house generally possesses lower thermal mass.
8.2.3 Double Brick Veneer House
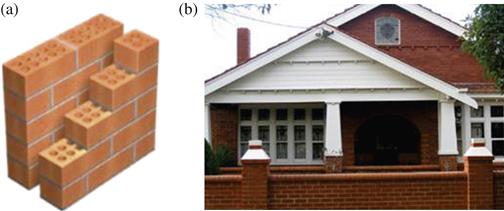
In the 1900s, the Australian state of Victoria introduced the first identifiable brick veneer house wall, built in Geelong. The brick veneer house walls started as a double brick veneer wall. However, by 1950, double brick construction had almost been replaced by brick veneer in Victoria. Currently, brick veneer walls have become one of the most common house construction types in Australia [23]. A typical double brick house is illustrated in Figure 8.8. This type of house has generally higher thermal mass.
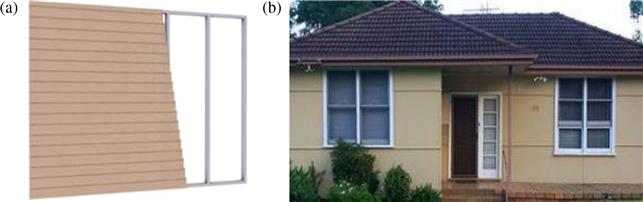
8.2.4 Single Brick Veneer House (Conventional House)
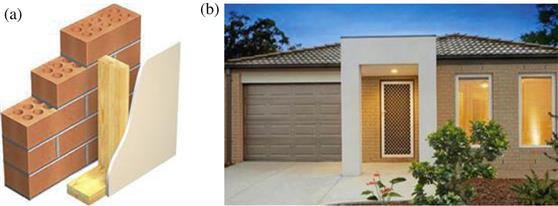
A brick veneer house wall requires less construction materials compared to a double brick wall. The single brick veneer wall is also less expensive. A brick veneer wall is thus lighter, and it can reduce the labor and material transport costs [24]. The maintenance costs are minimal for a single brick veneer house wall. Brick veneer also has a lesser tendency to shift or crack compared to a double brick wall. A typical single brick house is depicted in Figure 8.9. A single brick house possesses lower thermal mass compared to a double brick house.
The brick veneer wall does not increase the structural integrity of a house because it is installed as a separate outer layer. When cracks or openings develop over time, brick veneer can suffer potential water damage. Water can enter through the cracks or openings between the bricks. Most of the brick veneer is installed on the outside of a timber frame. The timber may become rotted by water which is trapped between the brick and the timber frame. In extreme cases, the rotting timber frame can cause structural failure to the house [23,25]. As most residential houses are made of single brick veneer, it is the largest energy consumer in developed nations, including Australia. More than 35% of total heat escapes through the poorly insulated house envelope [23]. Some consider the brick wall as decorative and nonstructural as it is applied to the outside of pre-existing walls [26].
8.3 House Wall Systems
In this chapter, a three-bedroom house with a conventional house wall system (brick veneer) and a new house wall system have been selected for thermal performance study. The floor area of the house is 100.2 m2 and the total physical volume is approximately 460 m3. The house consists of a living or dining area, kitchen, three bedrooms, bathroom, and toilet. The construction materials were selected based on the standard of BCA. The house flooring area details are shown in Table 8.5. The floor foundation is an H-class reinforced 110 mm thick concrete slab. The foundation is kept the same for both house wall systems.
Table 8.5
| House description | Dimension | Unit |
| Entry area | 3.8 | m2 |
| Rooms corridor area | 3.6 | m2 |
| Kitchen area | 14.2 | m2 |
| Bed 1 area | 9.1 | m2 |
| Bed 2 area | 10.0 | m2 |
| Bed 3 area | 10.2 | m2 |
| Bath area | 6.2 | m2 |
| Toilet area | 3.8 | m2 |
| Laundry area | 5.5 | m2 |
| Dining and living area | 36.5 | m2 |
| Landing and steps area | 2.5 | m2 |
| Alfresco area | 7.2 | m2 |
| Total floor area excluding alfresco, landing | 100.2 | m2 |
| Total tiled roof area | 125.0 | m2 |
| Total steel deck roof area | 23.0 | m2 |
| Windows area | 32.9 | m2 |
| External wall perimeter length | 47.0 | m |
| External walls area (total) | 112.0 | m2 |
| Internal walls area | 78.5 | m2 |
| External door area | 1.8 | m2 |
| Wall height | 2.4 | m |
| Roof space volume | 143.0 | m3 |
| Condition floor area | 80.0 | m2 |
| Total tiled roof area | 125.0 | m2 |
| Total area | 110.0 | m2 |
| External walls area (excludes windows) | 80.7 | m2 |
The house has two external doors (front and rear). The main front door is made of solid wood, while the interior doors are made of hollow wood panels. The dimensions of the main door are 2040 mm high×820 mm wide×0.035 mm thick. The inner doors are made of two layers (10 mm) of plaster board and an air gap in between (90 mm).
The Australian new residential house construction uses timber in roof structures with terracotta/concrete tiles. The roof slope angle is 20° as per the BCA. The minimum BCA requirement for roof insulation is R2.5. In Australia, the most common insulation material used for roof insulation is glass wool batts. After installing the insulation material, a 10 mm plaster board is used for ceiling the roof. To have equal composition for all wall systems, the roof and ceiling structure have been kept unaltered. Standard-size windows were used in this study as outlined in the BCA. This window is single-glazed with a base frame made of aluminum. The standard size of the window is 1800 mm×1200 mm and 3 mm thickness. In this study, single-glazed and double-glazed windows were used. The overall heat transfer coefficients (U) of single- and double-glazed windows are 6.35 and 4.95 W m−2 per °C, respectively. No shading effects due to trees or other surrounding buildings are included in this study. The windows structure is kept the same for all house wall systems.
8.3.1 House Wall Configuration
As mentioned previously, two house wall systems were selected for this study: (i) the brick veneer house wall system as conventional (standard) and (ii) the new house wall system. Both house wall systems (conventional and new house) consist of the same internal walls, roof, foundations, and windows. The change was only in the external wall configuration. The standard height of house walls is 2.5 m in accordance with the BCA.
8.3.2 Conventional House Wall
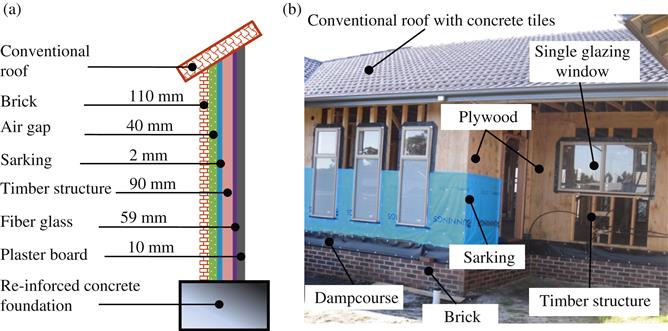
The external wall of the conventional house consists of 110 mm external brick, 40 mm air gap, and 90 mm timber frame structure. The sarking (waterproof but vapor-permeable flexible sheet) material is attached around the external structure of the timber with a 2 mm thickness. Fiberglass insulation with thickness of 59 mm is inserted between the external timber structure and the internal plaster board (10 mm thick). The schematic of the brick veneer house wall is shown in Figure 8.10.
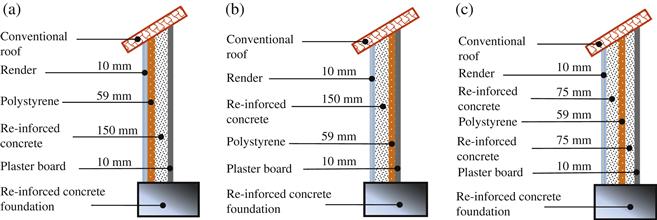
The major change in both conventional and new house wall systems was in external walls only, whereas other house elements were kept unchanged. With the new house wall, different construction methods and insulation materials were used to investigate the house wall thermal performance in order to achieve an optimum house wall system. A total of 15 designs with various sequence and insulation materials has been considered. Three such designs are shown in Figure 8.11. Details about all 15 designs can be found in [27]. Design 2 consists of reinforced concrete and a single-sided insulation panel. The insulation panel is polystyrene, placed on the outside of the house wall. The system is made of 10 mm exterior render put on the outside of the wall, 59 mm polystyrene, 150 mm reinforced concrete, and 10 mm plaster board placed on the inside of the house wall. Design 3 has similar construction materials as Design 2 with a change in construction material sequence only. The insulation panel is placed on the inside of the house wall. Design 4 consists of single insulation with double-sided reinforced concrete panels. The wall is made of 10 mm render, 150 mm (75 and 75 mm) reinforced concrete panel, 59 mm polystyrene as insulation materials and 10 mm plaster board placed on the inside of the house wall.
8.4 Energy Star Rating and Thermal Performance Modeling Tools
The Australian government’s “National Greenhouse Strategy” established a range of measures to determine and reduce future greenhouse gas emissions [2]. To reduce the energy required in cooling or heating in residential houses, the envelope of house walls should be improved. As mentioned previously, around 40% of the total energy used in Australian residential houses is consumed in space heating and/or cooling. The government of Australia has introduced a star-rating energy system for newly built Australian residential houses for space heating and cooling (Drogemuller et al., 1999). Several energy simulation software packages have been developed to estimate the energy required for space heating and/or cooling. In 2003, rating methods were approved for a minimum thermal performance of four stars. In 2006, the performance requirement increased to five stars and progressively increased to six stars in 2010. This move from four to five stars has presented a challenge for the building sector to find ways to reduce house heating and cooling energy. There are several commercially developed energy simulation software packages currently available in Australia. The first-generation simulation energy-rating tools were Green Star, ABGR, NatHERS, FirstRate, BASIX, BERS, and NABERS. However, these software packages cannot be used universally for all climate conditions due to the unavailability of data for local climates, construction materials, and house design patterns. At present, only three second-generation software systems (AccuRate, FirstRate5, and BERS Pro) are nationally accredited software and they are widely used for the evaluation of thermal performance of residential houses in Australia.
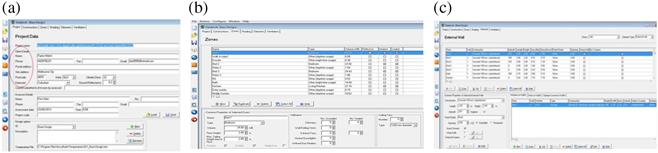
The AccuRate software is the second-generation software of Nationwide House Energy Rating Scheme (NatHERS) developed by the Commonwealth Scientific and Industrial Research Organisation (CSIRO), Australia, and was released in 2005. It is a rating tool that assigns a star rating to a residential building based on its calculated annual heating and cooling energy requirements. The efficiency of heating and cooling equipment is not taken into account. The software can be used with most house designs, whether detached or semi-detached, a unit, townhouse, or apartment. In the software, the whole house can be subdivided into a number of zones, each of which includes multiple elements, such as floor, roof, ceiling, walls, and windows. Each house element is considered to be composed of a series of homogeneous structures. The software has an in-built library of commonly used building materials, their thermal properties and the climate data for Australia (e.g., 69 micro-climate zones). The AccuRate data library is mainly classified into three sections: construction materials, insulation materials, and air gap insulation. The construction materials include timber, brick, steel, and reinforced concrete. The insulation materials include polystyrene, cellulose fiber, rock wool batt, sheep wool, straw board, rendered straw bale, glass fiber, wood chipboard, and polyurethane rigid foam. The air gap properties are given for ranges of thicknesses (13–16, 17–30, 31–65 and >65 mm), emissivity, and inclinations. With respect to emissivity, the key parameter is the effective emissivity (E). All materials used in AccuRate are fully described by a thermal resistance and thermal capacitance. The units of thermal resistance are m2 K W−1. The thermal capacitance is the product of the density and specific heat, and its units in the material tables are kJ m−3 K−1. Some important aspects of occupant behavior are taken into account (e.g., heating and cooling operation hours, thermostat settings of heating and cooling, window operation, and other openings to increase ventilation, adjustable house elements including walls, roof, ground, window, shading, and ceiling). As described earlier, the AccuRate software is widely used and accepted for the modeling of house energy performances in all Australian states and territories [28]. It determines the heating and cooling energy requirements hourly over a period of 1 year, using 1 year of typical weather data appropriate for the location. The software requires detailed information about the house, such as orientation, construction type, insulation levels, window size and type, window orientation, shading, overshadowing, and ventilation [28]. In this study, the AccuRate computational modeling has been used to investigate the thermal performance of house wall systems. Figure 8.12 illustrates the screenshot of the data input feature in AccuRate thermal performance modeling software.
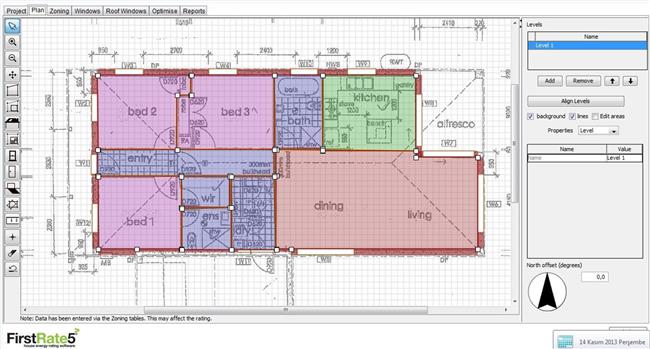
The second popular software package is FirstRate5. It was developed by the Department of Sustainability of the State Government of Victoria, Australia. It is an improved version of the first-generation FirstRate. In FirstRate5, the user is required to enter the house plan at the sketch design stage instead of dimensions to provide a simple and quick method to estimate energy need. This quick method provides various design features, such as building materials, windows, insulation materials, and house orientation to help measure the energy efficiency of the house. FirstRate5 can be used in Victoria as well as the Australian Capital Territory (ACT), Western Australia, and South Australia. The output of selected house materials and designs provides an overall rating of 0–10 stars and energy required for cooling and heating in MJ m−2 per annum. Figure 8.13 shows the house plan view used in this study in FirstRate5.
The other software BERS Pro uses the same mathematical engine as AccuRate. BERS Pro needs the same level of house information and details as AccuRate and FirstRate5 software but the entry data are in a graphical interface similar to FirstRate5. It is used to estimate the energy level required for heating and cooling. This software is more widely used in Queensland due to that state’s hot humid climate data bank. BERS Pro is an updated version of BERS which was developed by Solar Logic in Brisbane, Australia.
Both AccuRate and FirstRate5 provide an energy rating on a scale of 0–10. A star value ranging from 0–10 stars is calculated on the estimated annual energy load for each climate zone and their thermal dwelling properties. The higher-scale rate is better for energy saving and consumption. Table 8.6 shows the total energy required against the star rating value for major Australian cities and towns.
Table 8.6
Total energy required vs. star rate for major Australian cities and towns
| Total energy required (MJ m−2 per annum) vs. stars rate | ||||||||||||||||||||
| City | 0.5 | 1 | 1.5 | 2 | 2.5 | 3 | 3.5 | 4 | 4.5 | 5 | 5.5 | 6 | 6.5 | 7 | 7.5 | 8 | 8.5 | 9 | 9.5 | 10 |
| Melbourne | 676 | 559 | 462 | 384 | 321 | 271 | 230 | 198 | 171 | 149 | 131 | 114 | 98 | 83 | 68 | 54 | 39 | 25 | 13 | 2 |
| Brisbane | 245 | 203 | 167 | 139 | 116 | 97 | 83 | 71 | 62 | 55 | 48 | 43 | 38 | 34 | 30 | 25 | 21 | 17 | 13 | 10 |
| Darwin | 853 | 773 | 706 | 648 | 598 | 555 | 516 | 480 | 446 | 413 | 381 | 349 | 317 | 285 | 253 | 222 | 192 | 164 | 140 | 119 |
| Hobart | 876 | 723 | 598 | 498 | 417 | 354 | 303 | 262 | 229 | 202 | 177 | 155 | 134 | 113 | 92 | 71 | 51 | 31 | 14 | 0 |
| Adelaide | 584 | 480 | 394 | 325 | 270 | 227 | 192 | 165 | 143 | 125 | 109 | 96 | 83 | 70 | 58 | 46 | 33 | 22 | 11 | 3 |
| Sydney | 286 | 230 | 184 | 148 | 120 | 98 | 81 | 68 | 58 | 50 | 44 | 39 | 35 | 30 | 26 | 22 | 17 | 13 | 9 | 6 |
| Canberra | 957 | 792 | 657 | 547 | 458 | 387 | 330 | 284 | 247 | 216 | 189 | 165 | 142 | 120 | 99 | 77 | 56 | 35 | 17 | 2 |
| Rockhampton | 344 | 295 | 255 | 222 | 194 | 171 | 152 | 136 | 122 | 110 | 99 | 90 | 80 | 71 | 63 | 54 | 46 | 38 | 31 | 24 |
| Perth | 483 | 387 | 311 | 251 | 204 | 167 | 139 | 118 | 102 | 89 | 79 | 70 | 61 | 52 | 44 | 34 | 25 | 17 | 9 | 4 |
| Alice Springs | 681 | 562 | 464 | 385 | 321 | 269 | 228 | 196 | 170 | 148 | 130 | 113 | 99 | 84 | 70 | 56 | 43 | 29 | 17 | 7 |
| Broome | 732 | 652 | 585 | 531 | 486 | 448 | 416 | 387 | 360 | 335 | 310 | 285 | 260 | 234 | 208 | 182 | 157 | 134 | 115 | 99 |
| Cairns | 330 | 302 | 276 | 253 | 232 | 214 | 197 | 181 | 167 | 153 | 140 | 128 | 117 | 105 | 94 | 84 | 74 | 64 | 56 | 48 |
| Townsville | 337 | 309 | 283 | 259 | 238 | 218 | 200 | 183 | 168 | 153 | 140 | 127 | 114 | 103 | 92 | 81 | 71 | 61 | 52 | 44 |
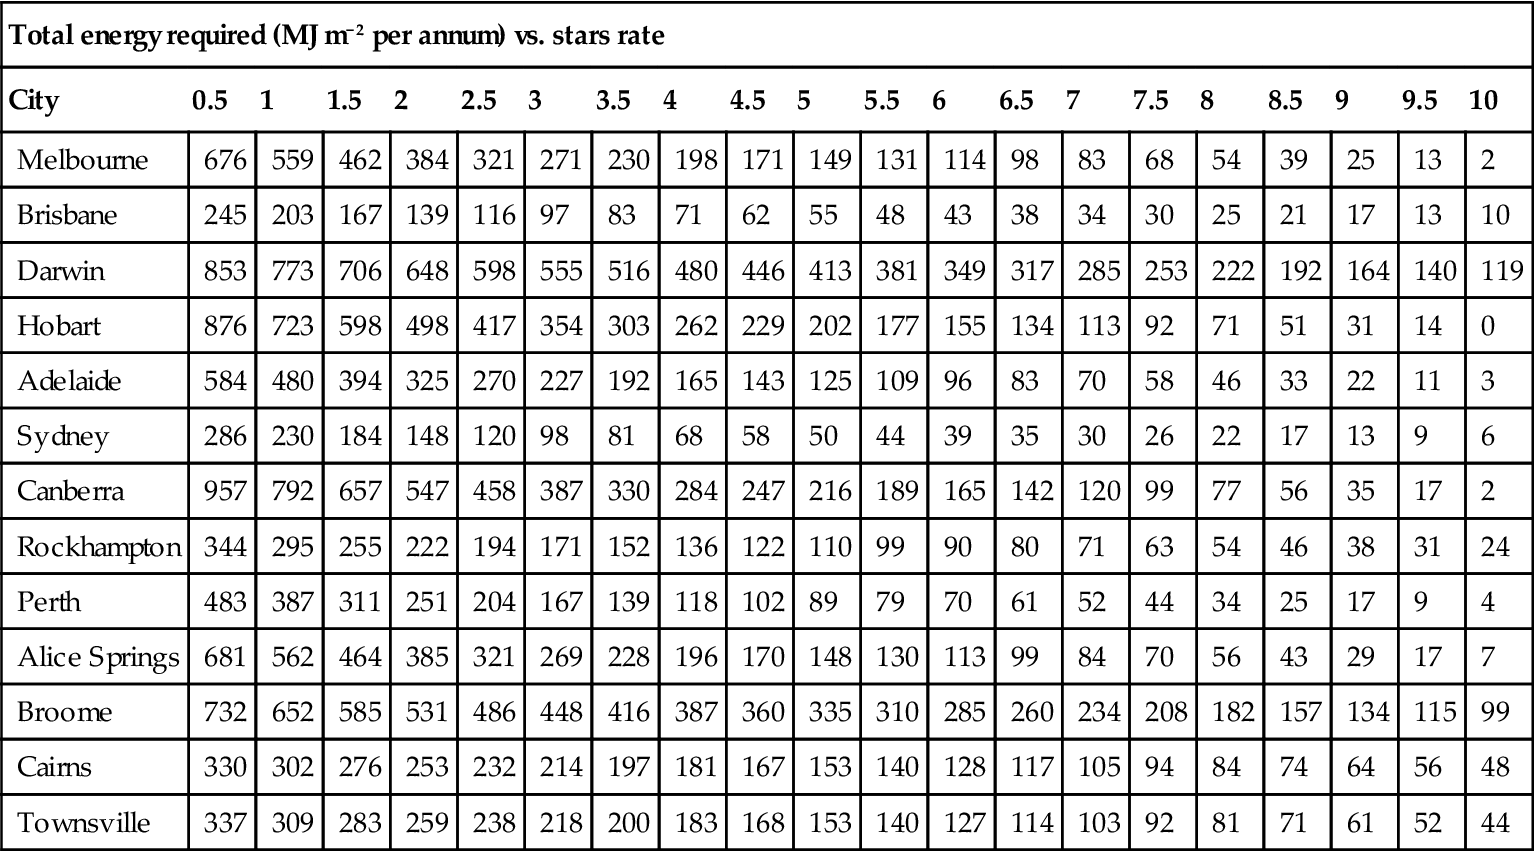
According to Australian state and territory government regulations since 2008, all new houses must comply with certain minimum energy requirements on a scale of 0–10 stars for heating and cooling [1]. For example, houses in Melbourne are to be rated for six stars, so they should not consume more energy than 114 MJ m−2 per year for ongoing space heating and cooling. A higher star rating indicates more efficient energy consumption for heating and cooling as shown in Table 8.6.
8.5 Results
Using AccuRate thermal modeling software, the thermal performances for all house wall systems (conventional and new designs) were investigated. The results show the total energy requirement as well as the energy star rating for conventional and new house wall systems. Thirteen major cities and towns including all states’ capitals located in varied climatic conditions across Australia were used. The findings are discussed in following sub-sections.
8.5.1 Conventional House Wall (Benchmark)
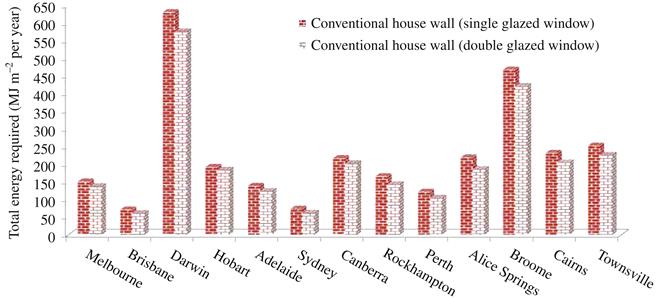
The energy requirement for ongoing heating and cooling, star energy rating and relative improvement for the conventional single brick veneer house with single- and double-glazed windows is illustrated in Figure 8.14. For single- and double-glazed windows, the conventional house wall system in Darwin and Broome requires the highest energy for on-going heating and cooling (MJ m−2 per year), while Brisbane and Sydney require the lowest energy for the same purpose. A similar energy requirement for heating and cooling is also noted for Cairns, Alice Springs, Townsville, Hobart, and Canberra. The energy needs for Melbourne and Rockhampton are in-between. The conventional house wall system with double-glazed windows requires less energy for all 13 cities and towns. The improvement of the conventional house walls with double-glazed windows is between 9% and 16.5%.
8.5.2 New House Wall
Although 15 new wall systems (Design 1 to Design 15) have been considered, the results for Designs 2, 3, and 4 are discussed here.
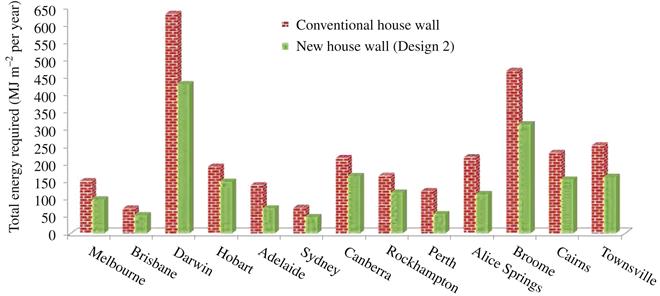
Design 2: New House Wall with One Panel of Polystyrene Insulation—(Outer Position)
The energy requirement for on-going heating and cooling, star energy rating and relative improvement for Design 2 is shown in Figure 8.15. Design 2 requires less energy for all 13 selected cities and towns. The highest reduction in energy requirement is noted for Perth (54.3%), followed by Alice Springs (48.5%) and Adelaide (47.9%). The cities of Melbourne, Sydney, Darwin, Broome, Townsville, and Cairns have achieved energy savings of 30–40%, while Brisbane, Canberra, Rockhampton, and Hobart achieved 20–30%.
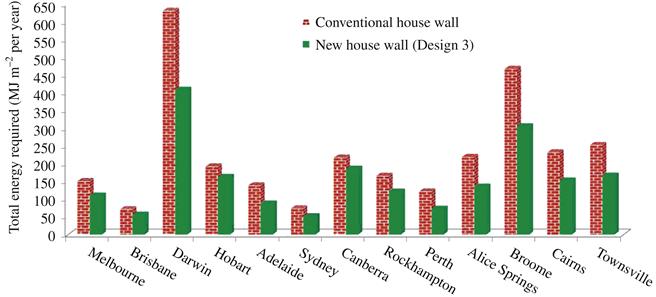
Design 3: New House Wall with One Panel of Polystyrene Insulation—(Inner Position)
The thermal performance for Design 3 is depicted in Figure 8.16. Design 3 requires less energy for all 13 selected cities and towns. The highest reduction in energy requirement is noted for Perth (40.8%), followed by Alice Springs (38.4%), and Adelaide (37%). Like Design 2, Design 3 for Melbourne, Sydney, Darwin, Broome, Townsville, and Cairns has achieved energy savings of 30–40%, while for Brisbane, Canberra, Rockhampton, and Hobart the figure is 20–30%.
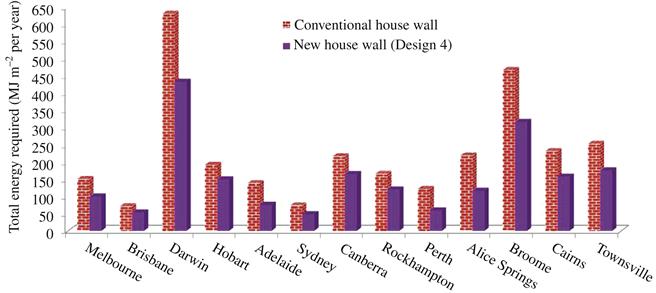
Design 4: New House Wall with Two Half Concrete Panels and One Panel of Polystyrene Insulation In-Between
The on-going heating and cooling energy requirement, star energy rating, and relative improvement for Design 4 are illustrated in Figure 8.17. Design 4 requires less energy for all 13 selected cities and towns. The highest reduction in energy requirement is noted for Perth (51.8%), followed by Alice Springs (46.7%), and Adelaide (45.7%). The cities of Melbourne, Sydney, Darwin, Broome, Townsville, and Cairns have achieved energy savings of 30–40%, while Brisbane, Canberra, Rockhampton, and Hobart achieved 20–30%.
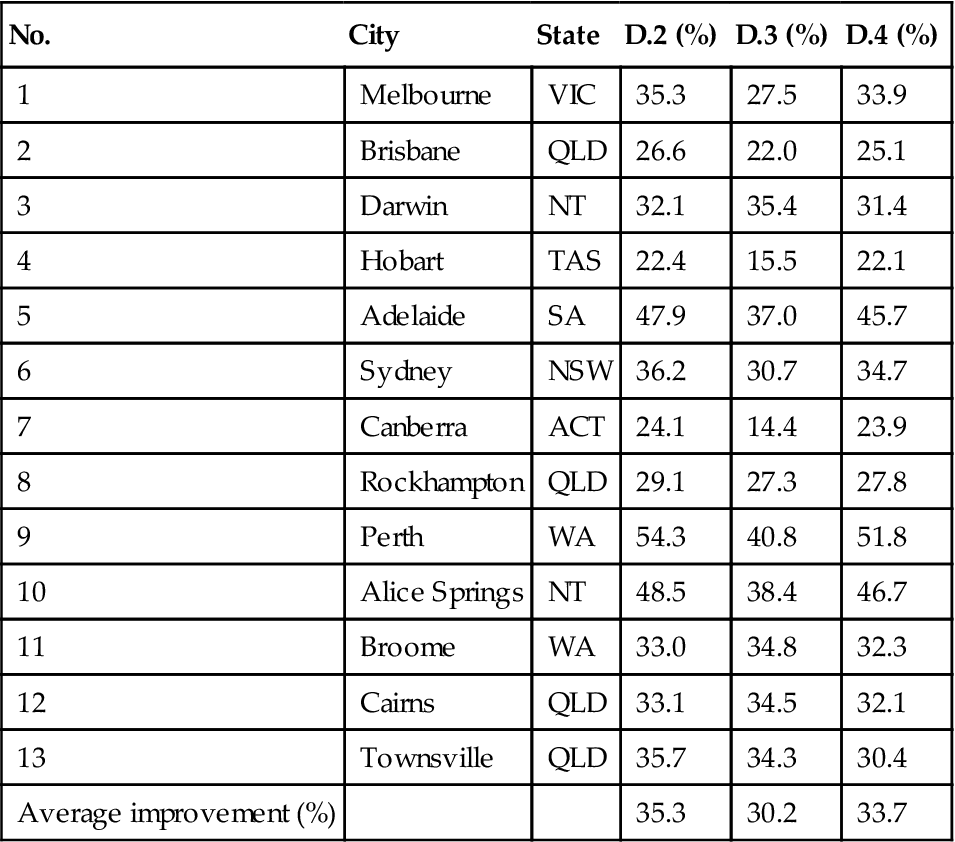
All new houses wall systems require less energy for on-going heating and cooling in all 13 selected cities/towns compared to the conventional house wall system. In general, the highest reduction in energy requirement (35.3%) is noted for house Design 2 followed by house Designs 4 (33.7%) and 3 (30.2%). Each city has an optimum house design based on lower energy consumption, as shown in Table 8.7. For example, Design 2 provides the highest energy savings for Perth (54.3%) and the same design for Melbourne offers 35.3%.
Table 8.7
Average improvement of new house wall designs and energy saving
| No. | City | State | D.2 (%) | D.3 (%) | D.4 (%) |
| 1 | Melbourne | VIC | 35.3 | 27.5 | 33.9 |
| 2 | Brisbane | QLD | 26.6 | 22.0 | 25.1 |
| 3 | Darwin | NT | 32.1 | 35.4 | 31.4 |
| 4 | Hobart | TAS | 22.4 | 15.5 | 22.1 |
| 5 | Adelaide | SA | 47.9 | 37.0 | 45.7 |
| 6 | Sydney | NSW | 36.2 | 30.7 | 34.7 |
| 7 | Canberra | ACT | 24.1 | 14.4 | 23.9 |
| 8 | Rockhampton | QLD | 29.1 | 27.3 | 27.8 |
| 9 | Perth | WA | 54.3 | 40.8 | 51.8 |
| 10 | Alice Springs | NT | 48.5 | 38.4 | 46.7 |
| 11 | Broome | WA | 33.0 | 34.8 | 32.3 |
| 12 | Cairns | QLD | 33.1 | 34.5 | 32.1 |
| 13 | Townsville | QLD | 35.7 | 34.3 | 30.4 |
| Average improvement (%) | 35.3 | 30.2 | 33.7 |
8.5.3 Inner and Outer Insulation Positions
The inner and outer insulation materials used in this study are polystyrene, cellulose fiber, rock wool batt, sheep wool, straw board, rendered straw bale, glass fiber, wood chipboard, and polyurethane rigid foam. Installing those insulation materials on the house wall panels of the interior and exterior walls effectively can obstruct heat escape or transmission from the house.
The conventional house wall system has the highest energy consumption. In the inner and outer insulation position of the new house wall systems, polyurethane rigid foam is known to produce the lowest energy consumption for all houses located in 13 cities/towns compared to the conventional house wall system, as shown in Figures 8.14–8.17.
A higher level of energy savings is achieved by the new house wall systems with insulation materials of polystyrene, cellulose fiber, rock wool bats, sheep wool, and glass fiber. Further, the insulation of rendered straw bale, straw board, and wood chipboard also reduces the energy consumption compared to the conventional house wall system (results not shown here).
8.6 Discussion
The thermal performance of 15 new house wall systems (Design 1 to Design 15) and a conventional house wall system were undertaken by computational modeling. The thermal performance behavior of all 16 house wall systems was evaluated for 13 major cities/towns across Australia, encompassing cool, moderate, subtropical, and tropical climate conditions for on-going heating and cooling. Based on thermal performance analysis, all house wall systems were ranked and benchmarked against the conventional house wall system. Both synthetic and natural insulation materials were used in the thermal modeling. The data clearly show that synthetic insulation materials, such as polyurethane and polystyrene, outperformed fiberglass (synthetic) and the natural insulation material, strawboard. However, the toxicity of polyurethane is so high that it may pose a health hazard to house occupants during a fire. Therefore, the next better-performing insulation materials, polystyrene (synthetic) and strawboard (natural), provide better options for application. In order to validate the modeling data, a scale model house with fiberglass, polystyrene, polyurethane, and strawboard insulation materials was experimentally investigated. The model house was exposed to Melbourne’s moderate climate conditions and was monitored and evaluated for thermal performance. As Melbourne residential houses need over 85% of their total energy for heating only (determined by undertaking analysis of hourly temperature data for 3 years), the model’s thermal performance was investigated for heating only. The experimental data demonstrate a good agreement with the modeling data (comparison data are not shown here, however, they can be found in [27]). The variation between experimental and computational modeling findings is lower than 10%.
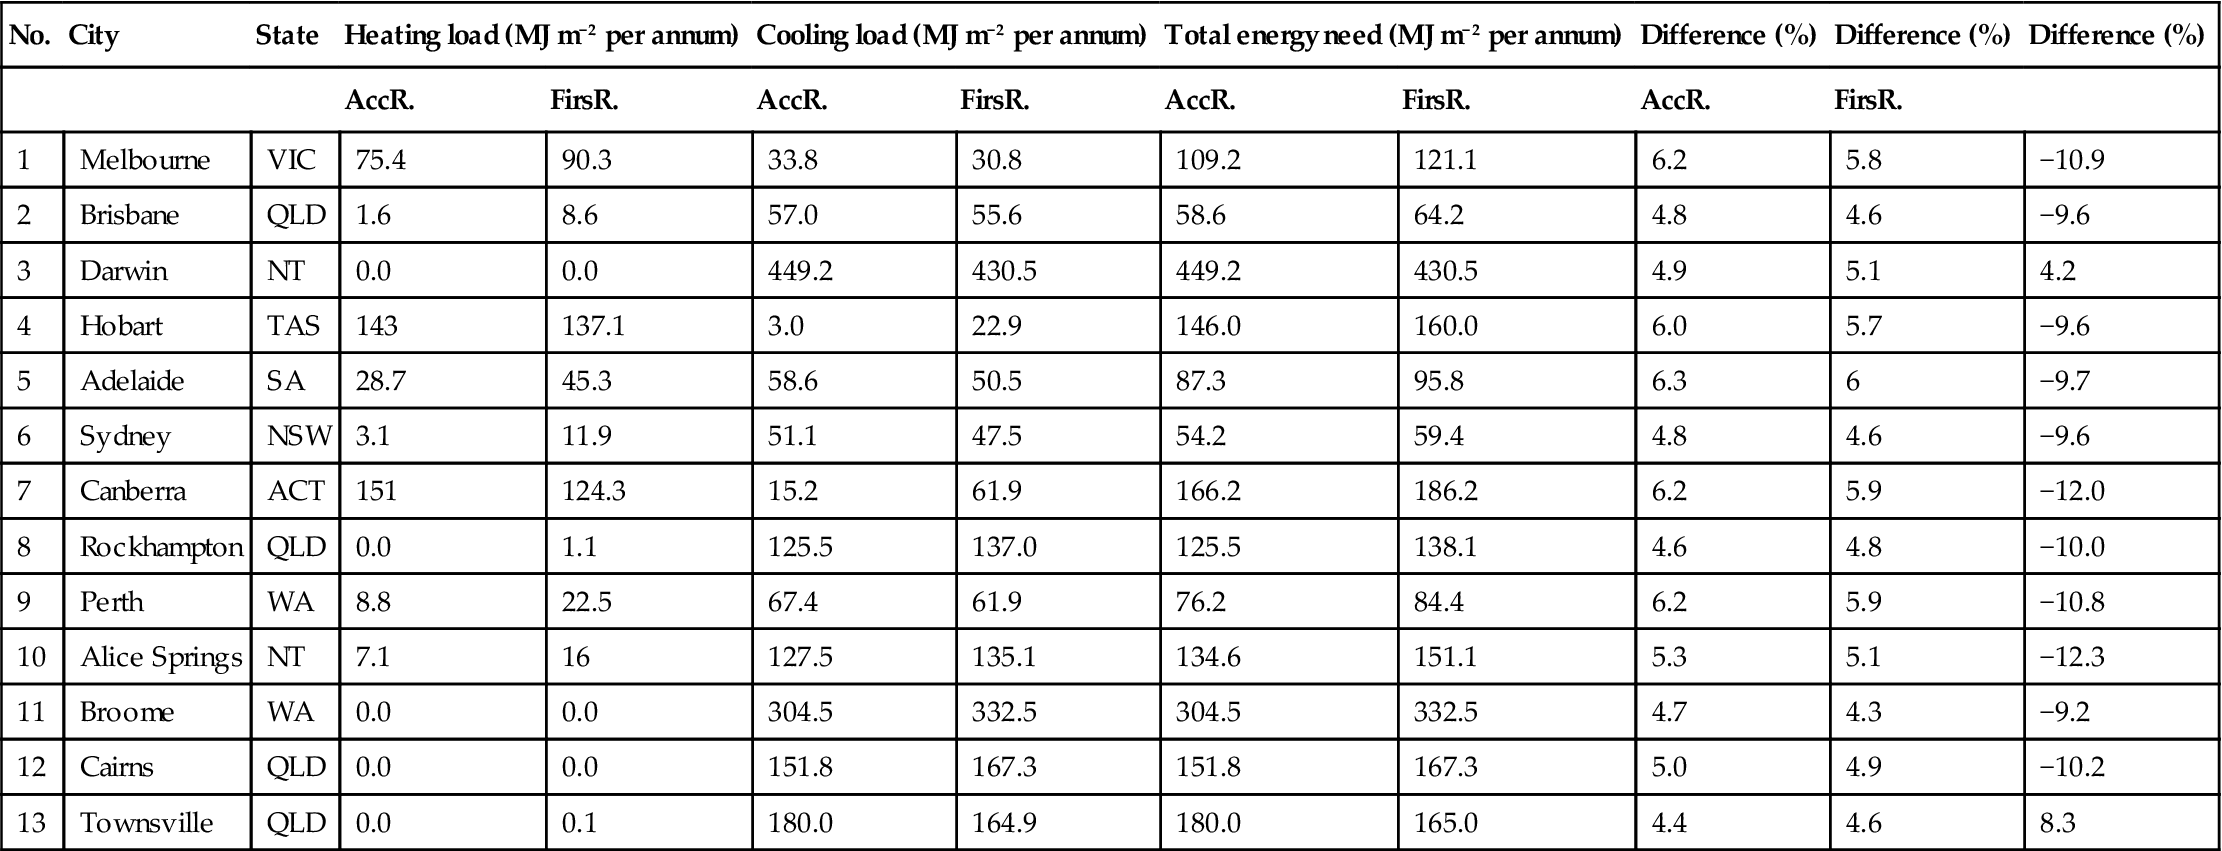
In order to understand the relative thermal performance of two accredited commercially available software packages, the Victorian Government’s FirstRate5 was compared against the Australian federal government-approved and the CSIRO Australia-developed software, AccuRate. The input modeling data (building and climate) for both software packages were identical. The thermal performance was evaluated for the conventional house wall and the new house wall system (Design 3) for 13 major Australian cities/towns. Performance comparison of software packages is a general practice [29,30]. The thermal performance results based on modeling data are shown in Tables 8.8 and 8.9 for the conventional and new house wall (Design 3) systems. The maximum variation in thermal performance and star rating between the two software packages is around 12%.
Table 8.8
Modeling data obtained by AccuRate and FirstRate5 for conventional house wall
| No. | City | State | Heating load (MJ m−2 per annum) | Cooling load (MJ m−2 per annum) | Total energy need (MJ m−2 per annum) | Star rating 0–10 | Difference (%) | ||||
| AccR. | FirsR. | AccR. | FirsR. | AccR. | FirsR. | AccR. | FirsR. | ||||
| 1 | Melbourne | VIC | 112.5 | 132.2 | 42.1 | 35.0 | 154.6 | 167.2 | 4.9 | 4.6 | −8.2 |
| 2 | Brisbane | QLD | 7.9 | 13.9 | 67.4 | 70.07 | 75.3 | 82.0 | 3.7 | 3.5 | −8.9 |
| 3 | Darwin | NT | 0.0 | 0.0 | 630.4 | 606.2 | 630.4 | 606.2 | 2.2 | 2.4 | 3.8 |
| 4 | Hobart | TAS | 186.9 | 207.7 | 12.8 | 8.7 | 199.7 | 216.4 | 5.1 | 4.7 | −8.4 |
| 5 | Adelaide | SA | 53.6 | 64.5 | 96.0 | 106.2 | 149.6 | 160.7 | 4.3 | 4.1 | −7.4 |
| 6 | Sydney | NSW | 13.1 | 21.1 | 63.4 | 68.3 | 76.5 | 83.4 | 3.7 | 3.6 | −9.0 |
| 7 | Canberra | ACT | 176.1 | 190.6 | 42.3 | 49.3 | 218.4 | 239.9 | 4.9 | 4.6 | −9.8 |
| 8 | Rockhampton | QLD | 0.7 | 2.4 | 168 | 179.8 | 168.7 | 182.2 | 2.9 | 2.7 | −8.0 |
| 9 | Perth | WA | 26.2 | 44.2 | 95.7 | 90.5 | 121.9 | 134.7 | 3.9 | 3.6 | −10.5 |
| 10 | Alice Springs | NT | 17.3 | 28.3 | 212.2 | 222.7 | 229.5 | 251.0 | 3.4 | 3.2 | −9.4 |
| 11 | Broome | WA | 0.0 | 0.0 | 455.2 | 482.6 | 455.2 | 492.6 | 2.3 | 2.1 | −8.2 |
| 12 | Cairns | QLD | 0.0 | 0.0 | 218.7 | 234.0 | 218.7 | 234.0 | 2.6 | 2.4 | −7.0 |
| 13 | Townsville | QLD | 0.0 | 0.2 | 264.5 | 244.8 | 264.5 | 245.0 | 2.2 | 2.3 | 7.4 |
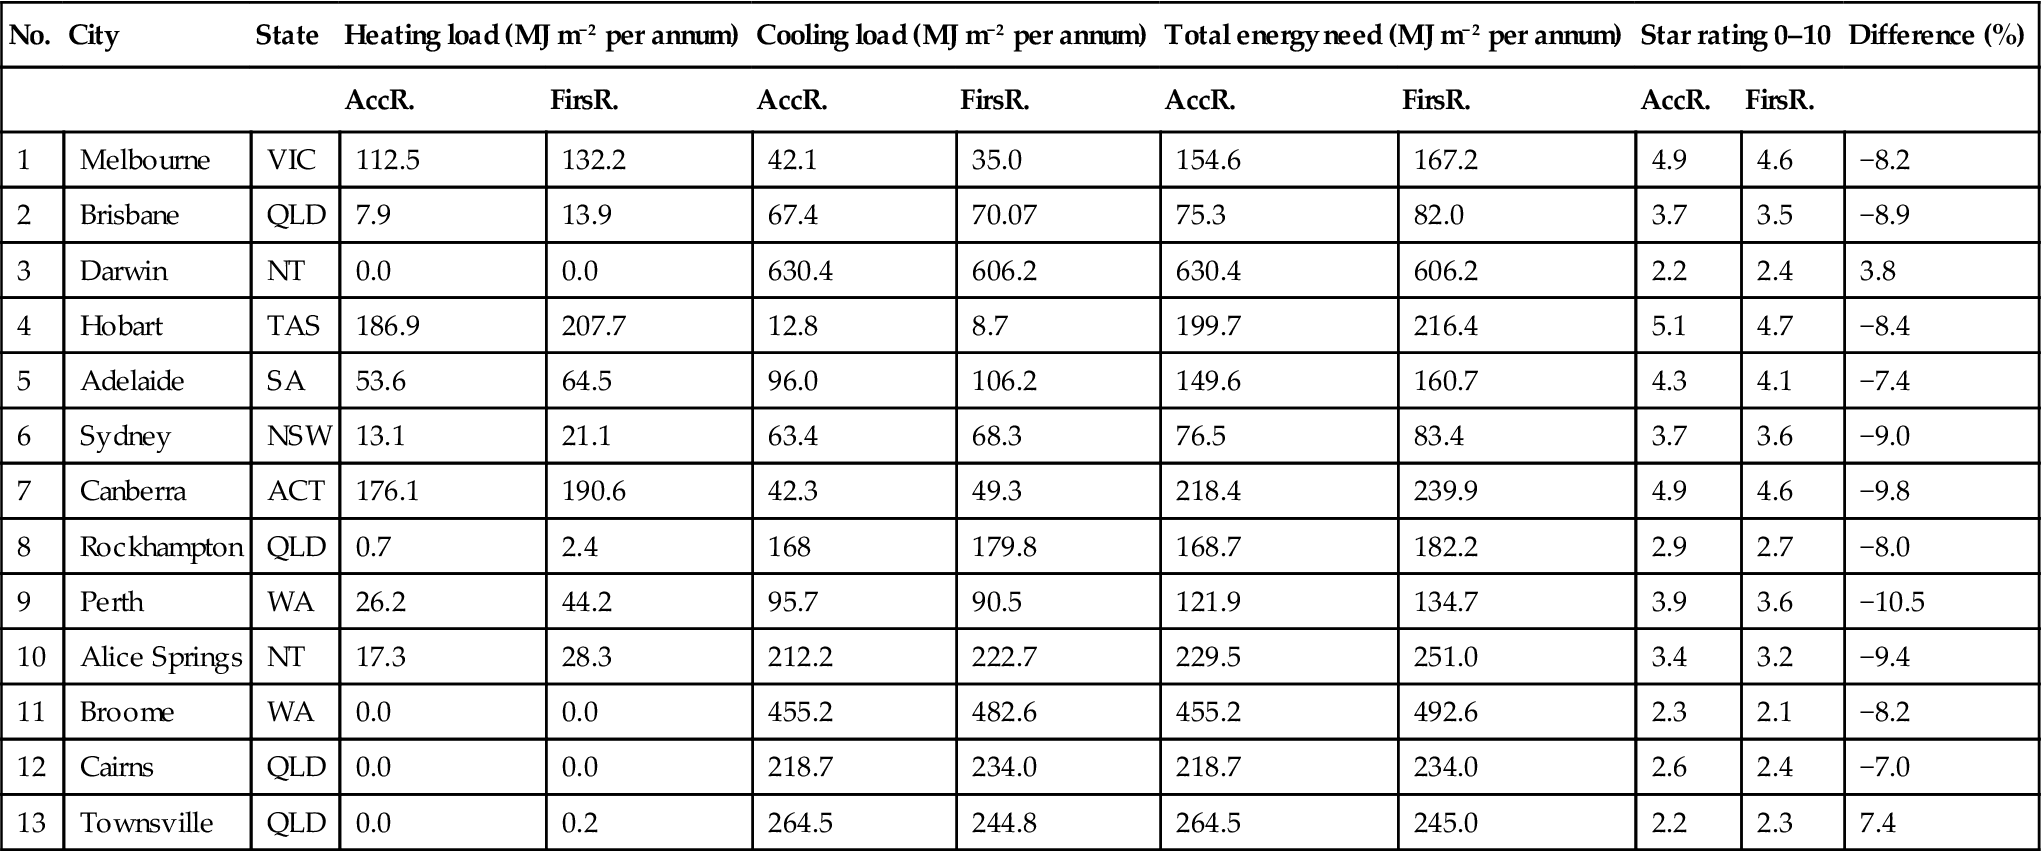
Table 8.9
Modeling data obtained by AccuRate and FirstRate5 for new house wall (Design 3)
| No. | City | State | Heating load (MJ m−2 per annum) | Cooling load (MJ m−2 per annum) | Total energy need (MJ m−2 per annum) | Difference (%) | Difference (%) | Difference (%) | |||
| AccR. | FirsR. | AccR. | FirsR. | AccR. | FirsR. | AccR. | FirsR. | ||||
| 1 | Melbourne | VIC | 75.4 | 90.3 | 33.8 | 30.8 | 109.2 | 121.1 | 6.2 | 5.8 | −10.9 |
| 2 | Brisbane | QLD | 1.6 | 8.6 | 57.0 | 55.6 | 58.6 | 64.2 | 4.8 | 4.6 | −9.6 |
| 3 | Darwin | NT | 0.0 | 0.0 | 449.2 | 430.5 | 449.2 | 430.5 | 4.9 | 5.1 | 4.2 |
| 4 | Hobart | TAS | 143 | 137.1 | 3.0 | 22.9 | 146.0 | 160.0 | 6.0 | 5.7 | −9.6 |
| 5 | Adelaide | SA | 28.7 | 45.3 | 58.6 | 50.5 | 87.3 | 95.8 | 6.3 | 6 | −9.7 |
| 6 | Sydney | NSW | 3.1 | 11.9 | 51.1 | 47.5 | 54.2 | 59.4 | 4.8 | 4.6 | −9.6 |
| 7 | Canberra | ACT | 151 | 124.3 | 15.2 | 61.9 | 166.2 | 186.2 | 6.2 | 5.9 | −12.0 |
| 8 | Rockhampton | QLD | 0.0 | 1.1 | 125.5 | 137.0 | 125.5 | 138.1 | 4.6 | 4.8 | −10.0 |
| 9 | Perth | WA | 8.8 | 22.5 | 67.4 | 61.9 | 76.2 | 84.4 | 6.2 | 5.9 | −10.8 |
| 10 | Alice Springs | NT | 7.1 | 16 | 127.5 | 135.1 | 134.6 | 151.1 | 5.3 | 5.1 | −12.3 |
| 11 | Broome | WA | 0.0 | 0.0 | 304.5 | 332.5 | 304.5 | 332.5 | 4.7 | 4.3 | −9.2 |
| 12 | Cairns | QLD | 0.0 | 0.0 | 151.8 | 167.3 | 151.8 | 167.3 | 5.0 | 4.9 | −10.2 |
| 13 | Townsville | QLD | 0.0 | 0.1 | 180.0 | 164.9 | 180.0 | 165.0 | 4.4 | 4.6 | 8.3 |
8.6.1 Industrial Implications
Building communities (consumers, builders, regulatory authorities, policy makers, building materials manufacturers/production industries) need scientifically proven data on building materials for use in residential building and other relevant sectors. The building construction method needs to be better optimized for enhancing further energy savings. This, in turn, will lead to low carbon emissions, economic benefits, and sustainability.
At present, most construction and building companies and regulatory authorities are not open to embracing new house building technology and/or new building materials for mainstream public use because they do not possess scientifically proven data about the use of new construction methodology and materials. Most building regulatory authorities need solid scientific data for providing approval of new materials to enhance occupants’ safety and well-being. Data presented in this book chapter will provide an insight into new house wall systems and their relative thermal performance compared to currently used brick veneer house wall systems.
8.7 Concluding Remarks
The following conclusions have been drawn from the work presented in this chapter:
• The new design provides energy saving for ongoing heating and cooling of up to 35% compared to the currently used conventional house wall system in Australia.
• The position of insulation materials within the new house wall systems for different climate conditions shows a further energy consumption reduction for ongoing heating and cooling.
• Several major insulation materials, synthetic and natural, have been identified for house wall systems that can provide fire resistance and lower toxicity. These materials are readily available at a reasonable cost.
• For the houses located in cities or towns that require more heating than cooling, the inner position of the insulation is better. Similarly, the outer location of insulation provides better energy savings for houses located in tropical and subtropical climates.
• Double-glazed windows are better suited for conventional house wall systems than that of the new house wall system.
• The data obtained by the way of various computational modeling software can vary notably. In this study, it was found to be up to 15%. Therefore, the star rating obtained by these software packages can also vary.
• In order to understand the comprehensive thermal performance over a reasonable period (around 2 years), the thermal behavior of house wall systems should be monitored, measured, and analyzed with a full-scale house made of conventional and new house wall systems.