
Thermal Efficiency Modeling in a Subtropical Data Center
N.M.S. Hassan, M.M.K. Khan and M.G. Rasul, School of Engineering and Technology, Higher Education Division, Central Queensland University, Rockhampton, QLD, Australia
This chapter presents a study on examining and improving thermal efficiency of a data center. It reports the development of a computational fluid dynamics (CFD) model for the performance analysis of computer room air conditioners, detailed rack-by-rack inlet and exit temperatures and 3D thermal mapping of the data center and racks. In particular, the model identified the potential high-temperature zone within the computer rack and provided a detailed 3D analysis of how cold air moved through the data center. The study determined the impact on cooling resources such as equipment layout, air flow rate, floor tiles, heat load distribution, and other supplementary cooling strategies. It also proposed temperature estimates for given rack loadings. The developed CFD model can be used to develop cooling strategies for achieving better thermal performance in data centers.
Keywords
Data center; thermal mapping; cooling strategies; rack loadings; thermal performance
2.1 Introduction
A data center is a facility used to accommodate computer systems and associated components, such as telecommunications and storage systems. Data centers consume a large amount of electricity world-wide. Therefore it is essential to gain an understanding of data center energy consumption. Extensive research on information technology (IT) equipment characteristics and cooling load has been carried out since IT and electrical equipment occupies a large portion of a data center [1]. Figure 2.1 shows the energy-consuming electrical components in a typical data center.

On average, existing data centers require around twice the amount of cooling than they currently have, as many of them have problems with high-temperature zones created within the data centers due to high-performance computing systems [2]. Researchers estimate that data centers currently consume a total of 26 GW of power worldwide. This is equivalent to approximately 1.4% of global energy consumption [3]. The United States alone spent approximately $3.3 billion annually on energy to power data centers in the first decade of this century [3]. This consumption has increased by approximately 12% per year; therefore, more energy-efficient technology is necessary to implement immediately to reduce the cost in the data center industries [3].
Cho et al. [1] categorized the energy uses in data centers as either demand side or supply side as shown in Figure 2.2. It is noted that the supply-side systems exist to support the demand side. Figure 2.2 shows the demand-side systems consumed 52% of the total consumption. On the other hand, supply-side systems accounted for 48% of total consumption.

Data centers usually include redundant or backup power supplies, redundant data communications connections, air conditioning, fire suppression, and security devices. The technological advances with servers and networking equipment enable the equipment that once filled a room to now be placed in a single rack; this concentration however creates excessive power and heat problems.
The cooling infrastructure is a significant part of a data center. Cooling has been found to contribute a significant portion of this energy use [4]. As technology advances, data centers are becoming more complex, increasing the computational power and power density drastically. Power densities are increasing, with many server racks already exceeding 10 kW and future predictions of 20, 30 kW, and beyond meaning the traditional computer rack configuration is simply unable to be effectively managed. More cooling equipment requires more electrical power to drive it, yet with rising electricity costs, and concerns over carbon footprints, companies are trying to reduce their power use [2]. The complicated network of chillers, compressors, and air handlers creates the best possible computing environment, ensuring the long life of the servers installed within and the strength of the organization they support [2].
The common scenario for data center infrastructure is the deployment of high-density equipment. However, in most cases, data centers are not sufficiently capable of handling the additional cooling requirements resulting from these deployments due to the unwanted conditions such as recirculation or mixing of hot and cool air, poorly controlled humidity and wasted costly cooling capacity [2]. Traditional data centers are not efficient due to poor airflow management. Because airflow and pressure are not visible, it is not easy to develop a plan for improving airflow management without the use of an airflow management modeling tool. As the power density continues to increase in data centers, it is essential to implement effective and efficient cooling methods for the energy efficiency of data centers [5].
A number of researchers have undertaken studies on the dynamic optimization of the data center thermal environment. These studies mostly focused on the layout design of the data center. Bash et al. [6] have investigated the need for placing the critical equipment of a data center in close proximity and then carefully managing its cooling. Nakao et al. [7] studied data center cooling configurations with different variations. These configurations were—under-floor supply with ceiling exhaust, under-floor supply with horizontal exhaust, overhead supply with under-floor exhaust, and overhead supply with horizontal exhaust.
Noh et al. [8] used three variations for designing the data center for 5–6-kW rack loads. They used these configurations in telecommunications applications which included under-floor supply with ceiling exhaust, overhead supply with under floor exhaust, and overhead supply with wall exhaust. Both of these studies have suggested that under-floor supply with a ceiling return of air is the best option. Therefore, this configuration has been chosen for modeling in this study. The hot aisle/cold aisle cabinet layout scheme is a traditional practice within a data center for data center architects, engineers, and end-users [2]. This scheme was selected for designing the computer rack configuration in order to better direct cold air from the air conditioning system to the input side of the IT equipment [9]. A typical data center usually consists of several server racks and one or many computer room air conditioning (CRAC) units, placed in such a way that there are hot and cold aisles in the room. This arrangement separates the hot air of the servers from the cooled air of the CRAC unit(s). However, this arrangement continues to have some unwanted results because the hot exhaust air usually cannot be completely separated from the cold air [10]. Figure 2.3 shows the hot aisle/cold aisle configuration [2,9,11].
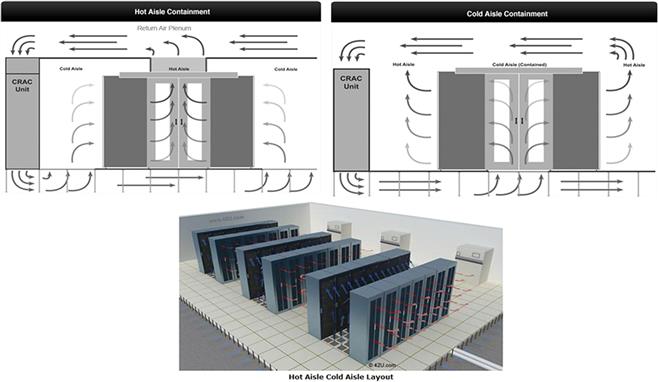
In the hot aisle/cold aisle, the racks are placed into a series of rows, standing on a raised floor. The fronts of the racks face each other and become cold aisles due to the front-to-back heat dissipation of most IT equipment. CRACs are situated around the perimeter of the room or at the end of the hot aisles. CRACs deliver cold air under the raised floor. This cold air enters the room through perforated raised floor vent tiles and passes through the racks and absorbs heat. This hot air then returns to the CRAC intake [2,9,11].
Till now, the main concern for data center users was the operating reliability. Energy efficiency was less of a priority. Hence, most of the data centers were designed based on the worst-case scenario [12]. However, as the increase in power densities in the data center reaches levels that lead to limitations, energy efficiency is now observed as a way to solve these problems. The increase in computational capabilities of data centers has resulted in corresponding increases in rack and room power densities [13,14]. Therefore, it is important to know and understand the phenomena which reduce the energy consumption when designing data centers.
The aim of this chapter is to develop a cooling model of CQU’s computer data center with a focus on developing technologies and strategies that change the dynamics of data center cooling to achieve energy cost savings. Therefore, the main objective of this chapter is to develop a computational fluid dynamics (CFD) model that accurately maps the distribution of thermal, pressure, and airflow mapping of CQU’s data center to improve cooling efficiency.
2.2 CFD Modeling of Data Center
2.2.1 Simulation Approach
The flow phenomena inside a data center are complex in nature and, in most cases, rely on CFD and heat transfer modeling. CFD is the versatile tool for predicting the thermal performance of data centers by analyzing airflow and heat transfer characteristics. CFD is also used to investigate strategies to optimize the data center cooling and power savings.
Many researchers [15–18] have adopted four main approaches for different numerical investigations in data center modeling as follows:
• raised floor plenum airflow modeling to predict perforated tile flow rates,
• thermal effects of rack layout and power distribution,
• investigation of alternative supply and return schemes, and
Patel et al. [15] introduced CFD and heat transfer modeling in the data centers and performed computations on a data center model facility. Schmidt et al. [16] carried out experimental measurements through raised floor data center perforated tiles with 2-D CFD models. Schmidt and Shaukatullah [17] extensively reviewed the literature on data centers and reported the rapid growth in data center power density.
Rambo and Joshi [19–22] carried out 2D CFD analysis of the flow through a row of perforated tiles. They investigated the correlation between the flow rate and the distance between the CRAC unit and the perforated tile row. In another study, Van Gilder and Schmidt [23] also analyzed a 3D CFD modeling of the plenum in a data center. They predicted the effect of flow distribution through the perforated tiles as a function of plenum depth and the proportion of open area of the perforated tiles. This study by Van Gilder and Schmidt modeled many different data center layouts and was validated by experimental results. Most of the studies indicate that the standard k−ε turbulence model has been employed for the data center modeling [24,25]. However, in some cases the full Reynolds stress model [19–22] was also used to assess the isotropic eddy viscosity assumption.
In this chapter, a data center was modeled and analyzed using the CFD code “Fluent” to study the effectiveness of cooling within the racks and aisles of the center. CoolSim software was used for designing a graphical user interface that allowed data center components to be positioned, sized, and characterized in a plan view [26]. Modeling of airflow and temperature distribution in the data center was performed using Fluent [27].
The Information Technology Department (ITD) Building 19 of CQU at Rockhampton has a high-efficiency Heating, Ventilation, and Air Conditioning system [11]. Figure 2.4 shows the 3D view of the data center of CQU, Rockhampton Campus.

The standard k−ε turbulence model was employed in this chapter for data center thermal modeling. Turbulent mixed convection was chosen for the flow inside the data center and forced convection for the flow through the data-processing equipment inside a rack was assumed. Buoyancy effects were also considered at the rack exhaust as the hot air returns to the CRAC units. A steady state approximation was considered for data center thermal performance. The modeling equations were solved using a second order up-wind scheme, and the SIMPLEC (SIMPLE-consistent) pressure–velocity coupling algorithm and the PRESTO pressure interpolation scheme were used for the rectilinear staggered grids.
2.2.2 Modeling Equations
The standard ![]() turbulence model in FLUENT is a two-equation model in which the solution of two separate transport equations allows the turbulent velocity and length scales to be independently determined [27]. This model has become important for practical engineering flow calculations in the time since it was proposed by Launder and Spalding [28]. The standard
turbulence model in FLUENT is a two-equation model in which the solution of two separate transport equations allows the turbulent velocity and length scales to be independently determined [27]. This model has become important for practical engineering flow calculations in the time since it was proposed by Launder and Spalding [28]. The standard ![]() model is a semi-empirical model based on model transport equations for the turbulence kinetic energy (
model is a semi-empirical model based on model transport equations for the turbulence kinetic energy (![]() ) and its dissipation rate (
) and its dissipation rate (![]() ). The model transport equation for
). The model transport equation for ![]() is derived from the exact equation, while the model transport equation for
is derived from the exact equation, while the model transport equation for ![]() was obtained using physical reasoning and bears little resemblance to its mathematically exact counterpart. In the derivation of the
was obtained using physical reasoning and bears little resemblance to its mathematically exact counterpart. In the derivation of the ![]() model, the assumption is that the flow is fully turbulent and the effects of molecular viscosity are negligible. The standard
model, the assumption is that the flow is fully turbulent and the effects of molecular viscosity are negligible. The standard ![]() model is therefore valid only for fully turbulent flows [27].
model is therefore valid only for fully turbulent flows [27].
The turbulence kinetic energy, ![]() (m2 s−2), and its rate of dissipation,
(m2 s−2), and its rate of dissipation, ![]() (m2 s−3), are obtained from the following transport equations:
(m2 s−3), are obtained from the following transport equations:
[2.1]
and
[2.2]
 [2.2]
[2.2]
Turbulent (or eddy) viscosity, ![]() , is computed by combining
, is computed by combining ![]() and
and ![]() as follows [25]:
as follows [25]:
[2.3]
where ![]() is a constant.
is a constant.
In the above equations, ![]() ,
, ![]() are the components of fluctuating velocity (m s−1);
are the components of fluctuating velocity (m s−1); ![]() is the components of length
is the components of length ![]() .
. ![]() represents the generation of turbulence kinetic energy due to the mean velocity gradients (kg m−1 s−2) calculated as described in Fluent [27].
represents the generation of turbulence kinetic energy due to the mean velocity gradients (kg m−1 s−2) calculated as described in Fluent [27]. ![]() is the generation of turbulence kinetic energy due to buoyancy (kg m−1 s−2), calculated as described in [27].
is the generation of turbulence kinetic energy due to buoyancy (kg m−1 s−2), calculated as described in [27]. ![]() represents the contribution of the fluctuating dilatation in compressible turbulence to the overall dissipation rate (kg m−1 s−2), calculated as described in [27].
represents the contribution of the fluctuating dilatation in compressible turbulence to the overall dissipation rate (kg m−1 s−2), calculated as described in [27]. ![]() are constants.
are constants. ![]() and
and ![]() are the turbulent Prandtl numbers for
are the turbulent Prandtl numbers for ![]() and
and ![]() , respectively (kg m−1 s−2).
, respectively (kg m−1 s−2). ![]() and
and ![]() are user-defined source terms.
are user-defined source terms.
2.3 Data Center Description
CQU’s main data center is located in Room G-33 at the ITD building on the Rockhampton Campus. It has no windows and minimal fresh air. This is due to fact that data centers are primarily designed for IT equipment and not for humans. It is important that the operating conditions within the facility are based on the manufacturer’s specifications. The American Society of Heating, Refrigerating and Air-Conditioning Engineers (ASHARE) has proposed thermal guidelines for data center environments. It has recommended that the server inlet temperature should be between 20°C and 25°C. ASHRAE thermal guidelines for data-processing environments and Datacom equipment [29,30] were followed in this study.
Three (down flow type) CRAC units were employed in this room. The room return facility had a raised floor but had no supplemental cooling. The CRAC units were part of the raised floor room layout with cooling air passing through the plenum and venting in the room through vent tiles. As shown in Figure 2.4, the racks were arranged in two rows that can have individual heat load and airflow; each row consists of five racks. Air flow direction and air flow rate were defined for all racks from the specifications model of the CoolSim 3.2 software. The front face of the rack, the air inlet for the equipment, was placed facing the vent tiles. The air-moving device inside the racks was assumed to force air straight through the rack, with a constant velocity into the front and out of the back of the racks. The back side of the rack from where the hot air emanates faces the back side of another rack, thus developing a hot aisle between the two rows. Each rack was high-performance 3.46 kW racks, with a rack airflow rate of 0.23 m3 s−1. This system is considered appropriate for the hot-humid climate of Rockhampton which is in a sub-tropical zone. In this study, 56% openings were chosen for the perforated vent tiles.
The descriptions of data center components based on the current configurations of CQU data center and the air flow through racks and vent tiles are summarized below when three CRAC units are operating.
2.4 Results and Discussion
2.4.1 Experimental
Experimental results were obtained through a series of measurements at the ambient temperature. The temperature measurements inside the data center room were performed using HOBO Pendant Temp data loggers. The data loggers were set at different points inside the room to measure indoor room temperature. The room temperatures were measured mostly during the October, 2011–November, 2012 period. The average room temperature profiles and trends are shown in Figures 2.5 and 2.6 on a daily, weekly, and yearly basis. As seen from Figure 2.5(a), the maximum temperature of 22°C and minimum temperature of 21°C were recorded inside the data center and these data were taken over 1 week with 15 min sample intervals. Figure 2.5(b) shows the monthly temperature profile from October to November with 1 h intervals. It can be seen from Figure 2.5(b) that average maximum and minimum temperatures were observed as 23°C and 21°C respectively. No significant difference was observed in temperature on the weekly and monthly basis.


Figure 2.5(c) shows the temperature profile from October to November with 1-day sample intervals. As can be seen from this figure, average maximum and minimum temperatures were found to be 21°C and 28°C respectively with a mean value of 22.26.
Figure 2.6 shows the current and future trend of temperature profiles on weekly, monthly, and half-yearly basis using a substantial number of data points. The future trends of temperature profiles are based on an average of the past data. The results of the temperature profiles and trends obtained from the experiments are in good agreement with the ASHRAE guidelines [29,30].
2.4.2 Simulations Results
The simulation was performed for the initial data center cooling model shown in Figure 2.4. The results of the room and rack thermal maps and static pressure map and the effect on the CRAC return temperatures and CRAC performance are reported in the following sections.
2.4.2.1 Data Center Room and Rack Thermal Maps
The results of the room thermal maps of the CQU data center model are presented for different planes within the data center in Figures 2.7–2.10. As discussed earlier, there are three CRAC units and the total flows through the CRACs and racks are 17.55 and 2.56 m3 s−1 respectively. Figure 2.7(a) and (b) indicate the thermal profiles at 3 ft (0.914 m) and 6 ft (1.83 m) height above the floor respectively. It can be seen from this figure that greater temperatures were observed at the higher height (1.83 m) than the lower height (0.914 m). For both cases, the temperature rise is more pronounced at one end of the racks of the data center. For both cases, several high-temperature regions can be seen on the inlet sides of the racks. These produce high room temperatures inside the data center where there are spaces between the equipment in the racks. From these figures, it is evident that the hot exhaust air is being recirculated into the cold aisle where it is mixing with the supplied cold air. This has caused the inlet temperatures of the racks to rise above the supply temperature. Usually, the flow of air passes from the vent tiles into the cold aisle, where the cold air is drawn into the server inlets and exhausted out of the back of the servers into the hot aisles. The hot air is then moved to the sides of the room where it is passed into the CRACs. Such hot temperature zones cause rises in temperature leading to reliability issues for computer components. Hence it becomes important to employ proper cooling solutions to keep the temperatures within the required limits.
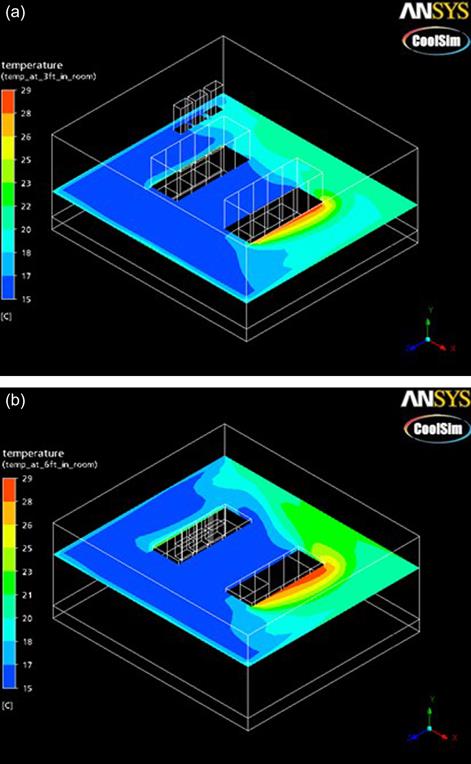


However, it is noted that the cooling of any data center comprises two primary components, these being the total capacity of the cooling system and its related airflow [31]. Therefore it is essential to employ both of these parameters to have efficient cooling in the data center.
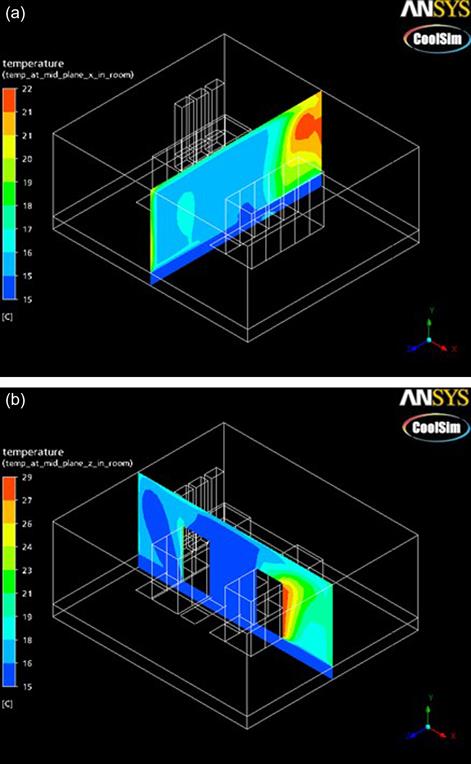
Thermal maps at the mid planes along the length and width of the data center are shown in Figure 2.8. Large temperature gradients were observed outside the racks for both cases. As can be seen from the figures, the higher temperature along the width was found to be greater than that along the length. Moreover, a different recirculation pattern was also observed at the outside rack. Hot air exhausting into the hot aisle is forced into the cold aisle from the side as well as from the top and back of the racks.
Thermal maps at quarter planes along the length and width of the data center are shown in Figure 2.9. For both cases, high-temperature zones were found along the length and width of the data center. The high-temperature zones were visible outside of the racks along the length, and at the top of the back side of the computer rack along the width; also hot and cold air mixing was present.
Figure 2.10 shows the temperature distribution at three quarter planes along the length and width in the data center. For both cases, hot and cold air mixing was present, however a high-temperature zone (maximum temperature around 29°C) was observed along the wall and at the back of the second rack of the data center. This is due to the flow re-circulating from the exhaust side of the cabinet. Moreover, a low-temperature zone was found along the width at the three-quarter plane. A slightly higher temperature was also seen at the back of the right end of the second rack in this plane, but it is not a significant amount of temperature rise. However, it occurs because the server intake air is a combination of room air and air leaving the server outlets, instead of air from the vent tiles in the raised floor which was also identified in the study by Hassan et al. [11].
Figure 2.11 shows the temperature distribution at the back side of the first rack and the front side of the second rack. The temperature distributions of both racks were found to be mainly 15–16°C, which is similar to the server inlet temperature, but there is one exception at the top right corner of the second rack where the temperature was found to be slightly higher at around 18–20°C. This is due to a high-density server causing high recirculation between the inlet and ambient air.

2.4.2.2 Static Pressure Map
Figure 2.12 shows the pressure distribution in the data center room. As seen from this figure, low-pressure areas were found at the surroundings of the computer rack inlets. However, very low pressure was observed in the CRAC units, this ranging from −641.67 Pa to −403.70 Pa. As mentioned earlier, the inlet air to the servers is nearly the same temperature as the air supplied from the CRACs. However, the air in front of the servers at the bottom of the cabinets is moving at a high velocity, causing a low static pressure. Wu [14] has reported in his study that the cold aisle efficiently creates a thermal and mass flow boundary between the cold aisle and hot aisle. The cold aisle creates a region for mass to be ensnared, which creates a high static pressure region [14]. The cooling flow is increased with increase in power density, resulting in an increased airflow to the cold aisle.

This is due to cold air entering the racks near the cold aisle region and there is an increase in static pressure of cold air as the cooling flow increases. A lower power density also creates the low static pressure due to the lower amount of air-flow from the CRACs, ensuring a low build-up of static pressure near the floor of the cold aisle region. This is caused by the higher server inlet temperatures at the servers situated close to the floor.
2.4.2.3 Air Flow Paths
Figure 2.13 shows the supply and return temperature contours in the data center. Return air path lines in Figure 2.13(a) show the entrainment of exhaust air through gaps between the servers. The maximum supply and return temperatures were found to be 18°C and 26°C respectively. Therefore, it is evident that path lines of return air raise the supply air temperature to a higher level than is desirable. As seen from the summary report in Table 2.1, the maximum inlet temperature to the racks is found to be 18°C. Table 2.2 shows the CRACs’ performance report when all three CRACs were operating. The results shown in these two tables meet the ASHRAE guidelines [29,30]. Moreover, the inlet and exit temperatures at the racks were observed to be 18°C and 30°C, respectively. These temperature limits also meet the ASHRAE guidelines [29,30] which are shown in Table 2.3, and are also in good agreement with the experimental results. In addition, the low return temperature reduces the load on the CRACs and maintains the required supply temperatures [11].
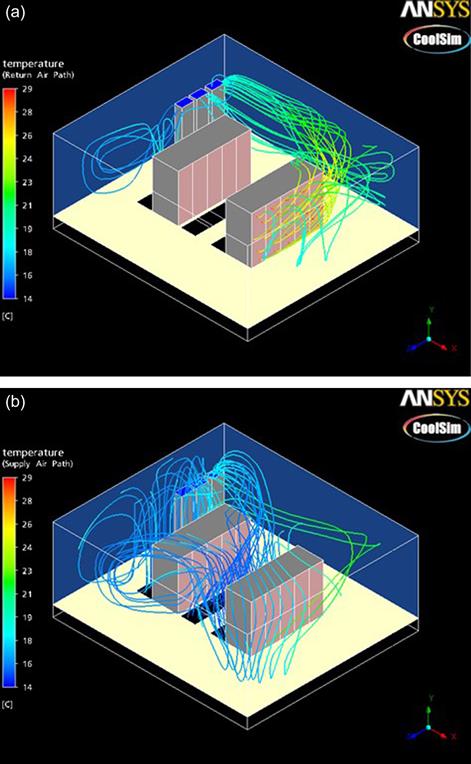
Table 2.1
| Model ID | Nur-3rd Data Model |
| Mesh density | Medium |
| Mesh count | 28,627 |
| Data center layout | Raised floor with room return |
| Data center components | |
| Room dimensions | 8.05×7.08×2.96 |
| Room floor area | 56.99 m2 |
| Supply plenum height | 0.45 m |
| Number of CRAC units | 3 |
| Total flow through CRAC units | 17.556 m3 s−1 |
| Supply air cooling capacity | 42,317.84 W |
| Number of rack rows | 2 |
| Total number of racks | 10 |
| Total rack heat load | 41.12 kW |
| Total flow through racks | 2.562 m3 s−1 |
| Number tile rows | 3 |
| Total number of vent tile | 15 |
| Total flow through tiles | 17.558 m3 s−1 |
| Average flow through each tile vent | 1.171 m3 s−1 |
| Power | |
| Rack heat source | 41.12 kW |
| Wall heat transfer | 1.15 kW |
| Total cooling load | 42.28 kW |
| Heat density | 741.8 W m−2 |
| Supply air cooling capacity | 42,317.84 W |
| Temperature details | |
| Highest temperature in data center room | 29°C |
| Highest inlet temperature in racks | 18°C |
| Flow through tiles | |
| Maximum flow through a vent tile | 2.433 m3 s−1 |
| Minimum flow through a vent tile | 0.092 m3 s−1 |
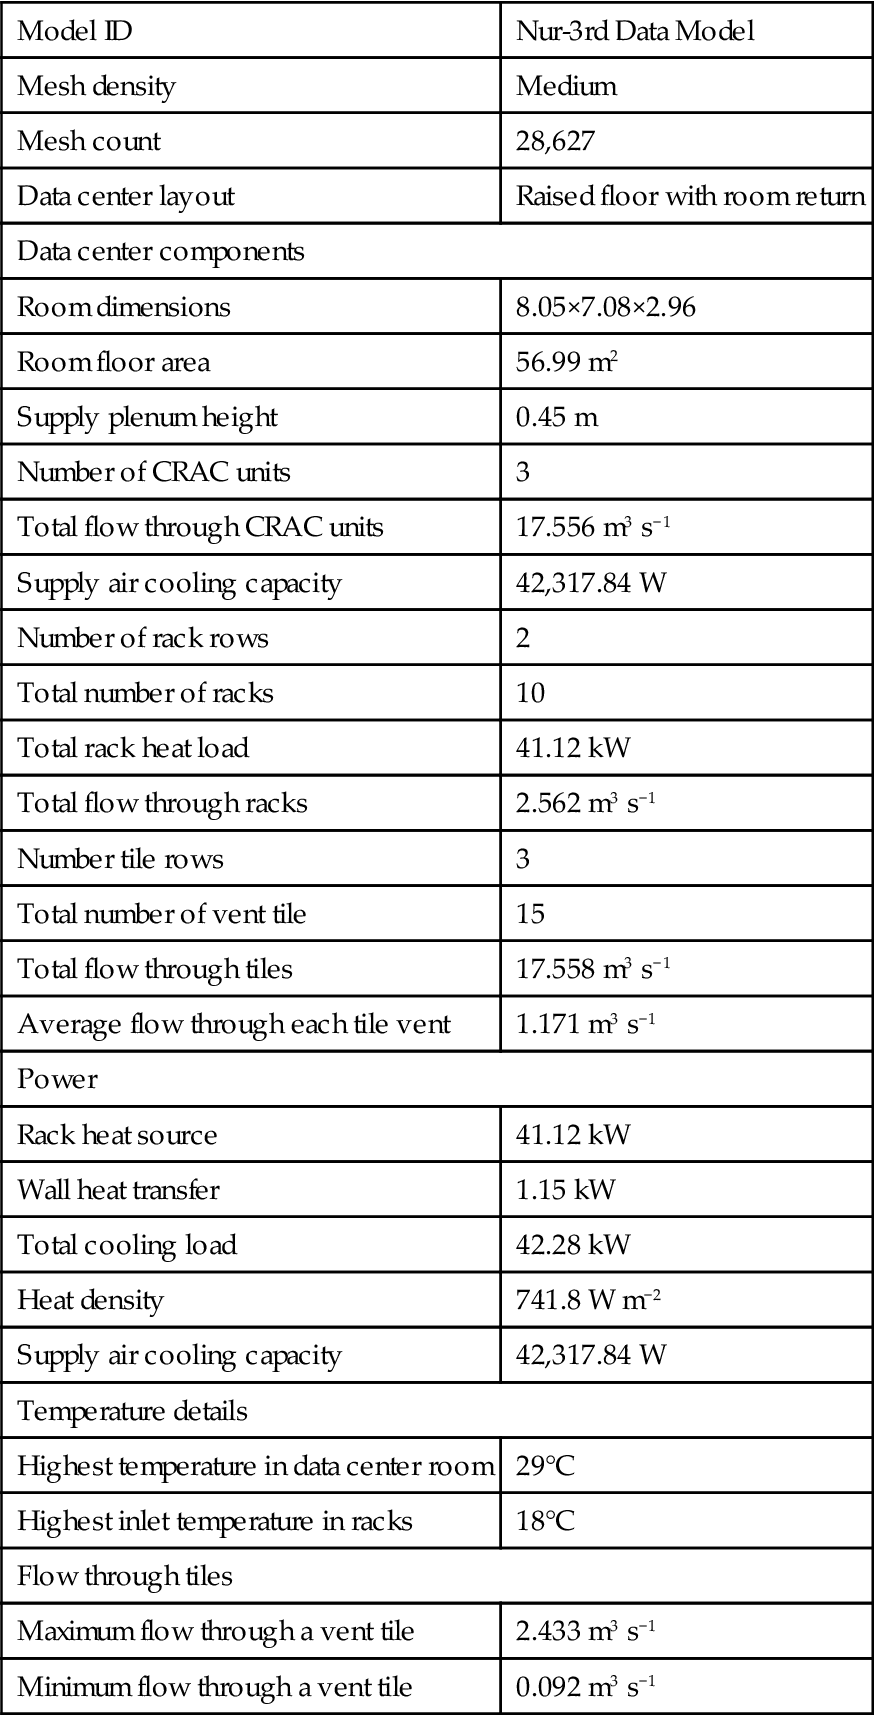
Table 2.2
CRAC performance report when three CRAC units are operating
| CRAC unit name | Average return temperature (°C) | Average supply temperature (°C) | Supply flow rate (m s−1) | Heat removal (W) | Deviation from average heat removala (%) |
| Down-flow units | |||||
| crac_0 (A, 1) | 18 | 15 | 5.852 | 24,650.14 | 74.75 |
| crac_1 (A, 3) | 17 | 15 | 5.852 | 14,935.51 | 5.88 |
| crac_2 (A, 4) | 16 | 16 | 5.852 | 2732.18 | −80.63 |
| Total | – | – | 17.56 | 42,317.84 | – |
| Average | – | – | – | 14,105.95 | – |
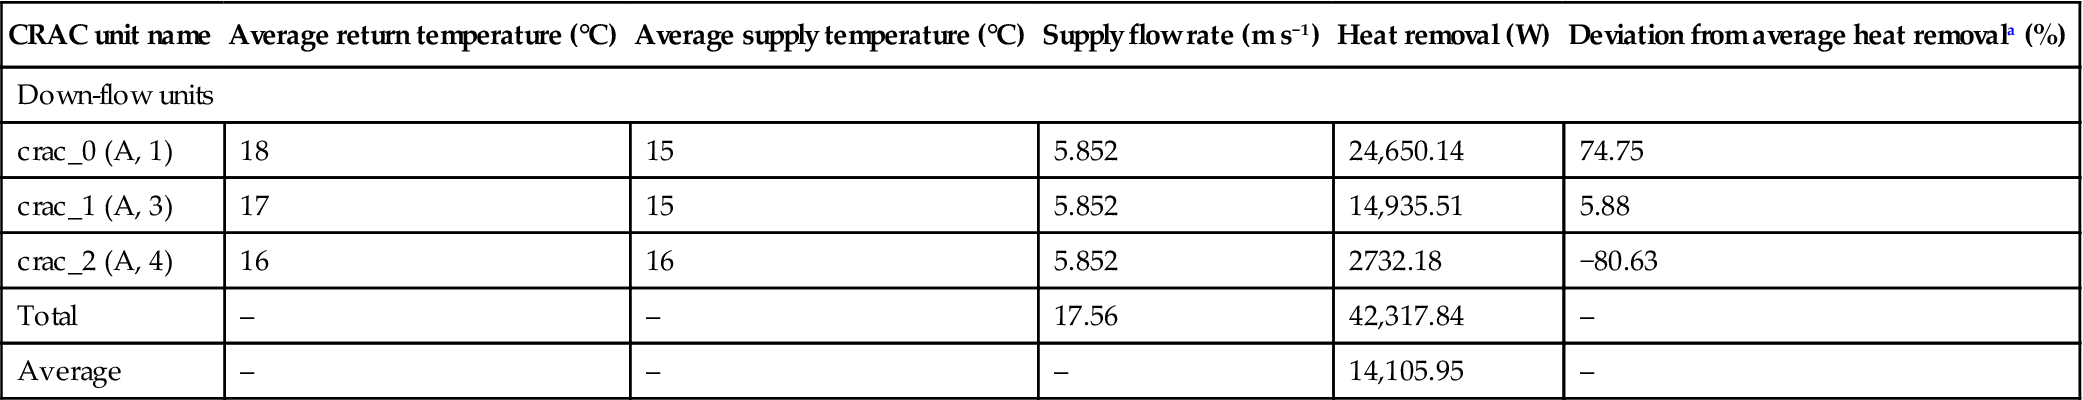
aDeviation from mean value=[CRAC heat removal−ave CRAC heat removal]/ave CRAC heat removal.
Table 2.3
| Rack row name | Inlet temperature | Average exit temperature (°C) | Flow rate (m3 s−1) | Power (kW) | Cooling indexa | ASHRAE recommended inlet temperature range for class I servers | |||
| Minimum (°C) | Maximum (°C) | Average (°C) | Recommendedb (18–27°C) | Allowablec (15–32°C) | |||||
| rackrow_0_1_1 (D, 5) | 16 | 18 | 17 | 29 | 0.225 | 3.46 | 0.839 | Pass | Pass |
| rackrow_0_2_1 (D, 6) | 15 | 16 | 16 | 28 | 0.225 | 3.46 | 0.949 | Pass | Pass |
| rackrow_0_3_1 (D, 6) | 15 | 16 | 16 | 28 | 0.225 | 3.46 | 0.942 | Pass | Pass |
| rackrow_0_4_1 (D, 7) | 15 | 16 | 16 | 29 | 0.23 | 3.56 | 0.938 | Pass | Pass |
| rackrow_0_5_1 (D, 8) | 16 | 16 | 16 | 29 | 0.225 | 3.46 | 0.935 | Pass | Pass |
| rackrow_1_1_1 (I, 5) | 15 | 17 | 16 | 30 | 0.286 | 4.73 | 0.896 | Pass | Pass |
| rackrow_1_2_1 (I, 6) | 15 | 16 | 16 | 29 | 0.286 | 4.73 | 0.957 | Pass | Pass |
| rackrow_1_3_1 (I, 6) | 15 | 16 | 16 | 29 | 0.286 | 4.73 | 0.976 | Pass | Pass |
| rackrow_1_4_1 (I, 7) | 15 | 16 | 15 | 29 | 0.29 | 4.82 | 0.986 | Pass | Pass |
| rackrow_1_5_1 (I, 8) | 15 | 16 | 15 | 29 | 0.286 | 4.73 | 0.985 | Pass | Pass |
| Total | – | – | – | – | 2.562 | 41.12 | – | – | – |

aRack cooling index=(ave CRAC supply temp/maximum rack inlet temp).
bASHRAE 2008 recommended inlet temperature range for class-I severs is 18–27°C.
cASHRAE 2008 allowable inlet temperature range for class-I servers is 15–32°C.
Figure 2.14 shows the air flow path lines in the plenum from the CRAC units. An enormous flowrate has been assigned to each of the CRACs in this study. Even in CRAC failure mode, when one of the CRACs is shut down, there is over three times too much air.

Each of the CRACs has a supply opening that is 0.3×0.5=0.15 m2. Through each one, a flowrate of 5.852 m3 s−1 has been assigned as shown in Table 2.2. This means that the average velocity through each supply is 35 m s−1. A parabolic profile is used to model the supply opening with the flow going to zero at the edges and about twice the average value (78 m s−1) near the center. By zooming in on the inlets of the CRACs, it is seen that the maximum velocity only occurs near the center of the supply opening. The bulk of the flow coming from each CRAC has a velocity closer to about 35 m s−1 or less.
The actual unit has the same flowrate but each supply should be 0.193 m2 so, with three of them, the total supply area is 0.579 m2. This would make the average velocity about 15 m s−1 or less, which is more reasonable. As seen from Figure 2.14, it is evident that the average velocity of the air leaving from the CRACs is around 15 m s−1 or less.
2.5 CRAC Performance
One of the biggest issues facing data center engineers is the loss of power during normal operation of the data center. The cooling equipment, however, needs backup power if any incidents happen during operation unless generators are installed with automatic start up [32]. Therefore, some of the CFD analysis results have been performed to analyze a CRAC failure in this study to know the consequences of this effect.
As discussed earlier in Figure 2.4, the three CRAC units were placed from right to left assuming 0, 1, and 2 numbers. The CRAC performance reports are summarized in Tables 2.4–2.6 when one of the CRAC units was disabled. Tables 2.4–2.6 show that the total cooling load decreases in comparison with the normal operation of the three CRAC units. Hence the supply air cooling capacity is also decreased, resulting in an increased average heat removal requirement for the data center when one of the CRAC units was malfunctioning. Moreover, the inlet temperature in the racks also increases. Therefore, heat load distribution in data centers can be complicated by reducing supply air flowrate and the presence of high inlet temperature. This high temperature in turn increases the load on CRAC units to maintain required supply temperatures. Therefore, it is recommended that all CRAC units must be maintained in continuous operation for efficient running of the data center.
Table 2.4
CRAC performance report while CRAC unit 2 is disabled
| CRAC unit name | Average return temperature (°C) | Average supply temperature (°C) | Supply flow rate (m3 s−1) | Heat removal (W) | Deviation from average heat removala (%) |
| Downflow units | |||||
| crac_0 (A, 1) | 18 | 14 | 5.852 | 31,272.36 | 50.2 |
| crac_1 (A, 3) | 17 | 16 | 5.852 | 10,369.48 | −50.2 |
| crac_2 (A, 4) | Off | Off | Off | Off | Off |
| Total | – | – | 11.7 | 41,641.84 | – |
| Average | – | – | – | 20,820.92 | – |
| Power | |
| Rack heat source | 41.12 kW |
| Wall heat transfer | 0.46 kW |
| Total cooling load | 41.58 kW |
| Heat density | 729.68 W m−2 |
| Supply air cooling capacity | 41,641.84 W |
| Temperature details | |
| Highest temperature in data center room | 30°C |
| Highest inlet temperature in racks | 20°C |
| Flow through tiles | |
| Maximum flow through a vent tile | 2.102 m3 s−1 |
| Minimum flow through a vent tile | −0.06 m3 s−1 |

aDeviation from mean value=[CRAC heat removal−ave CRAC heat removal]/ave CRAC heat removal.
Table 2.5
CRAC performance report while CRAC of unit 1 is disabled
| CRAC unit name | Average return temperature (°C) | Average supply temperature (°C) | Supply flow rate (m3 s−1) | Heat removal (W) | Deviation from average heat removal (%) |
| Downflow units | |||||
| crac_0 (A, 1) | 19 | 14 | 5.852 | 34,225.34 | 63.5 |
| crac_1 (A, 3) | Off | Off | Off | Off | Off |
| crac_2 (A, 4) | 17 | 16 | 5.852 | 7640.5 | −63.5 |
| Total | – | – | 11.7 | 41,865.84 | – |
| Average | – | – | – | 20,932.92 | – |
| Power | |
| Rack heat source | 41.12 kW |
| Wall heat transfer | 0.7 kW |
| Total cooling load | 41.82 kW |
| Heat density | 733.86 W m−2 |
| Supply air cooling capacity | 41,865.84 W |
| Temperature details | |
| Highest temperature in data center room | 30°C |
| Highest inlet temperature in racks | 19°C |
| Flow through tiles | |
| Maximum flow through a vent tile | 1.768 m3 s−1 |
| Minimum flow through a vent tile | 0.064 m3 s−1 |

Table 2.6
CRAC performance report while CRAC of unit 0 is disabled
| CRAC unit name | Average return temperature (°C) | Average supply temperature (°C) | Supply flow rate (m3 s−1) | Heat removal (W) | Deviation from average heat removal (%) |
| Downflow units | |||||
| crac_0 (A, 1) | Off | Off | Off | Off | Off |
| Downflow units | |||||
| crac_1 (A, 3) | 18 | 14 | 5.852 | 31,138.18 | 48.08 |
| crac_2 (A, 4) | 17 | 16 | 5.852 | 10,917.51 | −48.08 |
| Total | – | – | 11.7 | 42,055.68 | – |
| Average | – | – | – | 21,027.84 | – |
| Power | |
| Rack heat source | 41.12 kW |
| Wall heat transfer | 0.89 kW |
| Total cooling load | 42.01 kW |
| Heat density | 737.18 W m−2 |
| Supply air cooling capacity | 42,055.68 W |
| Temperature details | |
| Highest temperature in data center room | 29°C |
| Highest inlet temperature in racks | 22°C |
| Flow through tiles | |
| Maximum flow through a vent tile | 1.727 m3 s−1 |
| Minimum flow through a vent tile | 0.131 m3 s−1 |

2.6 Conclusions and Recommendations
This chapter focused on improving and developing a new technology for the data center industry. It documented a simplified 3D thermal model through CRAC units and computer racks of the data center that was developed as a concept to demonstrate data center cooling efficiency. It identified the potential high-temperature areas within the computer racks in the data center. The high-temperature areas were found at computer racks at the mid-planes along both the length and width of the data center. Maximum temperatures around 29°C were observed at the three quarter plane along the length of the data center and it was located at the back of the second rack of the data center. This is due to the airflow recirculating from the exhaust side of the computer racks. This study also showed the supply and return temperature contours and the maximum inlet and exit temperatures for the racks in the data center. These temperatures limits were compared with experimental results as well as the ASHRAE guidelines, and all were found to be in good agreement.
No overheated server was found as the inlet temperatures did not exceed 27°C [10]. The low-pressure areas were observed to be surrounding the computer racks in the server zone. Very low pressure (−641.67 to −403.70 Pa) was also found in the CRAC units. The study performed a CRAC failure analysis and found the decreased supply air cooling capacity resulted in an increased average heat removal from the data center when one of the CRAC units was malfunctioning.
The results of this study are expected to contribute in treating Australian data center problems in a more comprehensive and effective way. In particular, this chapter identified the potential high-temperature zone within the computer racks in the data center, and provided a detailed 3D analysis of how cold air moved through the data center. The results also provided the performance analysis of the CRACs, detailed rack-by-rack inlet and exit temperatures and 3D thermal mapping of the data center and racks, highlighting hot zones. This model could be used for data center design to develop a cooling strategy for achieving better thermal performance for Australian industries.
Thermal performance and energy efficiency of data centers could be further improved by considering the closed architecture of water or refrigerant liquid-based cooling techniques and other possible supply and return schemes to achieve better cooling performance. To reduce the entrainment of hot air into the cold aisles, the exhaust could be collected above the hot aisle and ducted back to the CRAC units. The study methodology could also be used further to determine the impact on cooling resources such as equipment layout, air flow rate, floor tiles, heat load distribution, and other supplementary cooling strategies.
Nomenclature
![]() [m] The components of length in x direction
[m] The components of length in x direction
![]() ,
, ![]() [m s−1] The components fluctuating velocity
[m s−1] The components fluctuating velocity
![]() [kg m−1 s−1] Turbulent viscosity
[kg m−1 s−1] Turbulent viscosity
![]() [m2 s−2] Turbulence kinetic energy
[m2 s−2] Turbulence kinetic energy
![]() [kg m−1 s−2] Turbulence kinetic energy due to the mean velocity gradients
[kg m−1 s−2] Turbulence kinetic energy due to the mean velocity gradients
![]() [kg m−1 s−2] Turbulence kinetic energy due to buoyancy
[kg m−1 s−2] Turbulence kinetic energy due to buoyancy
![]() [kg m−1 s−2] The dilatation dissipation term
[kg m−1 s−2] The dilatation dissipation term
![]() [kg m−1 s−2] The turbulent Prandtl number for
[kg m−1 s−2] The turbulent Prandtl number for ![]()
![]() [kg m−1 s−2] The turbulent Prandtl number for
[kg m−1 s−2] The turbulent Prandtl number for ![]()
CFD [–] Computational fluid dynamics
CRAC [–] Computer room air conditioning
ASHRAE [–] The American Society of Heating, Refrigerating and Air-Conditioning Engineers
GUI [–] Graphical user interface