
Modeling and Simulation of Heat and Mass Flow by ASPEN HYSYS for Petroleum Refining Process in Field Application
A.K. Azad1, M.G. Rasul1, M.M.K. Khan1, Sukanta Kumar Mondal2 and Rubayat Islam3, 1School of Engineering and Technology, Higher Education Division, Central Queensland University, Rockhampton, QLD, Australia, 2Department of Chemical Engineering & Polymer Science, Shahjalal University of Science and Technology, Sylhet, Bangladesh, 3Department of Mechanical Engineering, Bangladesh University of Engineering and Technology, Dhaka, Bangladesh
This chapter deals with the heat and mass transfer characteristics of petroleum fluid before decomposition into gasoline, kerosene, naphtha, diesel, etc. A convection–radiation heating furnace has been designed as a heating source of the petroleum fluid and different characteristics of the fluid in various processes of heating and cooling have been observed. The mass flow and phase-changing characteristics of the fluid have been modeled using the ASPEN-HYSYS 3.2 process simulator to investigate the behavior of the fluid. The utility supports and heat recovery units such as heat exchanger, preheater, cooler (water and air), buffer tanks, have been included in the model for the simulation. Optimization of the designated model has been carried out for practical application in petroleum oil distillation.
Keywords
Heat and mass transfer; petroleum fluid; distillation; ASPEN-HYSYS 3.2; optimization
10.1 Introduction
Petroleum is one of the major sources of energy supply, especially in the transport sector, throughout the world. This fuel is a mixture of a number of hydrocarbons such as alkane (paraffins) 30%, cycloalkanes (naphthenes) 49%, aromatic hydrocarbon 15%, and asphaltics 6% by weight [1]. Petroleum fuel can be processed and refined to produce useful products including gasoline, octane, kerosene, diesel, and heating oil or furnace oil, etc. The main objective of this chapter is to discuss modeling and simulation of petroleum-refining process. Petroleum refining is basically a heat and mass flow process in a continuous steady-state condition by separation of products based on their boiling points [2]. The process is called fractional distillation, which is widely used as a separation technology especially in petroleum refineries, petrochemical and chemical plants, natural gas processing and cryogenic air separation plants [3,4]. In other words, fractional distillation is the separation of a mixture into its components or fractions, such as separating chemical compounds by their boiling point by heating them to a temperature at which one or more fractions of the compound vaporize [5]. In most cases, the distillation is operated at a continuous steady state in which new feed is always being added to the distillation column and products are always being removed. Unless the process is disturbed due to changes in feed, heat, ambient temperature, concentration, and the amount of feed being added, then the amount of product removed is normally equal to the amount of feed supplied to the process [6]. Crude oil is processed and refined into more useful products such as petroleum naphtha, gasoline, diesel, asphalt base, heating oil, kerosene, and liquefied petroleum gas [7,8]. The petroleum-refining process mainly consists of a heating furnace or heater and a distillation column as shown in Figure 10.1. The figure also presents the possible fuel products, temperatures, and carbon ranges for a typical distillation process.

The petroleum-refining process consists of some integrated steps such as feed preheating, heating, liquid–gas phase changing, partial fraction, refluxing, heat exchanging of virgin products, cooling, and finally storage of the finish products. The total refining process needs to be simulated and analyzed using different simulation software before practical application. These simulation techniques were initially developed in the 1950s. In 1962, a sugar refinery was simulated by Brooks [9] to analyze the different processes and limitations of the refinery process. The various simulation scopes for refineries were studied by Koenig [10]. Long-term planning and day-to-day planning of crude oil refinery were analyzed by a linear programming technique and the modern operation research was used to discuss the optimization methods. Simulation of the petroleum refinery waste treatment process was studied by Hoffman [11]. The corrosive environment of the oil refinery was simulated and several problems associated with the safety operations in the units were studied by Wu et al. [12]. For optimizing the crude oil operations, a different solution approach was discussed by Reddy et al. [13,14]. Another petroleum oil source is gas condensate which comes from the natural gas processing plant. This is the liquid hydrocarbon (range from C1 to C18) formed during the processing of natural gas [15]. The geochemical properties of gas condensate are described by Dzou and Hughes [16] and Thompson [17]. This gas condensate can be refined in the distillation column to obtain gasoline, kerosene, and diesel products. Detailed study of the distillation column simulation was done by Wagialla and Soliman [18], Swartz and Stewart [19], and Drozdowicz and Martinez [20].
A number of studies are available in the literature on the crude distillation unit (CDU) with reference to refinery planning and scheduling [13,21,22], estimation of product properties [23–25] and process control, modeling, simulation, and optimization [1,26,27]. Optimization of a CDU using a binary feed was carried out by More et al. [26] on the basis of the gross profit instead of the costs inferred by energy and raw materials. An atmospheric distillation process subjected to transient behavior due to changes in the operating conditions can be improved by a suitable control strategy to obtain efficient operations [28]. An expert system was designed by Motlaghi et al. [27] for a CDU to predict the product flow and temperature values by minimizing the model output error by a genetic algorithm framework and maximizing the oil production based on the control parameters.
Virtually no simulation work is available in the literature on designing a cost-effective fractionating column. In the case study presented in this chapter, the two main parts, namely heating furnace and distillation column, in the refining process models have been designed for simulation. The simulated results are validated and optimized by the practical date. The heat and material balance (HMB) for the entire process has been carried out for the model. In the next sections, a detailed discussion will be presented on the heating furnace and distillation column design and its accessories. Then simulation with HMB for the entire process will be covered. Finally, energy uses and its management for this process are discussed.
10.2 Heating Furnace
The heating furnace, or simply heater, is a device used for heating the fluid as phase-changing equipment. It is one of the major parts in petroleum refining process. Different types of heaters are used based on the requirement of the petroleum fluid. This chapter discusses the most efficient and widely acceptable directly fired convection–radiation cylindrical furnace, which is mainly made up of a coil system, steel structure, lining, and burner as shown in Figure 10.2. The coil is constructed from tube and bends by means of welding. The convection coil has three sections: top, middle and bottom.

The steel structure forms the main frame of heating furnace which not only carries the total load, that is, weight of the heater, weight of the coil system and its media oil, the static load of lining and burner, and active loads on the platform, but also carries the wind load and earthquake action. The steel structure is made of various profile steels and steel plates by means of welding. The major material of profile steel is ASTM A36 and that of steel plate is ASTM A283Gr.C. The lining of the radiation section and the stack are all made up of rammed light pouring material. Petroleum oil in the bottom section of the convection coil enters the radial section via the crossover. The middle section of the convection coil is filled with kerosene oil. The convection coil and the radiation tube diameters are 127 and 250 mm, respectively. The petroleum oil changes its liquid phase into gas in the radial tube or coil. The heat and mass flow properties of the petroleum oil into the furnace and some other useful information of the furnace for both convection and radiation section are presented in Table 10.1. The process flow from feed to distillation is expressed below:
Table 10.1
Design parameters of the convection–radiation heating furnace
| Heater section | Radiation | Convection | Convection |
| Total heater absorbed duty, MW | 2.1 | ||
| Heat absorption, MW | 1.5 | 0.5 | 0.1 |
| Medium appellation | Condensate fractionation | Kerosene heating | |
| Flow rate, m3 s−1 | 4.487 | 1.02 | |
| Pressure drop, allowable, kPa | 350 | 100 | |
| Pressure drop, calculated, kPa | 204 | 3.6 | |
| Average radial section heat flux density, W m−2 | 19,582 | ||
| Convection section flux density (bare tube), W m−2 | 31,036 | 5000 | |
| Process fluid mass velocity, kg m−2 s−1 | 432 | 964 | 219 |
| Inlet condition | |||
| Temperature, °C | 143 | 190 | |
| Pressure, kPa g−1 | 462 | 64 | |
| Liquid flow, kg s−1 | 4.487 | 1.02 | |
| Vapor flow, kg s−1 | – | – | |
| Liquid opposite density @ 15°C | 685.8 | 666.3 | |
| Outlet condition | |||
| Temperature, °C | 245 | 199 | |
| Pressure, kPa g−1 | 150 | 60 | |
| Liquid flow, kg s−1 | 0.897 | 0.816 | |
| Vapor flow, kg s−1 | 3.59 | 0.204 | |

Feed→Heat exchanger→Top convection coil→Bottom convection coil→Crossover→Radial section→Distillation column
Flames shoot from the burners in the bottom of the furnace reaching up several meters with temperatures of 1000–1500°C. Most the heat is transferred by radiation into the oil flowing in the radiation section furnace tubes. When the flue gas ascends into the convection chamber, its temperature drops to 700–900°C. Heat in the flue gas is transferred by convection into the oil flowing in the convection chamber furnace tubes. The flue gas cools to 200–450°C and is vented out into atmosphere through the chimney.
The major accessories, namely the burner, blower, and control system, which are needed for safe operation of the heating furnace, are briefly discussed in the following sections.
10.2.1 Burner
Heat needed by the oil in the tubal furnace comes from the combustion of fuel at the burners. Natural gas is used as the fuel with a lower heating value (LHV) of 36,569 kJ m−3. The fuel composition is 96.7% C1, 2.74% C2, 0.19% C3, 0.12% CO2, and 0.25% N2. The type, arrangement, and capacity of burners are vital to the heat load, heat efficiency, and heat intensity on the surface of the furnace tubes. It is also important for uniformity of heating and limiting environmental pollution due to CO2 emission by incomplete combustion [29]. Different types of burners have been developed over the years; some of them are categorized as below.
According to the type of fuel used:
According to the method of ventilation:
A gas burner with natural ventilation is used in this furnace due to the well performance of this combination. The pilot light is set up for the burner’s stable and safe running. The horizontal distance from the burner center line to the tube center is 12.75 cm with a single phase burner. The burner is auto ignited and the flame is detected by ultraviolet rays by the sensor. The combustion occurs in the radiation section and flue gas passes through the convection section of the furnace. The combustion characteristics of the fuel in the furnace are presented in Table 10.2.
Table 10.2
Combustion of the fuel into the furnace
| Combustion design conditions | Radiation section | Convection section |
| Operation cases | Process design conditions | – |
| Types of fuel | Fuel gas (natural gas) | – |
| Excess air, % | 20 | – |
| Calculated heat release (LHV/LCV), MW | 2.56 | – |
| Fuel efficiency calculated (LHV), % | 82 | – |
| Fuel gas temperature, °C | 653 | 256 |
| Fuel gas quantity, kg s−1 | 1 | – |
| Fuel gas mass velocity through convection section, kg s−1 m−2 | 0.68 | – |
| Ambient air temperature, efficiency calculation | 15.6 | – |
The second column of the table shows all relevant information including total heat load, efficiency of the combustion, temperature, and quantity of flue gas, etc., which are important parameters in verifying the proper design of a combustion chamber. The heat released by the gas combustion is transferred by the furnace tube system which is briefly discussed below.
10.2.2 Furnace Tube/Coil System
Furnace tubes are the most important component constituting the heat transfer surface in the furnace. The furnace tube system is interconnected between the tubes. The tube system is designed both for convection and radiation chambers. The tube or coil system design is very important because furnace tubes operate in high temperature and high pressure with corrosive fluids over a long period. The selection of furnace must take account of factors including application temperature, heat resistance, and corrosion resistance of the tube metal. The furnace tube is constructed from steel. The heat resistance of the metal includes the high-temperature oxidation resistance and embrittlement (loss of ductility) resistance of the material.
10.2.3 Furnace Wall System
Furnace wall design could help resist heat loss as well as improve the efficiency of the furnace. It consists of the external protection layer, middle insulation layer, and internal refractory layer. The protection layer is made of steel plate. The middle insulation layer and internal refractory layer comprise the lining of the furnace and are mainly for fire resistance and insulation. The outer surface temperature of the furnace wall is directly related to heat loss and safe protection of operators. The lower the surface temperature, the lower the heat loss, the thicker the furnace wall required, the higher the one-off capital investment. Generally, the surface temperature of the furnace body and the waste heat recovery system does not exceed 80°C, and that of the radiation chamber does not exceed 90°C.
10.2.4 Flue Gas Venting System
Flue gas in the cylindrical furnace is hotter and lighter than the air outside. Therefore, it ascends through the chimney into the atmosphere and establishes negative pressure in the furnace to draw air into the furnace naturally. The draught of the chimney is related to the temperature difference between the flue gas and outside air as well as the height of the chimney. The higher temperature difference creates higher draught of air flow inside the furnace. In order to ensure proper draught of the chimney, its diameter and height must be calculated according to volume, average temperature, and velocity of the flue gas. Dampers are installed in the chimney to control draught by adjusting position to ensure the designed negative pressure in the furnace chamber is achieved. Generally, for safe operation, the furnace chamber pressure is maintained at a value less than −2 to 3 mm water column to prevent flame bursting out when the fire watch door is opened to observe the chamber.
10.2.5 Blower, Fire Watch Door, Explosion-Proof Door
The blower and associated air passages are designed for the purging of flammable and combustible gases inside the furnace before start-up and shutdown. The blower remains at standby during normal operation. The fire watch door is used to observe flame conditions across the burner in the furnace chamber. The explosion-proof door is a safety device for the furnace. It works when a sudden high pressure is created inside the chamber which then pushes and opens the door. Once the pressure is released the door is closed automatically by its own weight.
10.2.6 Control System
The control cabinet of a heating furnace adopts positive drafts of compressed air and explosion-proof cabinet with EXDIIBT4 as explosive grade. It has a touch screen which is equipped with an operational panel. The cabinet has a built-in programmable logic control (PLC). Its function is data collection and data calculation for field instrument and input and output of variables, which satisfies explosive requirements for the field user. The heating furnace works on 24-h operation with an automatic control. The function of the control system is briefly discussed below.
• The control system is capable of implementing auto load adjustment according to the temperature change of the heated condensate oil. Then the heater adjusts heat load automatically to guarantee the outlet temperature within ±1°C change. The control system also regulates volumes of fuel gas and change air.
• Self-interlock can also be realized in an abnormal work state.
• All parameters are automatically tested and controlled by the control system. The control system can also be used as an alarm. Communication between the control cabinet and the control system is through a RS485 interface with a Modbus protocol. All the operational parameters, status, and alarm signals are gathered by the PLC in the control cabinet. The emergency shutdown is installed into the central control cabinet which makes the whole system more safe and reliable.
• Pre-alarm, alarm to shut down the heater, mal-function display, and lock during abnormal work status can be done from the control cabinet.
• The malfunction shutdown feature: the system automatically shuts down the heater for protection upon occurrence of any of the following alarms:
– low volume of condensate oil inlet alarm,
– high temperature of condensate oil outlet alarm,
– low/high pressure of fuel gas alarm,
– burner failure (low fuel gas pressure or blowout of the flame),
10.2.7 Furnace Drying Technique
A newly built or an overhauled furnace lined with refractory bricks or light refractory cement on the furnace should initially undergo a drying process and be kept dry to avoid cracking. Drying is not necessary for a furnace lined with ceramic fiber blankets on the furnace wall. The purpose of drying is to remove moisture in the refractory of the furnace wall and sinter the refractory mix. It can prevent moisture from significant vaporization, resulting in expansion, distortion, cracking, and even collapse of the lining during sharp temperature rises in the furnace chamber at start up. In addition, drying is used to test and assess all components, accessories, and pipeline loads of the furnace. The standard furnace drying curve is presented in Figure 10.3.

The procedure for furnace drying before full operation is briefly discussed below.
• Furnace drying operation can only be conducted after natural ventilation for more than 5 days with all manholes, explosion doors, and flue gas duct dampers open.
• In the beginning of furnace drying, the flue gas duct damper should be maintained at about one-third valve opening. When the furnace chamber temperature rises, the opening should be slightly increased.
• Steam is passed into the furnace tube to warm up the furnace. When the furnace chamber temperature reaches 130°C, the burners maintain furnace drying at a constant temperature.
• When the furnace is dried, fuel gas should be used and ignited diagonally to ensure uniform temperature distribution in the furnace chamber.
• During furnace drying, the temperature should rise at a constant rate. The speed of temperature rise and fall shall follow the furnace drying curve shown in Figure 10.3. Furnace wall conditions should be observed for a certain period of time (in every 2 h).
• During furnace drying, the temperature increase with time should be recorded and furnace drying curve can be drawn by following the above mentioned procedure.
• The furnace temperature needs to drop at 20°C per hour. This can be achieved by controlling the fuel flow rate. When the temperature drops to 250°C the burner should be stopped and the furnace should be closed. When the temperature decreases to 100°C natural ventilation is provided.
Inspection is needed after furnace drying to check for any cracks in bricks or shedding of the refractory lining inside the furnace. Bending of steel frames and hangers, distortion of furnace tubes, cracks in the fire pan, and sinking of foundation should also be checked for. Any cracking defects with a width larger than 3 mm and a depth larger than 5 mm should be repaired. Any void in the furnace system and steel plate separation inside the chamber should be fully repaired.
10.3 Distillation Unit
The distillation unit (DU) shown in Figure 10.4 is the first processing unit in virtually all petroleum refineries. It distils the incoming crude oil into various fractions of different boiling ranges, each of them is then processed further in the other refinery processing units [30]. The DU is often referred to as the atmospheric distillation unit because it operates at near atmospheric pressure [31]. Varieties of products are obtained from fractionation of petroleum liquid hydrocarbon. Heavy parts are used as diesel whereas the lighter parts are divided into different fractions for various uses. A distillation column is used for the separation of different fractions of condensate [32]. One distillation column is sufficient for producing three products [33].

10.4 Simulation and Optimization of the Refining Processes
Several software packages have been developed for the petroleum industries for simulating and optimizing the refining processes. ASPEN™ HYSYS is one that is widely used. ASPEN™ HYSYS performs the oil distillation calculation through stage-by-stage calculations. The calculations are done by generating pseudo-components from the ASTM D86 data as the inputted properties [34]. ASPEN™ HYSYS contains an oil manager which organizes the data for the pseudo-components separately. It has an efficient workflow for process design, equipment sizing, and preliminary cost estimation [35].
10.4.1 ASPEN™ HYSYS Working Phenomena
ASPEN™ HYSYS provides a very flexible and easy-to-use distillation column modeling environment. Additionally, the interactive nature of HYSYS enables users to build and use their models quickly and effectively. ASPEN™ HYSYS offers a comprehensive thermodynamic foundation for accurate calculation of physical properties, transport properties, and phase behavior for the oil, gas, and refining industries. The comprehensive library of unit operation models includes distillation, reactors, heat transfer operation, rotating equipment, controllers, and logical operations in both the steady state and dynamic environments [36,37].
There are two modes used in simulation, steady-state mode and dynamic mode [38]. Initially, steady-state process simulation was used. This mode performs a mass and energy balance of a stationary process (process in an equilibrium state) but any changes over time had to be ignored [39]. Dynamic simulation is an excellent innovation of process simulation where time-dependence is built into the models via a derivative of the accumulation of mass and energy equation [40]. The advent of dynamic simulation means that the time-dependent simulation description, prediction, and control of real processes in real time have become possible. This includes the procedure of starting up and shutting down a plant, changes of conditions during a reaction, holdups, thermal changes and so one. Dynamic simulations require more calculating time, which is mathematically more complex than a steady-state simulation. It can be seen as a multiply repeated steady-state simulation (based on a fixed time step) with constantly changing parameters [41,42].
10.4.2 Techniques Used for This Simulation
Process simulation is a model-based representation of chemical, physical, biological, and other technical processes and unit operations in software [43]. Heat and material balance (HMB) equations are used in HYSYS for simulation. The specific algorithm is needed to solve equations of conservation of mass and energy. For example, in a distillation unit, heat and mass balance is done from tray to tray. Process simulation is used for the design, development, analysis, and optimization of technical processes used in chemical and petro-chemical process industries. It can also be used in power plants and other similar process industries.
10.4.3 Basic Assumptions
Process simulation needs some basic assumptions to run the simulation to determine the HMB as well as the energy balances around a unit operation. The simulators calculate the product condition depending on a given feed condition [44]. Some variables are assumed based on the recommended practice. Assumptions are: (i) characteristic of the fluid flow is turbulent, (ii) all pressures must be calculated based on the gage pressure, (iii) inlet feed and products outlet must be the same, (iv) flow rate must be uniform and continuous and (v) the overall process is a closed thermodynamic system. For example, to simulate the distillation column, it is necessary to define the column temperature, pressure, percentage of final products, and the feed flow rates, etc. to calculate unknown variables such as the number of trays required, the condition of each stage, the final products flow rate, etc. [45].
10.4.4 Simulation for the Case Study Plant
The case study presented in this chapter was the simulation of a 3000 barrel per day (BPD) capacity natural gas condensate fractionation plant. True boiling point (TBP) analysis was done for the raw condensate in the laboratory, which is one of the base inputs for this simulation. The condensate feed flow rate of 3000 BPD was considered. After distillation, three main products (gasoline, kerosene, and diesel) were drawn from the petroleum crude condensate. The case study industrial data were used in the simulation environment. The fluid package and the method used in the simulation are presented in Table 10.3.
Table 10.3
Design basis for simulation by HYSYS
| Fluid package | Peng–Robinson |
| Method of simulation | Pseudo-component generation and plate-by-plate calculation |
| Properties generation | HYSYS properties |
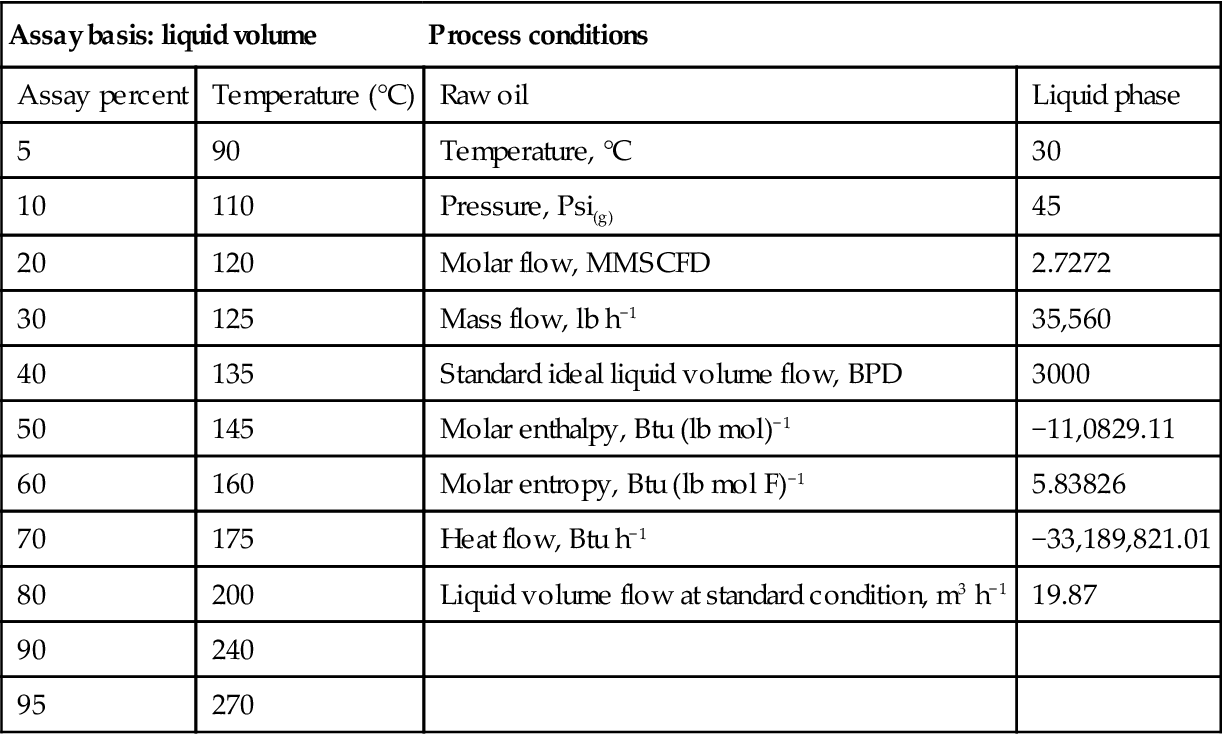
The fluid package Peng–Robinson which was used for this simulation (Table 10.3) has the capability of handling hypothetical pseudo-components. For this reason, it is widely used for refinery simulations. The method of simulation is pseudo-component generation and plate-by-plate calculation from the “TBP” or “ASTM D86” input data. The HYSYS solver used different numerical methods for simulation. The selected method for this simulation is HYSIM inside-out, which is suitable for most cases. From property generation, two databases are used for ASPEN™ HYSYS 3.2, namely HYSYS properties and ASPEN properties. The ASTM D86 data obtained from the refinery laboratory for condensate that were used as input for the oil manager in HYSYS are shown in Table 10.4.
Table 10.4
Inputted data to oil manager and basis for simulation
| Assay basis: liquid volume | Process conditions | ||
| Assay percent | Temperature (°C) | Raw oil | Liquid phase |
| 5 | 90 | Temperature, °C | 30 |
| 10 | 110 | Pressure, Psi(g) | 45 |
| 20 | 120 | Molar flow, MMSCFD | 2.7272 |
| 30 | 125 | Mass flow, lb h−1 | 35,560 |
| 40 | 135 | Standard ideal liquid volume flow, BPD | 3000 |
| 50 | 145 | Molar enthalpy, Btu (lb mol)−1 | −11,0829.11 |
| 60 | 160 | Molar entropy, Btu (lb mol F)−1 | 5.83826 |
| 70 | 175 | Heat flow, Btu h−1 | −33,189,821.01 |
| 80 | 200 | Liquid volume flow at standard condition, m3 h−1 | 19.87 |
| 90 | 240 | ||
| 95 | 270 | ||
The simulation model is shown in Figure 10.5, which illustrates the total simulation process in this study. The condensate fractionation unit is composed of heat exchangers, a distillation unit, and kerosene stripper. There are three products, namely gasoline or motor spirit, kerosene, and diesel, which can be extracted from the condensate. The top product is gasoline and it is the lightest of all. It is used as a thinner for paints. Kerosene was the side draw from the column. It is composed mostly of medium heavy oil components. Diesel is the bottom product of the column and is the heaviest of all. The raw petroleum condensate is used as a feed to the preheater of the heat exchanger. At first, heat exchanger (E-100) is preheated by petrol products and then it goes to another heat exchanger (E-101) and is heated up by kerosene products. Finally, the feed is preheated by diesel products before entering into the heating furnace. In the heater, the liquid changes its phase to gaseous and goes into the distillation unit as feed.

In the distillation unit, due to the different relative volatilities of different components of petroleum, condensate is divided into three products and waste petroleum gas with a carbon range from C1 to C4. Heat transfer and mass transfer occur at different stages. The gasoline forms at the top of the distillation unit where temperature ranges between 120°C and 130°C and pressure is between 35–40 Psi (gage pressure). Kerosene as a side product is produced at 198°C and 9.635 Psi(g) and the remaining is diesel as a bottom product produced at 250°C and 89 Psi(g). These hot products contain a great deal of heat energy which is used to preheat the feed to save energy. Finally, the finished products need to be cooled below 40°C before storage in the separate tanks. The final product storage temperature is achieved by water cooling heat exchangers E-103, E-104, and E-105, respectively. On the other hand, the feed condensate is be preheated by these hot products in heat exchangers E-100, E-101, and E-102, respectively. The top product in vapor form changes its phase from vapor to liquid by air cooling and storage in the reflux tank. The reflux is used to maintain the distillation unit top temperature and pressure as well as the quality of the products. About 20% (depending on temperature fluctuation) of the reflux is returned to the distillation unit and the other portion is cooled as a finished product.
The feed temperature rose to about 140–150°C inside the heat exchangers remaining in liquid form before entering the direct heater furnace (Figure 10.5). The heater temperature ranges from 650°C to 700°C to change the phase of the feed from liquid to gas at about 220–250°C. The direct heater furnace is used for the simulation to supply adequate heat energy in the column feed stream. The amount of fuel for the heater is adjusted automatically to keep the feed temperature fixed. The air–fuel ratio is also automatically adjusted for proper combustion of the fuel into the heater. The heater is one of the main functioning parts of the distillation process. The heater efficiency directly affects the product quality and the energy efficiency of the entire process.
The distillation unit (Figure 10.5) contains tray section, condensers, side strippers, heat exchangers, cooler, etc., the main utilities used in the simulation. HYSYS has a number of pre-built column sub-flow sheet templates which can be used as a typical column and then is customized as required. In the column the condensate feed for tray number 42, kerosene is withdrawn from tray number 21 and the kerosene reflux was sent to tray number 20 (Figure 10.6). Diesel and petrol were withdrawn from the bottom and top of the column respectively. The column environment heat and mass balances details are presented in Table 10.5 and the process flow diagram (PFD) is presented in Figure 10.6.
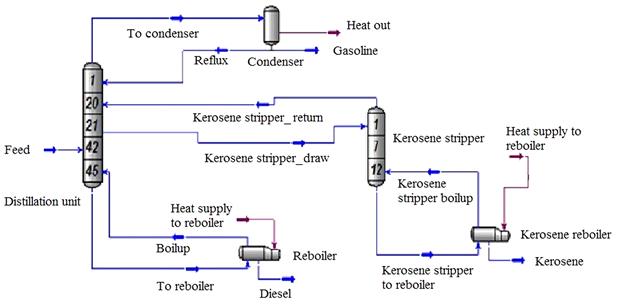
Table 10.5
Heat and mass balance of the distillation unit and kerosene stripper of the simulation
| Distillation unit | Reflux | Condensate | Reboiler | Diesel | Feed | Gasoline |
| Vapor fraction | 0.0000 | 1.0000 | 0.0000 | 0.0000 | 0.4023 | 0.0000 |
| Temperature, °C | 102.9 | 129.8 | 254.1 | 269.7 | 180.0 | 102.9 |
| Pressure, Psi(g) | 6.000 | 6.000 | 14.000 | 14.00 | 30.00 | 6.000 |
| Molar flow, MMSCFD | 3.782 | 5.672 | 3.507 | 0.406 | 2.727 | 1.891 |
| Mass flow, lb h−1 | 4.122e+004 | 6.183e+004 | 6.534e+004 | 8416 | 3.556e+004 | 2.061e+004 |
| Liquid volume flow, BPD | 3600 | 5400 | 5218 | 660.0 | 3000 | 1800 |
| Heat flow, Btu h−1 | −3.602e+007 | −4.409e+007 | −4.642e+007 | 5.834e+007 | −2.676e+007 | −1.801e+007 |
| Kerosene stripper | Boilup | KS_draw | KS_return | Kerosene | KS_biolup | KS_reb |
| Vapor fraction | 1.0000 | 0.0000 | 1.0000 | 0.0000 | 1.0000 | 0.0000 |
| Temperature, °C | 2.697 | 180.1 | 182.9 | 198.0 | 198.0 | 195.2 |
| Pressure, Psi(g) | 14.000 | 9.636 | 9.636 | 9.636 | 9.636 | 9.636 |
| Molar flow, MMSCFD | 3.101 | 0.7113 | 0.2805 | 0.4308 | 0.3231 | 0.7539 |
| Mass flow, lb h−1 | 5.692e+004 | 1.033e+004 | 3792 | 6534 | 4770 | 1.130 e+004 |
| Liquid volume flow, BPD | 4558 | 859.2 | 319.2 | 540.0 | 396.0 | 936.0 |
| Heat flow, Btu h−1 | −3.338e+007 | −8.191e+006 | −2.535e+006 | −5.056e+006 | −3.125e+006 | −8.781e+006 |

The screenshot of column simulation is shown in Figure 10.7. The column profiles can be checked by selecting the “performance” tab in the column environment and then selecting “plots” from the menu on the left and “composition” from the list of possible plots. The trays can be sized in HYSYS using the tray sizing utility (from the tools menu via tools/utilities/tray sizing). The bubble cap trays are selected with the default spacing of 60.96 cm with other default parameters. The column diameter was calculated to be 150 cm by the software. The data on column size, number of trays, re-boiler, and condenser duty can then be extracted from the simulation.

The selection of tray type is an important decision both for efficient distillation and the economic point of view. There are different types of trays available, including sieve or perforated tray, valve tray, bubble cap tray, chip tray, double flow tray, baffle tray for application in distillation industries [46]. Bubble cap trays were selected in this simulation, due to their higher efficiency of about 80% in petrochemical applications (Figure 10.8). Bubble cap calculations are based on the method described in design of equilibrium stage processes by Bufford D. Smith [47]. The number of trays required for the distillation is calculated by the simulator according to the requirement of the finished product.

It was found that 45 bubble cap trays were required in order to achieve vapor–liquid equilibrium for efficient distillation; the simulation results are presented in Table 10.6. Each row of the table shows the conditions, namely pressure, temperature, liquid–vapor flow rate, etc. of a particular tray inside the column. These will be used for the validation of the simulation in Table 10.8.
Table 10.6
Simulation results for process conditions in different trays in the distillation unit and kerosene stripper
| Description | Stage | Pressure (Psi(g)) | Temperature (°C) | Net liquid (MMSCFD) | Net vapor (MMSCFD) |
| Condenser | Vapor space | 6.0 | 102.0 | 3.8 | 0.0 |
| 1_Distillation unit | Tray no. 1 | 6.0 | 135.0 | 3.7 | 5.7 |
| 2_Distillation unit | Tray no. 2 | 6.2 | 142.1 | 3.7 | 5.6 |
| 3_Distillation unit | Tray no. 3 | 6.4 | 149.0 | 3.7 | 5.6 |
| 4_Distillation unit | Tray no. 4 | 6.5 | 153.3 | 3.6 | 5.6 |
| 5_Distillation unit | Tray no. 5 | 6.7 | 156.4 | 3.6 | 5.5 |
| 6_Distillation unit | Tray no. 6 | 6.9 | 158.8 | 3.6 | 5.5 |
| 7_Distillation unit | Tray no. 7 | 7.1 | 160.7 | 3.5 | 5.5 |
| 8_Distillation unit | Tray no. 8 | 7.3 | 162.3 | 3.5 | 5.4 |
| 9_Distillation unit | Tray no. 9 | 7.5 | 163.8 | 3.5 | 5.4 |
| 10_Distillation unit | Tray no. 10 | 7.6 | 165.1 | 3.5 | 5.4 |
| 11_Distillation unit | Tray no. 11 | 7.8 | 166.4 | 3.5 | 5.4 |
| 12_Distillation unit | Tray no. 12 | 8.0 | 167.6 | 3.4 | 5.4 |
| 13_Distillation unit | Tray no. 13 | 8.2 | 168.7 | 3.4 | 5.3 |
| 14_Distillation unit | Tray no. 14 | 8.4 | 169.9 | 3.4 | 5.3 |
| 15_Distillation unit | Tray no. 15 | 8.5 | 171.0 | 3.4 | 5.3 |
| 16_Distillation unit | Tray no. 16 | 8.7 | 172.2 | 3.4 | 5.3 |
| 17_Distillation unit | Tray no. 17 | 8.9 | 173.4 | 3.3 | 5.3 |
| 18_Distillation unit | Tray no. 18 | 9.1 | 174.7 | 3.3 | 5.2 |
| 19_Distillation unit | Tray no. 19 | 9.3 | 176.2 | 3.3 | 5.2 |
| 20_Distillation unit | Tray no. 20 | 9.5 | 178.4 | 3.2 | 5.1 |
| 21_Distillation unit | Tray no. 21 | 9.6 | 180.1 | 2.4 | 4.8 |
| 22_Distillation unit | Tray no. 22 | 9.8 | 185.2 | 3.8 | 4.7 |
| 23_Distillation unit | Tray no. 23 | 10.0 | 197.4 | 3.9 | 3.4 |
| 24_Distillation unit | Tray no. 24 | 10.2 | 205.0 | 3.9 | 3.4 |
| 25_Distillation unit | Tray no. 25 | 10.4 | 209.6 | 4.0 | 3.5 |
| 26_Distillation unit | Tray no. 26 | 10.5 | 212.8 | 4.0 | 3.6 |
| 27_Distillation unit | Tray no. 27 | 10.7 | 215.3 | 4.0 | 3.6 |
| 28_Distillation unit | Tray no. 28 | 10.9 | 217.5 | 4.0 | 3.6 |
| 29_Distillation unit | Tray no. 29 | 11.1 | 219.5 | 4.0 | 3.6 |
| 30_Distillation unit | Tray no. 30 | 11.3 | 221.3 | 4.0 | 3.6 |
| 31_Distillation unit | Tray no. 31 | 11.5 | 223.0 | 4.0 | 3.6 |
| 32_Distillation unit | Tray no. 32 | 11.6 | 224.6 | 4.0 | 3.6 |
| 33_Distillation unit | Tray no. 33 | 11.8 | 226.2 | 4.0 | 3.6 |
| 34_Distillation unit | Tray no. 34 | 12.0 | 227.6 | 4.0 | 3.6 |
| 35_Distillation unit | Tray no. 35 | 12.2 | 229.1 | 4.0 | 3.6 |
| 36_Distillation unit | Tray no. 36 | 12.4 | 230.4 | 4.0 | 3.6 |
| 37_Distillation unit | Tray no. 37 | 12.5 | 231.8 | 4.0 | 3.6 |
| 38_Distillation unit | Tray no. 38 | 12.7 | 233.2 | 4.0 | 3.6 |
| 39_Distillation unit | Tray no. 39 | 12.9 | 234.7 | 4.0 | 3.6 |
| 40_Distillation unit | Tray no. 40 | 13.1 | 236.4 | 4.0 | 3.6 |
| 41_Distillation unit | Tray no. 41 | 13.3 | 238.2 | 4.0 | 3.6 |
| 42_Distillation unit | Tray no. 42 | 13.5 | 240.5 | 3.9 | 3.6 |
| 43_Distillation unit | Tray no. 43 | 13.6 | 243.5 | 3.9 | 3.5 |
| 44_Distillation unit | Tray no. 44 | 13.8 | 247.5 | 3.8 | 3.5 |
| 45_Distillation unit | Tray no. 45 | 14.0 | 254.1 | 3.5 | 3.4 |
| Kerosene stripper | |||||
| 1_K.Stripper | S. Tray no. 1 | 9.6 | 182.9 | 0.7 | 0.3 |
| 2_K.Stripper | S. Tray no. 2 | 9.6 | 185.1 | 0.7 | 0.3 |
| 3_K.Stripper | S. Tray no. 3 | 9.6 | 186.7 | 0.7 | 0.3 |
| 4_K.Stripper | S. Tray no. 4 | 9.6 | 187.9 | 0.7 | 0.3 |
| 5_K.Stripper | S. Tray no. 5 | 9.6 | 188.9 | 0.7 | 0.3 |
| 6_K.Stripper | S. Tray no. 6 | 9.6 | 189.8 | 0.7 | 0.3 |
| 7_K.Stripper | S. Tray no. 7 | 9.6 | 190.5 | 0.7 | 0.3 |
| 8_K.Stripper | S. Tray no. 8 | 9.6 | 191.3 | 0.7 | 0.3 |
| 9_K.Stripper | S. Tray no. 9 | 9.6 | 192.1 | 0.8 | 0.3 |
| 10_K.Stripper | S. Tray no. 10 | 9.6 | 192.9 | 0.8 | 0.3 |
| 11_K.Stripper | S. Tray no. 11 | 9.6 | 193.9 | 0.8 | 0.3 |
| 12_K.Stripper | S. Tray no. 12 | 9.6 | 195.2 | 0.8 | 0.3 |

10.4.5 Heat and Material Balance
The HMB of the whole stream in the simulation plant is presented in Table 10.8. This table also presents optimization results for the entire process simulation. The process has been optimized by the heat and material balancing the whole process, including heating furnace, reflux, feed and product storage, etc. during simulation by software. The economic optimum steady-state operating conditions for a petroleum oil distillation process are determined using a tray-to-tray model. This model is used to evaluate the steady-state operation achieved with several multivariable process control designs [48] (Table 10.7).
Table 10.7
HMBs for the entire process streams
| Items description | Gasoline | Diesel | Reflux | Kerosene | Raw oil | 2 |
| Vapor fraction | 0.0000 | 0.0000 | 0.0000 | 0.0000 | 0.0000 | 0.0000 |
| Temperature, °C | 102.9 | 269.7 | 102.9 | 198.0 | 30.00 | 50.00 |
| Pressure, Psi(g) | 6.000 | 14.00 | 6.000 | 9.636 | 45.00 | 40.00 |
| Molar flow, MMSCFD | 1.891 | 0.406 | 3.782 | 0.4308 | 2.727 | 2.727 |
| Mass flow, lb h−1 | 2.061e+004 | 8416 | 4.122e+004 | 6534 | 3.556e+004 | 3.556e+004 |
| Liquid volume flow, BPD | 1800 | 660.0 | 3600 | 540.0 | 3000 | 3000 |
| Heat flow, Btu h−1 | −1.801e+007 | −5.834e+006 | −3.602e+007 | −5.056e+006 | −3.319e+007 | −3.262e+007 |
| Gasoline 2 | 3 | Kerosene 2 | 4 | Diesel 2 | Feed | |
| Vapor fraction | 0.0000 | 0.0000 | 0.0000 | 0.0000 | 0.0000 | 0.4023 |
| Temperature, °C | 72.99 | 70.00 | 107.7 | 90.00 | 204.0 | 180.0 |
| Pressure, Psi(g) | 1.000 | 35.00 | 4.636 | 30.00 | 9.000 | 30.00 |
| Molar flow, MMSCFD | 1.891 | 2.727 | 0.4308 | 2.727 | 0.4057 | 2.727 |
| Mass flow, lb h−1 | 2.061e+004 | 3.556e+004 | 6534 | 3.556e+004 | 8416 | 3.556e+004 |
| Liquid volume flow, BPD | 1800 | 3000 | 540.0 | 3000 | 660.0 | 3000 |
| Heat flow, Btu h−1 | −1.858e+007 | −3.203e+007 | −5.651e+006 | −3.140e+007 | −6.460e+006 | −2.676e+007 |
| Air | Flue gas | Fuel | Gasoline storage | Kerosene storage | Diesel storage | |
| Vapor fraction | 1.0000 | 1.0000 | 1.0000 | 0.0000 | 0.0000 | 0.0000 |
| Temperature, °C | 30.00 | 304.1 | 30.00 | 30.00 | 30.00 | 30.0 |
| Pressure, Psi(g) | 10.00 | 10.00 | 10.00 | −4.000 | −0.3636 | 4.000 |
| Molar flow, MMSCFD | 1.464 | 1.601 | 0.1315 | 1.891 | 0.4308 | 0.4057 |
| Mass flow, lb h−1 | 4638 | 4887 | 248.6 | 2.061e+004 | 6534 | 8416 |
| Liquid volume flow, BPD | 367.1 | 402.3 | 54.75 | 1800 | 540.0 | 660.0 |
| Heat flow, Btu h−1 | 9159 | −5.106e+006 | −4.717e+005 | −1.932e+007 | −6.080e+006 | −7.804e+006 |

Table 10.8 shows the comparison of the real plant data with the simulated plant data. The simulated volumetric flow rates with their corresponding temperatures for gasoline, kerosene, and diesel products are 1800, 540, and 660 BPD, whereas in real plants the product flow rates were 1800, 530, and 670 BPD, respectively. The comparison found no significant difference on the key parameters such as temperature, pressure, feed flow rate, etc. between the simulated and the real plants. Therefore, the simulation results are considered valid.
Table 10.8
Validation of the simulation results with real plant data
| Parameters | Units | Simulated plant | Real plant |
| Distillation unit top temperature | °C | 135 | 137 |
| Distillation unit pressure | Psi(g) | 6 | 6 |
| Distillation unit bottom temperature | °C | 254.1 | 255 |
| Distillation unit bottom pressure | Psi(g) | 14 | 13 |
| Distillation unit temperature at tray no. 21 | °C | 180.1 | 180 |
| Kerosene stripper temperature | °C | 195 | 192 |
| Kerosene stripper pressure | Psi(g) | 9.6 | 10 |
| Distillation unit feed temperature | °C | 180 | 180 |
| Distillation unit feed pressure | Psi(g) | 30 | 30 |
| Gasoline product flow rate | BPD | 1800 | 1800 |
| Kerosene product flow rate | BPD | 540 | 530 |
| Diesel product flow rate | BPD | 660 | 670 |
| Products storage temperature | °C | 30 | 30 |

10.4.6 Energy Usage Analysis
Energy usage analysis is important to understand the energy scenario in petrochemical process industries. For this reason, energy auditing is needed for efficient running of the process plant [49]. The general energy distribution in the petrochemical industry is presented in Figure 10.9. The main energy consumption is in the form of heat and power (electricity). The types of energy used by the industry are presented in Table 10.9.

Table 10.9
Types of energy used by the petrochemical industries
| Process | Type of fuel/energy |
| Raw materials pumping and storing | Electricity |
| Feedstock preheating | Heat energy |
| Heating furnace running | Natural gas |
| Power generation for processing running | Natural gas |
| Product pumping | Electricity |
| Product cooling | Electricity |
| Product testing in laboratory | Natural gas and electricity |
| Others (AC for equipment, fan, lighting, etc.) | Electricity |
In petrochemical process industries, about 80–85% of the energy used is consumed by the furnace for heating and 15–19% of the energy is consumed by the gas generator to produce power for the process run. The remaining 1% energy is used in the laboratory for testing of the finished products [50].
10.4.7 Energy Management
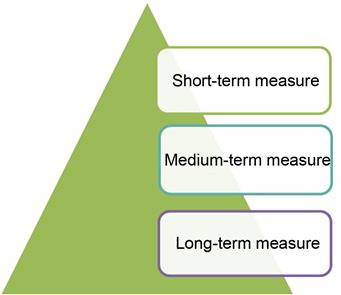
Rationalization of an industrial operation by using the above-mentioned objectives may be quite complex for an existing industrial system. However, in order to save energy the following timeframe measures can be implemented, depending on the size of the investment and the cost-effectiveness as a short-term, medium-term, and long-term measure as shown in Figure 10.10. These three terms are briefly discussed below.
10.4.7.1 Short-Term Measures
In the short-term, schedule maintenance for energy conservation is needed. Under this term no new investment is required except for the increased maintenance task. This only leads to increase labor costs for maintenance. The main objective is to improve the energy efficiency of the equipment by enforcing a better schedule for the maintenance program. By using exhaust gas analyzer for improving combustion efficiency in the furnace/heater and power generator, it is possible to save more than 5% fuel consumption [50]. The associated work is the better adjustment of the inlet air quality to improve combustion efficiency. Regular cleaning and reduction of pressure drop can improve the heat transfer efficiency of the heat exchangers [49].
10.4.7.2 Medium-Term Measures
A small investment is required in the medium-term measure on the energy consumption network. It neither changes the principle of operation nor the general engineering aspect. The objective is to reduce the consumption of high-quality energy and instead use low-quality energy, some changes are done on the existing network with additional investment. For example, installation of the heat recovery unit is to reheat or preheat the feedstock [50]. This will reduce heat loss and save on the fuel consumption of the main heating source. Inefficient equipment can be replaced by more efficient ones with a small investment. Repair of all leakages (liquid, gas, and heat) and proper insulation or re-insulation could save energy as well as money. Waste reduction and waste recovery for reuse can increase productivity and save energy [51].
10.4.7.3 Long-Term Measures
Long-term measures require large investments on the interconnections of the processes. This can be a combination of various measures. Management and association of the two energy sources, such as cogeneration of heat and power, can enable more efficient utilization of fuel resources [51]. The petroleum processing industry requires both heat and power for continuing the process run. By-products reprocessing unit instillation is a large investment that will increase multi-products, reduce loss of energy, and make healthy gross profits as well [51]. Instillation of a power line will allow the supply excess power to grid or other associated organizations to save excess power for process run [52]. Very large investments on the principle of the process are also included in this term. Though the finished product is not changed, the process itself is modified or redesigned [53]. Older technologies are replaced by new and advanced technologies which are the major contributing factor for lower specific energy consumption, especially in the case of the energy-intensive sector [54].
10.5 Conclusion
This chapter presents the modeling and simulation of heat and mass transfer characteristics of the petroleum fluid before decomposing it into gasoline, kerosene, diesel, etc. in the distillation column. A convection–radiation heating furnace was used as a heating source for the petroleum fluid. The detailed design of the heating furnace and distillation unit for safely running the process has been briefly discussed. The heat and mass flow, with phase-changing characteristics of the fluid, was simulated using the ASPEN™ HYSYS process simulator. The PFD was developed for the entire process. The distillation unit and kerosene stripper have been properly heat- and mass-balanced, which have a positive impact on simulation results. These simulation results are validated with the real plant data, where almost all the simulated parameters show a reasonable agreement. The entire refining process is accurately solved using heat and mass balance equations. The fluid flow package and bubble cap tray were correctly selected for efficient process simulation. The energy distribution and balancing of energy usage for the designated process plant have been analyzed and discussed. The aspects of efficient energy management techniques have been briefly discussed for practical application in petroleum refining industries.