Chapter 12. Effective Diagramming
This chapter illustrates how you can create effective class diagrams. The diagrams presented in the reference section of this book have few elements. Those diagrams illustrate individual diagram elements, clear of any clutter; they aren’t meant to illustrate diagram types. The diagrams in the reference section don’t represent systems that you will encounter in real life. This final chapter illustrates some techniques you can use to make real-life diagrams convey your thoughts more effectively.
Wallpaper Diagrams
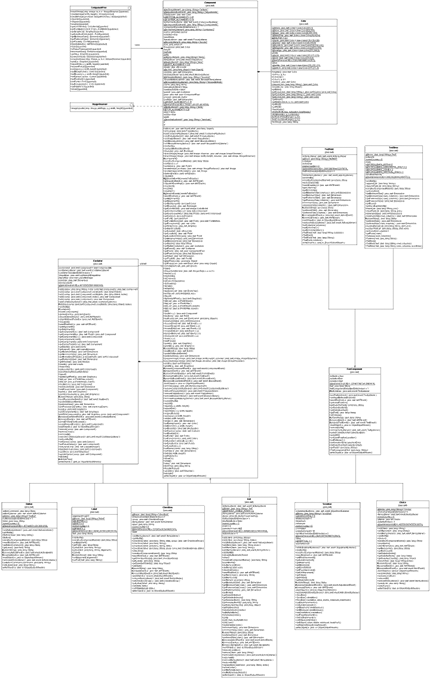
The classic novice class diagram displays all classes, attributes, operations, relationships, and dependencies for a system. As the number of classes grows, the diagram becomes huge and unmanageable. Imprudent reverse engineering drags in clutter. Figure 12-1 diagrams just a very small part of the Java Abstract Windowing Toolkit (AWT). You will not be able to read the diagram because it normally prints as an unwieldy nine pages. You’re paying for the paper, so the diagram is shown here in a greatly condensed form.
Effective writers convey ideas through language constructs: sentences and paragraphs organize text, details reinforce ideas, and true but irrelevant facts are omitted. Modelers desiring to convey an idea—be it a structural overview, a pattern implementation, a detailed subsystem, or the detailed context of one class—must also use economy and focus. Figure 12-1 has neither economy nor focus. The diagram throws a mass of insignificant detail at readers, leaving the burden of understanding on them. It is a false economy to think that one diagram can present all the information of a multidimensional model.
Modeling Versus Diagramming
Before making Figure 12-1 more effective, let’s distinguish modeling from diagramming. The act of modeling furthers your understanding of the system under study. You use diagrams to elaborate the model. You confirm the model integrity with new views. You organize your understanding. You extend your knowledge. You challenge your understanding. By seeing the known, you can infer, dictate, or investigate the yet to be known. Figure 12-1 might be seen during modeling, but only as an intermediate step; such diagrams don’t demonstrate UML’s true power to communicate.
Diagramming, on the other hand, expresses understanding for the benefit of others. You may be a domain expert by background, or you may have recently synthesized expertise from modeling with domain experts. You have worked hard to understand, and to put your understanding into a model, perhaps over weeks or months; now you must make that understanding immediately accessible to your readers. Your model should be concise so that they understand. If there is to be contention, let it be about real ideas, not ambiguity. Diagramming reveals to others what you discover through modeling.
It doesn’t matter whether you formally create a model in a modeling tool, whether the model is implicitly in your head, or whether the model resides in another form: each diagram drawn from that model should express one or a very limited number of related concepts. You choose the idea to express, and you express it from the elements in the model. Presenting your ideas in UML requires multiple diagrams, just as writing a section in this chapter requires multiple paragraphs.
Implicitly, you may think that discussions of layout and effective diagrams relate only to human-drawn diagrams. Automated utilities create one-way transformations to UML of complex text or XML-based configuration files or even nontext systems. This visual UML presents an alternative and complementary view to the difficult-to-understand source text, especially when used as overviews and sanity checks. Most such utilities automatically lay out the resulting diagrams without allowing the user to arrange the diagrams. (Manual arrangement would impose undue work on the user.) The need for clarity and focus applies equally to UML produced by tools because the reader is still the same.
Though UML provides an excellent vehicle for both modeling and diagramming, the resultant diagrams aren’t necessarily the same. Modeling tolerates larger diagrams with a muddled focus. A large diagram makes a better playground because the cost of refactoring many small diagrams outweighs the benefits of the clarity those diagrams provide, at least in the early stages of design. Once you understand the model and are comfortable with it, you can fission the resultant model more easily into packages and concise diagrams. Ease during this phase validates the model’s completeness; pain in diagramming indicates incompleteness in modeling. Details forgotten against the vastness of the model stand out when the focus narrows to a very small context.
Your documentation, UML and otherwise, must answer when you are absent. When you’re publishing a guide to a toolkit, framework, or system, your audience will fail to exploit your offering without clear and focused diagrams. At the same time, once the model is clearly understood and concisely presented, discard the playground diagrams to avoid confusion.
As with any other endeavor, shortcuts can be appropriate. If only you or an application generator access a model, you don’t need to publish it for others. If the model is implicitly valid or you have better validation mechanisms, such as model checkers, you need not bother creating concise diagrams. A code generator, for example, doesn’t care about understandable diagrams.
No one diagram is definitive in all aspects. To be effective, a diagram must have unity of purpose. As a 2D view of the model, a diagram necessarily leaves out details in order to emphasize important features. The more economic the details, the more salient the features appear in relief. Several diagrams, each with a different purpose, provide a clearer understanding than one diagram that has all the details.
When diagramming, consider the purpose. The following sections detail several errors that compromise the effectiveness of UML.
Structure and Interrelationships Among Classes
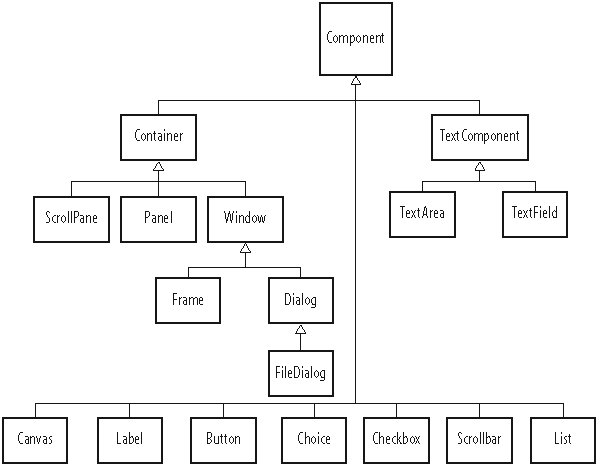
Figure 12-1 shows a class diagram cluttered by details. It gives no insight. Figure 12-2 shows the same classes without attributes and operations. More than half the diagram is an understandable inheritance tree. Rid now of clutter, what’s left becomes readable. The converging lines draw the eye to Component at the center. You can clearly see the relationships between the abstract classes and
various interfaces. The subclasses clearly add individual behavior without adding any structure. The diagram works. Once you understand the structure, you can find the details of operations and attributes elsewhere, in such places as source comment extraction tools such as Javadoc (supplied with the standard Java SDK from Sun) or CppDoc (check for it athttp://www.cppdoc.com/).

Figure 12-2 illustrates that good diagramming doesn’t need to show everything. Effective diagramming communicates one aspect of a system well. The less cluttered a diagram, the better. We chose to communicate the class structure of the Java AWT system. To that end, the diagram focuses on classes and their relationships, and leaves off details, such as attributes, which have no bearing on the knowledge we are trying to share.
Separate Inheritance and Class Interrelationships
Our subset of the AWT doesn’t contain enough complexity to require more simplification. Figure 12-2 mixes the abstract class relationships and the concrete classes using them. For even more clarity, together Figures 12-3 and 12-4 illustrate the same model as do Figures 12-1 and 12-2, but they separate the two concerns of abstraction and inheritance. Figure 12-3 focuses on the abstraction common to all the Components. With just two interesting classes and four supporting classes, Figure 12-3 is simple enough to memorize. That learned, the inheritance hierarchy of concrete classes in Figure 12-4 becomes easy to classify and to manipulate.

Sprawling Scope
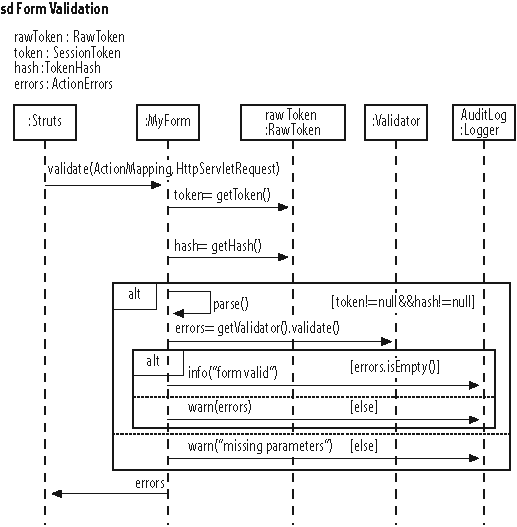
Figure 12-5 shows an example of a poorly focused sequence diagram. Sequence diagrams risk taking on too many interactions at once. This one shows the Struts interactions, the application interactions, and then the detailed workings of the Java libraries.
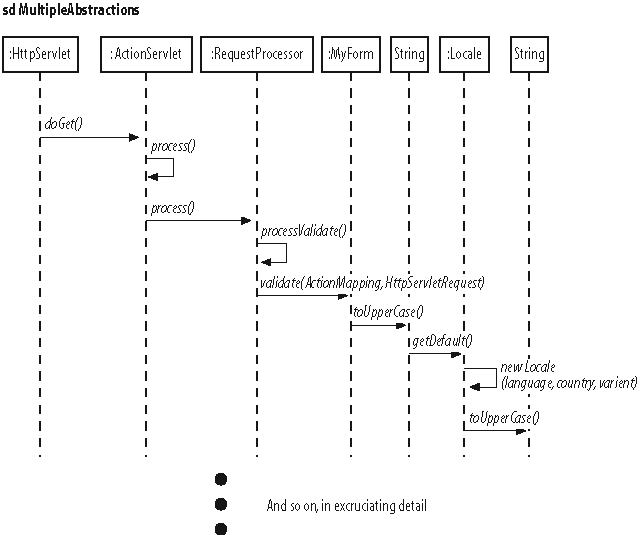
Elements at the high and low end of this diagram are clearly out of scope of the application. One rarely cares how Struts, as an off-the-shelf framework, works. It calls the application logic at the appropriate time. Similarly, just how the internals of the standard libraries carry out their obligations normally doesn’t matter in terms of understanding the application. Both the structure of HTTP request processing and the workings of Strings are God-given as far as the application developer is concerned. However, by showing a few elements that are out of scope, the diagram allows you to see the context of the application within the greater framework, and that’s often useful when selecting an architecture. Similarly, drilling down into the base libraries exposes thread or performance issues. These are exceptional needs; there is no call to complicate the description of an application with these exploratory needs. From the readers’ point of view, nonapplication elements just cloud understanding of the business logic, the only thing over which the developer exerts control.
Figure 12-6 shows the processing for another HTML form. It gets to the point. It is concise enough for one page. And it focuses on interactions between the application classes; the interactions are under control of the development team.
One Diagram/One Abstraction
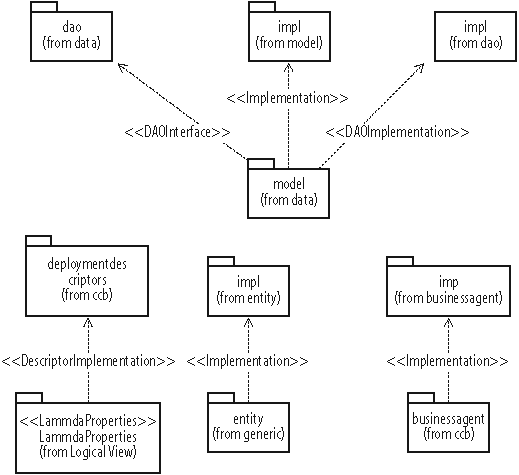
Earlier, in Figures 12-2 and 12-3, we separated structure from inheritance. Each diagram contains fewer elements than the all-encompassing diagram shown in Figure 12-1, or even the more modest one shown in Figure 12-2, so they are easier to understand. Figure 12-7 shows package dependencies. The diagram records both the import graph and code generation directives. The superimposition of these two roles results in a diagram with pairs of opposing dependencies between elements. Don’t worry if you don’t quite understand its meaning; we’ll clean it up in a moment.
Figure 12-7 fails as a diagram for several reasons. Most strikingly, you don’t know where to start: the diagram has no center of gravity. This leads to a lack of flow or direction; do you read the diagram left to right, top to bottom, or inside out? The apparently cyclic dependencies confound any sense of direction. Although opaque to the initiated, the problem with Figure 12-7 stems from trying to use one diagram for two related but different ends: controlling imports and directing code generation.
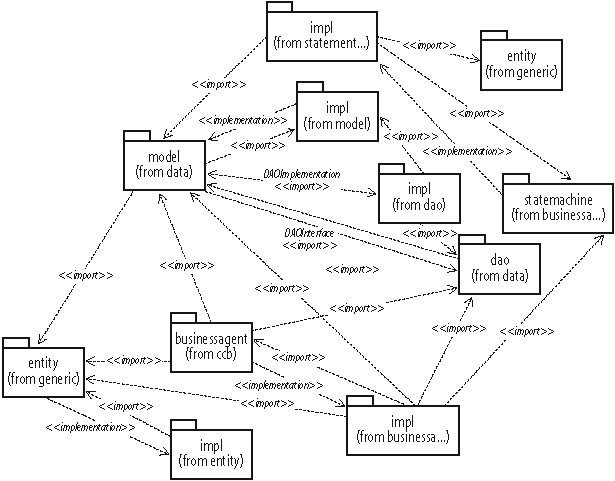
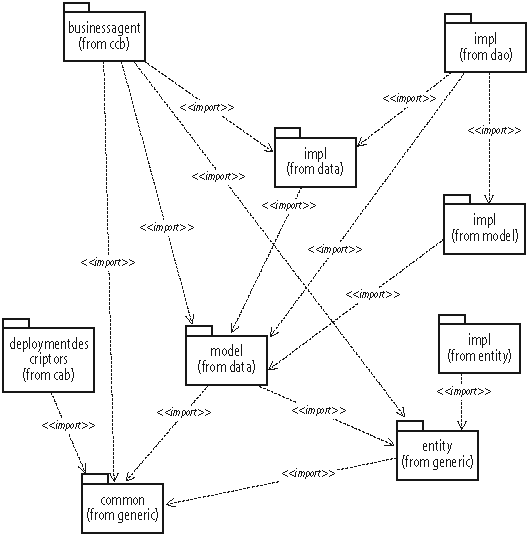
Figure 12-8 addresses the issue of imports only. Elements higher in the diagram depend on elements below. No cycles exist. You can absorb the meaning of the diagram quickly.
Removing the imports from Figure 12-7 simplifies it more than you might imagine. Instead of forming a graph like the imports, the directives, as shown in Figure 12-9, just link separate elements with target packages. The noise of the import graph complicated a simple picture. The complicated, large diagram becomes a small diagram of four separate sections.
Besides UML
UML provides description that’s difficult to match with plain text. Its formalism allows a few lines and boxes to unequivocally and immediately convey what would require time to assimilate from text. The text replaced by diagrams would be, at best, dull and legalistic, and at worst, vague, ambiguous, and open to interpretation. Either way, well-written UML is more effective.
While it may be true that a picture is worth a thousand words, a picture with words is worth much more than just a picture. Perhaps in the context of MDA and executable models, UML can provide a minimum specification for an application generator. In most cases, complete system specification or system documentation requires commentary to explain, emphasize, and give nuance to the diagrams. Diagrams alone risk burying or glossing over details as much as text alone. Diagrams and text reinforce each other. You can describe the context and
major points with text, then drive home those points with a good diagram and the formalism of UML.
As seen throughout this chapter, you can’t effectively document classes with large APIs on a single, class diagram. Hundreds of attributes and operations become insignificant on a diagram. The operation and attribute sections of a class box don’t allow for descriptions. Tools such as Doxygen (http://www.doxygen.org) or Javadoc extract the most current source comments into searchable web pages. Though the details they present are likely to change and therefore will make diagrams obsolete, when they are made part of the software build process, they remain up to date with the latest software changes.
Remember that diagramming requires neither model nor modeling tool. UML practitioners often simply draw diagrams by hand or with simple drawing tools. Modeling tools are expensive acquisitions, in terms of time and distraction, if not in money: open source or proprietary, UML tools take time to master. Whiteboards, notepads, and simple drawing tools deliver much project value with no learning curve. Use them until you are comfortable with UML and its place in the project. With a firm understanding of UML and your process, choosing a dedicated UML tool and changing your process to incorporate it becomes less risky.