
4
Who Are These People?
HOW MANY PEOPLE are currently living in the United States? Come on, I gave you the answer on the second page of this book, and then again at the start of Chapter 3.
That’s right, roughly 320 million people, and I say roughly because counting that many people isn’t easy, and any official “big number” count you might see—say from the U.S. Census Bureau, United Nations, U.S. Central Intelligence Agency (yes, the CIA counts people), U.S. Department of Homeland Security (yep, they count people, too), etc.—is only an estimate or projection.
But wait a minute, maybe that’s why nobody seems to count people—why bother if the government does it?
OK, but does anyone bother looking at their numbers?
Do you?
Anyhow, the “roughly 320 million” estimate I’m using is based on U.S. Census Bureau estimates and projections. In 2013, the Bureau projected that the U.S. population would be at 321.4 million in 2015, but in June of 2015 it estimated that the population as of 2014 was at 318.8 million, and then in December of 2015 it estimated that the population was at 321,418,820 as of July. So, I call the current population as of the end of 2016 “roughly 320 million.”
But, just to confuse you more, we are now going to use the Census Bureau’s 2014 estimates, because the Bureau has done us the favor of parsing those 2014 numbers out to determine who is who and how many whos there are by age, race, ethnicity, and other parameters.
Were you 50 years old in 2014? Well then, according to the Census Bureau you shared that age with 4,491,431 other people living in the United States in 2014. Sadly, the estimates suggest that more than 170,000 of your fellow 1964 birth year U.S. residents had passed away since the 2010 Census.
Interestingly, though, you folks born in 1964 still kind of rule the roost on a population basis, as only five other U.S. birth years have populations greater than yours. And the largest population by birth year/age of 4,698,584—those born in 1991 and currently (as of 2017) age 26—isn’t really that much bigger, is it?
Are you Hispanic? If so, you join an estimated 55,279,452 U.S. residents who identified as such in 2014. And guess what? That represents a 56.5 percent increase from the 35 million or so residents who identified as Hispanic in 2000.
TABLE 4.1
RACIAL AND ETHNIC POPULATION CHANGE 2000–2014

Do you think this is a growing market? This market has just begun to grow and is expected to almost double in size by 2050, to reach about 105.5 million, according to U.S. Census Bureau projections.
PROJECTED RACIAL AND ETHNIC POPULATION CHANGE 2014–2050
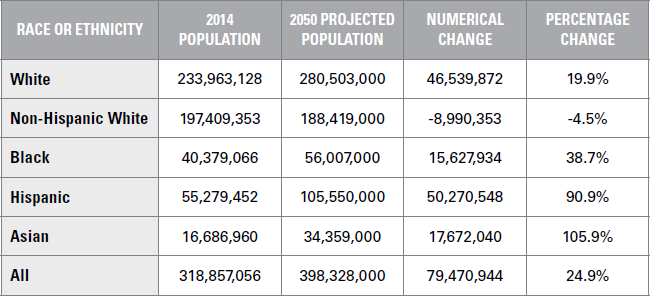
Or are you perchance Asian? If so, you join an estimated 16.7 million U.S. residents who identify as such, and a population that has grown by almost 6.5 million, or 62.9 percent, since 2000. This segment of the population also represents a growth market, and its numbers are expected to double and reach about 34.4 million by 2050, according to the Census Bureau.
Are you African American?1 There were 40.4 million of you as of 2014. And with the population growing by only about 16 percent from the 34,658,190 recorded in the 2000 Census, growth can be considered modest when compared to the Hispanic and Asian populations. Going forward, the Black population is expected to grow about 15 million, rising to 56 million by 2050, for a gain of about 39 percent. While 39 percent certainly represents “growth,” it could be considered modest when compared to that of Hispanics and Asians. To look at it in another comparative way, both the Hispanic and Black populations were roughly the same size in 2000, but the Hispanics had overtaken the Black population by more than 15 million people in fourteen short years, and within another thirty-four years will have outgrown the Black population by a 3-to-1 ratio.
How about White? Well, that all depends upon what kind of “White” you are. While the overall White population is growing, the population that the U.S. Census Bureau calls “Non-Hispanic White”2 barely grew at all between 2000 and 2014, and is projected to decline going forward to 2050. In 2000, the non-Hispanic White population was pegged at 194.5 million, growing to 196.8 million by the 2010 Census and then to 197.4 million in the 2014 American Community Survey. By 2050 the Bureau believes that the Non-Hispanic White population will fall to less than 188.5 million.
When the Census Bureau adds in Hispanics who identify as White, though, the numbers are somewhat better, with a population of 211.4 million in the 2000 Census, rising to 233.9 million in the 2014 American Community Survey, and projected to increase another 19.9 percent to 280.5 million by 2050.
So, if you were forced by some arcane reason to market exclusively to only one of these groups, what do the above numbers mean?
Stumped? OK, let’s start with an easy one. Which one is the biggest market?
That’s right, Whites inclusive of those also identifying as Hispanic. And it also represents a growing market.
Here’s another easy one. Which market is not growing at all?
Correct, “Non-Hispanic White.” If you were exclusively selling to this market and Census projections hold true, your sales would likely decline in the coming years.
At this point you should be realizing that this demographics stuff is pretty easy, but let me give you one more: Fastest-growing market?
“Asians!” Of course. You must be a demographer!
Now, another thing to keep in the back of your mind is proportional representation.
Say what? I can hear you saying. Well, just keep in mind that Hispanics made up only 12.5 percent of the total U.S. population in 2000, but then expanded to 16.3 percent by 2010, and will likely be nearing 30 percent by 2050. Non-Hispanic Whites, meanwhile, went from 69 percent of the total population in 2000 to 63.7 percent in 2010, and are expected to fall below 50 percent before 2050, and perhaps as early as 2042. This idea of proportional representation, then, can obviously have an impact on overall marketing decisions. Think back to 1992 and the election that ushered in Bill Clinton as president. Do you recall any mention of the “Hispanic vote” back then? Nope, it was barely a factor, but the 2016 presidential election almost hinged upon that “Hispanic vote.” Amazing what a difference twenty-four years can make, and you’ll see more examples of proportional representation in a later chapter.
So, where did all these people come from? How did we end up with an estimated 320 million or so people in America as of the past couple of years?
Well, most of them were born here, and for the ease of keeping track of them we can narrow them down on a generational basis. And on this basis there are currently six generations alive in the United States today.
TABLE 4.3
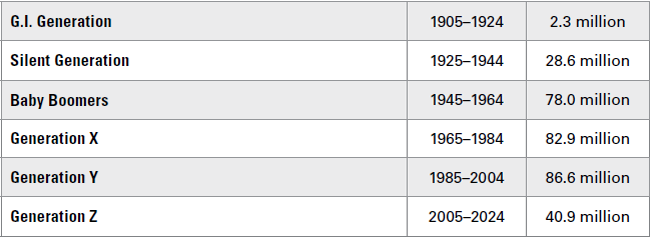
THE U.S. GENERATIONS TODAY*
*OK, so not today, but 2014, which marks, for the most part, Census numbers being used for this chapter.
The G.I. Generation (aka, the Greatest Generation) was born 1905-1924 and registered 56.6 million U.S. births. Currently aged 93–112, there were only about 2.3 million still alive as of 2014.
The Silent Generation (aka the Lucky Few) was born 1925–1944 and registered 52.6 million U.S. births. Currently aged 73–92, there were about 28.6 million still living in 2014.
The Baby Boomers (no other names needed) were born 1945–1964 and registered 78.2 million U.S. births. Currently trying to keep young at ages 53–72, there were still about 78 million alive in 2014.
Generation X (aka, the Slacker Generation, Baby Bust, Generation Me) was born 1965–1984 with 69.5 million registered U.S. births. This so-called “slacker” generation, currently aged 33 to 52, had grown to about 82.9 million by 2014.
Members of Generation Y (aka, the Millennials) were born 1985–2004 with 79.5 million registered U.S. births. Currently aged 13 to 32, the population of this largest U.S. generation ever stood at about 86.6 million as of 2014.
The still emerging Generation Z (aka, IGen and Post-Millennials) was and will be born 2005–2024, and had registered about 40.9 million U.S. births by 2014,3 while the U.S. Census Bureau pegged its population at roughly 40.4 million as of this year.4 Currently spanning the ages of 0 to 11, Gen Z produced the country’s biggest one-year population by birth year in 2007, with 4,316,233 registered births; however, annual birth numbers have since dropped by almost 10 percent.
Now, at this point some of you are probably thinking, Wait a minute, some of those numbers just aren’t making sense.
And on the face of it, they don’t. Sure, the G.I. Generation makes total sense because they’re so old most of them have died off. But what’s up with Generation X? How did they grow from 69.5 million to 82.9 million? And what about Gen Y, up more than 7 million from their birth numbers? And what’s the story with the Boomers? What, they’re really not dying (psst, what’s their secret)?
One word answers those questions: immigration.
About 16 percent of the adult population—or nearly one out of every six adults—immigrated to America. According to the most recent available Census Bureau data, 42.4 million immigrants live in the country. And while many people are prone to believe that this does not account for all of the “illegals,” the U.S. Department of Homeland Security has determined that 90 percent of illegals are accounted for through the Census Bureau’s American Community Survey (ACS). So, while those numbers might be a bit light, they are official, and they are what I work with on a demographic basis.
And these immigrant numbers account for the discrepancy between birth numbers and recent Census Bureau counts. Roughly 40 percent, or 16.9 million, of these immigrants were age 25 to 44 during that last ACS. And that cohort of immigrants is almost a direct match minus a couple of years to the age range of Gen X. So, that can certainly account for the differentiation between birth numbers and recent Census numbers.
Gen Y? Well, 12.7 percent, or about 5.3 million, of the U.S. population ages 5 to 24 are immigrants, and, yep, that cohort of immigrants matches Gen Y minus a couple of years, and undoubtedly accounts for the increase in Gen Y.
And, yes, similar accounting can be made by looking at the Boomer numbers, with 32.5 percent of the age 45–64 population, or 13.7 million, composed of immigrants, and more than 12 million of the original Baby Boomers already passing on to the next world, and well. . . .
Wait a minute, I can hear you saying, why weren’t those Gen X immigrants buying Japanese motorcycles?
Well done! You are starting to consider the numbers of people and the relevant implications of those numbers without any prodding from me.
The easy answer to that question is that they hadn’t yet arrived in significant numbers by the time Gen X hit those key motorcycle-buying years, and the bulk of those who had arrived by those years were likely not in an economically feasible position to consider the purchase of such toys.
During the Gen X birth years 1965 to 1984, America welcomed about 9 million legal immigrants, of whom the vast majority were 20 and older and helping pad the Baby Boomer population, which was already exiting the motorcycle-buying market. During the next twenty years, America welcomed another 18 million or so immigrants, but the bulk of them were also past their key motorcycle-buying years, and arriving as Gen X was also exiting those key years. Thus, immigrant Gen Xers did not flow into the country in accord with the native-born generation’s early purchasing tendencies.
OK, I have given you a general picture of the U.S. population. And I mean general. I could have slapped in a lot more information and data, just using Census Bureau information alone. Such as where do the roughly 320 million Americans live? Well, I can tell you that about 3.5 million of them live in my home state of Connecticut. And we are outnumbered by a 10-to-1 ratio by the 38 million or so residents of California. But that’s OK, because we outnumber the 920,000 folks who live in Delaware by a 3.5-to-1 ratio.
Or we could look at what the 320 million Americans do. Such as, roughly 2 million of them are employed as registered nurses, but only about 6,000 are employed as embalmers. About 850,000 Americans are employed as lawyers, but only about 725,000 Americans are employed as physicians and/or surgeons. “Demographer” was not on the Census Bureau’s “Detailed Occupation for the Full-Time, Year-Round Civilian Employed Population 16 Years and Over,” but according to the Bureau of Labor Statistics that occupation falls under the “Miscellaneous Social Scientists and Related Workers” category, of which the Census Bureau has determined that there are about 35,000.
I could go on with any number of other parameters, but would you retain any of this supplemental demographic information?
Would you find it useful going forward?
Perhaps, but more likely not, unless this information was provided along with appropriate context. What’s important is to consider what any demographic numbers might mean while you’re taking account of them. Let’s look a bit more closely at each generation, and as I parse through their numbers, see if you can discern what these numbers might mean before I tell you.
Ready? Let’s go.