
15
Is the West the Best?
THE U.S. WEST has experienced the greatest regional population growth by percentage and second greatest by number since 1900, with its 1900 population of 4.1 million increasing almost twenty-fold to about 76 million in 2015. More than half of this current population resides in the state of California, with a population topping 39 million, with the bulk of the other half residing in the states of Washington, 7.1 million; Arizona, 6.8 million; Colorado, 5.4 million; Oregon, 4.0 million; Utah, 2.9 million; and Nevada, 2.9 million. The remaining 6 percent of the West’s population can be found in New Mexico, 2.1 million; Idaho, 1.6 million; Hawaii, 1.4 million; Montana, 1 million; Alaska, 638,000; and in the nation’s least populated state, Wyoming, 586,000.
The West is a study in contrasts, both demographically and with regard to other metrics. For example, it contains the largest state by population, as well as the smallest state by population.
It has by far the largest landmass of any region, encompassing more than half of the entire United States, but is the least densely populated, with an estimated 49.5 inhabitants per square mile. Only California, with 251.3 inhabitants per square mile; Hawaii, with 222.9; and Washington, with 107.9, exceed the national average of about 89.5 per square mile.
Many of the region’s states have among the youngest populations in the country by median age, but the region also has one state—Montana—that has one of the oldest median ages.
The region contains the largest number of minorities in the United States, with a greater percentage of Hispanics, Asians, and Native Americans, but its percentage of Black Americans, at about 5.8 percent, is well below the national proportion of almost 13 percent. The region also contains three of the country’s four states that have non-White and/or Hispanic populations that outnumber the White population.
The West includes the wettest state—Hawaii—in the country, as well as the driest—Nevada. For the most part the region is considered “semiarid” in climate; however, its temperate rain forests in the Northwest, along with the state of Hawaii, receive the highest annual precipitation in the country. And while the states of Washington, Oregon, Hawaii, and Alaska are rich with water resources, the lack of water resources in the region’s other states could prove to be a limiting factor on future growth, especially in those areas already experiencing explosive growth.
The U.S. Census Bureau delineates the West Region as the states of Alaska, Arizona, California, Colorado, Hawaii, Idaho, Montana, Nevada, New Mexico, Oregon, Utah, Washington, and Wyoming, and in the table below you can see the most recent population estimates and the change since the 2000 Census.
TABLE 15.1
RATES OF POPULATION CHANGE 2010–2015
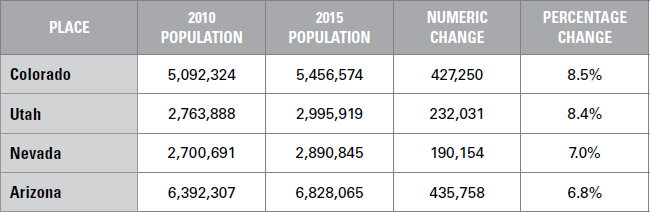
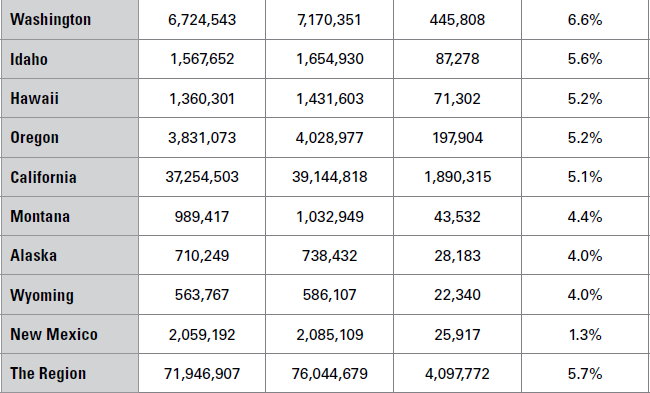
Now I’m not seeing anything especially remarkable about the table above, but do you see anything? Sure, New Mexico’s population growth is rather lackluster, but other than that, the table appears to show healthy growth throughout the region, right? OK, so then let’s look at the components of change table on the next page.
Other than domestic migration outflows from Alaska, California, Hawaii, and New Mexico, there don’t seem to be any especially noteworthy components of population change. And for California and Hawaii, anyway, international migration more than compensated for the domestic migration losses. The large domestic migration outflow in New Mexico goes a long way in explaining the state’s lackluster 1.3 percent population growth for the period. And this, in turn, can be explained by the state’s economy, which still hasn’t recovered from the Great Recession, from which it is still more than 17,000 payroll jobs short of the number it had in 2007, prior to the downturn.
The other states—especially Arizona, Colorado, Washington, and Nevada—seem to have enjoyed strong population increases from domestic migration. But with a closer look, do you notice anything about Utah?
COMPONENTS OF POPULATION CHANGE 2010–2015
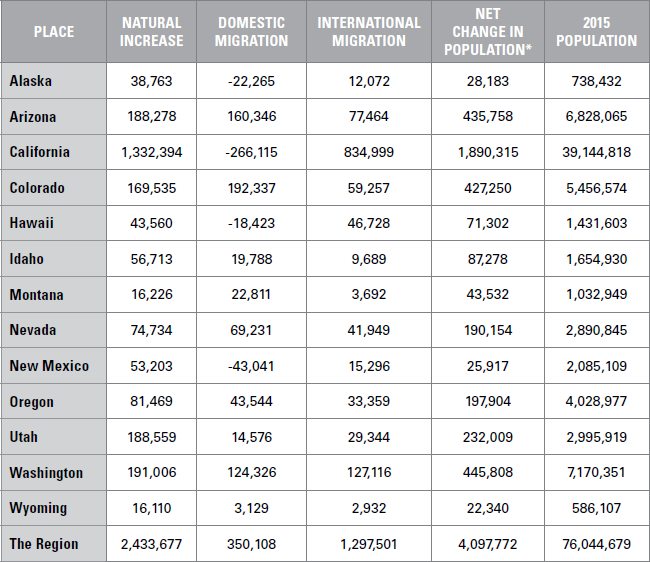
*If you take the time to calculate the numbers in this table—for which I would commend you for your interest in “counting”—you will notice that the sums of the natural increases, domestic migration, and international migrations do not necessarily add up to the net changes in population. This is because the U.S. Census Bureau includes a “residual” in this number to account for “changes in the population that cannot be attributed to any specific demographic component.” I toyed with using the “true” net change in population numbers according to calculating the aforementioned sums but decided that for the sake of consistency I should utilize the “official” numbers despite the odd variance and potential confusion that might ensue should a reader count my sums.
With your demographic acumen, you must have noticed that Utah’s natural increase was relatively high in relation to its population. Care to take a stab as to why this might be?
If you said “Mormons,” well, I can’t dispute that as six in ten Utah residents identify as members of the Church of Jesus Christ of Latter-day Saints, which promotes large families. This probably helps explain why the average Utah woman has somewhere between (depending upon the source) 2.6 and 3.4 children and tends to marry far earlier than women in other states. Utah, with a median age of 30.5, has by far the youngest population in the country, and I generally find that the lower the median age the higher the natural population increase.
The longer-range view of population change is the most interesting as it shows part of the phenomenal growth the region has been experiencing for the past 100 years or so.
TABLE 15.3
RATES OF POPULATION CHANGE 1990–2015

Yep, phenomenal growth, but no real surprises given all that I know. It would be nice to see the components of change, but unfortunately the Census Bureau doesn’t offer it for that time period. The especially robust population growth of Nevada and Arizona is no real surprise, as they’ve both been near the top of the fastest growing state rankings for at least the past two decades. And sure, they both saw population stagnation for a couple of years due to the Great Recession, but that was just a blip on the overall picture, as evidenced both by this table and the shorter-time-framed 2010 to 2015 one.
Like the South, most of the states in the West have birthrates higher than the 2014 national average of 12.5 births per thousand, and higher than most of the states in the Northeast and Midwest. This is likely due in large part to the relative youth of these states’ populations, as in general the lower a state’s median age the higher its birthrate. Utah, which, as mentioned, has by far the youngest median age in the country, also has the highest birthrate, with 17.6 per thousand. Alaska, with the nation’s second youngest median age, at 33.3, has the second highest birthrate, 15.5. Conversely, the two Western states with the highest median ages, also have the lowest birthrates. Montana and Oregon, with median ages at 39.6 and 39.3, respectively, have birthrates of between 11.5 and 12.1, well below the national average. However, Hawaii, which also has a relatively high median age, at 38.1, bucks the trend, as its birthrate is a healthy 13.5. Birthrates for the other Western states are Arizona, 13.1; California, 13.1; Idaho, 13.9; Nevada, 12.6; New Mexico, 12.6; Colorado, 12.4; and Wyoming, 13.1.
On a proportional basis the West is seeing far more births than deaths than any other region. As suggested earlier, this is probably due to the relative youth of the population in many of the Western states, several of which—I mentioned Utah—have the youngest median ages in the country. While the West experienced 1.9 births for every death between 2010 and 2015, the more populated South experienced about 1.5, the Midwest just over 1.4, and the Northeast just over 1.3.
On a statewide basis, Utah, the youngest median age of all the states, has the country’s highest birth-to-death ratio, at about 3.3. Alaska, the second youngest state by median age, has a ratio of 2.8, and California, with the seventh youngest median age—36.0—has a ratio of 2.3. Conversely, Montana, which is in a three-way tie for having the fifth oldest median age—39.6—in the country has a ratio of 1.3, comparable with most states in the Northeast, which also have older populations.
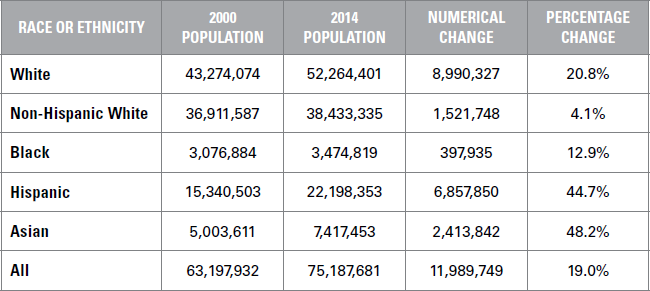
Perhaps the most surprising factor regarding the breakdown of recent racial and ethnic population change is the relative low rate of change for the Hispanic and Asian populations. While the growth is healthy, on a percentage basis it represents the lowest rate of growth for all the regions, which is surprising because the West holds the biggest populations of both groups. The surprise is somewhat muted, though, when considering that on a numeric basis the West had the largest increase of its Asian population, and second largest after the South of its Hispanic population.
TABLE 15.4
RACIAL AND ETHNIC POPULATION CHANGE IN THE WEST 2010–2014
And while the South has the fastest-growing Hispanic population, the West’s large and still growing Hispanic population is a key component of its overall demographics. With the exception perhaps of the South’s Texas, no other region has such a strong Hispanic heritage, nor has a Hispanic base that is so influential on all levels.
According to the most recent data from the U.S. Census Bureau, more than 44 percent of the roughly 53 million U.S. residents of Hispanic origin, many of whom are second-, third-, and fourth-generation citizens, reside in the West. Hispanics have become the ethnic majority in New Mexico and are expected to become the majority in California by 2020, and in Arizona by 2050. Currently there are about 15 million Hispanics in California, 2 million in Arizona, and almost 1 million in New Mexico. The other state Hispanic populations are Colorado: with about 1.1 million, comprising 21.2 percent of the population; Washington, 860,000, or 12.2 percent; Nevada, 790,000, for 27.8 percent; Oregon, almost 500,000, or 12.5 percent; Utah, almost 400,000, for 13.5 percent; Idaho, almost 200,000, for 12.0 percent; Hawaii, 143,000, or 10.1 percent; Wyoming, almost 60,000, for 9.4 percent; Alaska, with almost 50,000, representing 6.2 percent; and Montana, with 34,000, representing 3.2 percent.
It should be noted that Asians will also play a key role in Western growth, especially in California, where their numbers are projected by the state government to double by 2050 to almost 8 million, making them the third largest ethnic group comprising almost 14 percent of the state’s population. Asians also have a significant presence in the states of Hawaii, 37.6 percent of the population; Washington, 7.8 percent; and Nevada, 7.8 percent.
The West also had the second largest numerical increase of its White population, though this represented the largest increase of the regions on a percentage basis. The increase in its Non-Hispanic White population was second largest after the South by number and percentage, perhaps due more to birthrates than migration from the Midwest and Northeast.
TABLE 15.5
RACIAL AND ETHNIC COMPOSITION OF U.S. POPULATION 2014
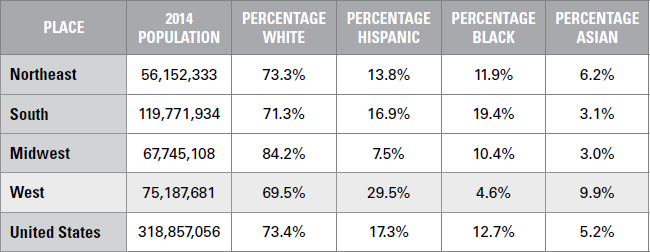
As previously mentioned, the West has the smallest Black population, both by number and proportion, but its 12.9 percent growth with an almost 400,000 increase is respectable, especially when compared to that of the Midwest. The Asian population growth is also strong, and despite strong gains in both the Northeast and West, the West should continue to have the largest Asian population by both number and proportion for quite some time.
PROJECTED POPULATION CHANGE 2000 TO 2030—WEST

Looking forward, the Census Bureau projects that the West will experience the greatest growth on a percentage basis of all regions. In its 20051 interim projections based on the 2000 Census, the Bureau determined that the West’s population would grow by almost 29 million people between 2000 and 2030, an increase of 45.8 percent, just above the near 43 percent increase expected for the South, but far below the South’s numeric increase of an estimated 43 million. The West’s projected growth is far above that of either the Midwest, about 6.1 million for a 9.5 percent rate of growth, or Northeast, with about 4 million for a 7.6 growth rate. With a projected 2030 population of about 92.1 million, the West’s share of total U.S. population is expected to increase to 25 percent, from a current 23 percent.
Nine of the thirteen Western states are projected to have among the highest growth rates in the country for the 2000–2030 time frame, joining five Southern states with growth rates above 34 percent. While California is projected to experience by far the greatest numeric population increase, 12.5 million for a 37.1 percent increase, the states of Nevada and Arizona are expected to experience the greatest growth on a percentage basis. Wyoming is the laggard of the group, both on a numeric and percentage basis.
In considering the projections at the halfway mark, Census Bureau analysts have done a decent job on the regional basis and are within a one-percentage-point basis of being on the mark.
TABLE 15.7
PROJECTED VERSUS ACTUAL POPULATION CHANGE 2000 TO 2015
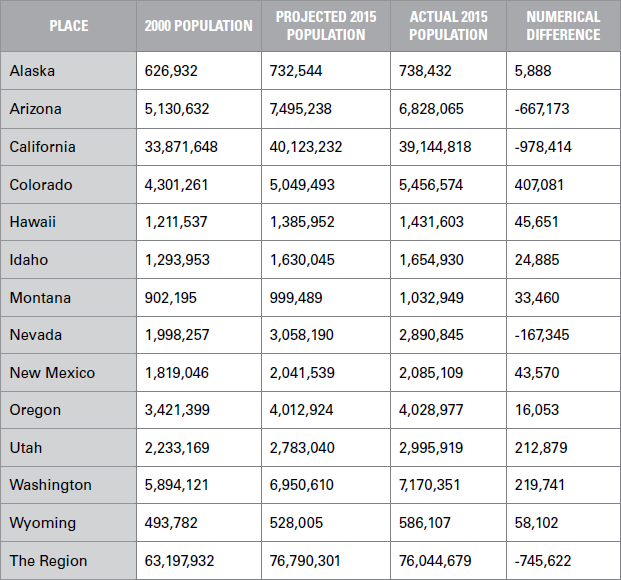
Analysts overestimated Arizona, California, and Nevada by a fairly wide margin; however, pretty much everyone overestimated the growth of those regions back when the projections were being made, which was at the height of the housing boom. As it stands now, Colorado, New Mexico, Hawaii, Montana, and Wyoming look like they will easily meet, if not exceed, the 2030 projections, while the other states, especially Arizona, will come up short if growth is similar to the past fifteen years.
Like the South, the West’s population boom has in part been fed by migration. However, while migration to the South has been significantly increasing over the last few decades, migration to the West—which was largely responsible for its seventeen-fold population increase between 1900 and 2000—has been decreasing. In fact, since at least the mid-1990s more people have been migrating from Western states to Southern states than from Southern to Western states. Nevertheless, the West, unlike the Northeast and Midwest, is still drawing in net gains of migrants, primarily due to the large influx of international migrants.
The California Gold Rush of 1848 started the first large migration boom to the West, drawing in about 300,000 settlers to the area by 1855. Meanwhile, the numbers of settlers looking for other opportunities throughout the West increased every year, arriving first by rugged overland trails such as the “Oregon,” “Mormon,” and “Bozeman,” or by ship via the long and perilous journey around Cape Horn in South America. These migration flows accelerated with the enactment of the Homestead Act, which offered free Western land to settlers, and with the building of transcontinental railroads, the first of which was completed in 1869.
Of course, this migration came with a price, as the region’s original settlers, the 500,000 to 1 million (estimates vary greatly) Native Americans of 1850, were, if not outright killed, pushed aside and had their land essentially stolen from them, all within the space of about forty years. They are still recovering from that brief period of history, as their population in the region does not top 1.5 million.
Migration flows from other regions into the West continued in the 20th century, as the West, and particularly California, was still seen as America’s land of opportunity. Migration flows were helped by the rise of the automobile, which was in turn enhanced by the building of the Interstate Highway System in the 1950s. While data containing actual numbers of migrants to the West in the 20th century is lacking, one Census Bureau report estimated that about 4.5 million residents of other regions migrated to the West between 1900 and 1940, with another 10.5 million migrating to the West between 1940 and 1990.
The inflow of migrants from other regions seems to be easing, with the South emerging as the current most popular destination of choice for domestic migration. A study by the Pew Research Center using U.S. Census Bureau data showed that while the West received a net gain of more than 1.1 million domestic migrants from 1975 to 1980, this inflow had slowed to a trickle by 2000, with a five-year net gain of only about 20,000 domestic migrants. While the West received a net gain of 166,000 from the Northeast and 115,000 from the Midwest from 1995 to 2000, it experienced a net loss of 261,000 from its overall migration flows to the South. More recent data suggests that though the West continues to receive net domestic migration gains from the Midwest, it also continues to experience net migration losses to the South.
The migratory attraction of the West was perhaps largely a result of the perception of it being the “Land of Opportunity.” And yes, that is often how America as a whole is referred to. But for U.S. residents, especially those of us here on the East Coast, that expression has been used to refer to the West, and in particular, California . . . though the sheen on that state seems to have rubbed off in recent years.
That said, by many economic indicators, the West is still a land of opportunity. Five Western states are ranked in the top 10 for “economic outlook” in Rich States, Poor States, the 2015 State Economic Competitiveness Index from the American Legislative Exchange Council (ALEC), with another three ranked in the top 25. While the remaining six states ranked below 25, the historical economic performance was exceptional, with six ranked in the top 10 for 2003 to 2013 economic performance and another four making the top 15. Only New Mexico, ranked in the middle, and California, ranked 37th, were not top performers. Narrative in the report points to Utah, Wyoming, and Nevada as being the most likely hot spots for future growth.
California, with an ALEC economic outlook ranked 44th in the nation, has been a laggard in recent years because of its excessively high personal and corporate state tax rates, and corporate disincentives such as strong unions and high state debt levels.
Despite the somewhat negative view from ALEC, California’s high-tech industry may give it a leg up for future growth. In fact, California ranks third in the nation in the Kauffman Foundation and Information Technology and Innovation Foundation’s periodic study to determine which states are best positioned to capitalize on America’s transformation to the “New Economy.” As noted in Chapter 12, the term “New Economy” was coined in the 1990s to describe a set of qualitative and quantitative changes that have been transforming the structure, function, and rules of the economy.
Along with California’s third place in the most recent rank-ings—“The 2014 State New Economy Index”—Washington, Colorado, and Utah were ranked in the top 10 for being furthest along in transitioning into the New Economy, while Oregon and Arizona were ranked in the top 20. The laggards of the group happen to be the four states with the smallest populations, and, though there is not necessarily a correlation, being a demographer, I can certainly say there might be.
As a final note on the West, it needs to be pointed out that successful future growth—both population and economic—is highly dependent on how the states utilize the region’s scarce water resources. And water, or lack thereof, will undoubtedly influence domestic migration patterns in the future, and may already, in fact, be doing so.