
12
The Northeast Beholden to International Immigration
AS MENTIONED, I live in Connecticut, one of nine states designated as the U.S. Northeast region of our country, and one of the six New England states. Connecticut is a study in contrasts. On the one hand Connecticut has the highest per capita income of any state in the union, owing in large part to Fairfield County being a bedroom community for New York’s financial district. On the other hand Connecticut’s cities, New London, New Haven, Bridgeport, and yes, Hartford, struggle financially. Go figure.
The Northeast has been competing with the Midwest for the past twenty-five years as to which region is the most demographically challenged, and by most measures would take the trophy. It has the smallest population (about 56 million, or about 17.5 percent of the total U.S. population), is experiencing the lowest growth rate (1.7 percent—roughly 960,000—from 2010 to 2015), and losing the most domestic residents (more than 1.2 million from 2010 to 2015) through out-migration. States in the Northeast also have the oldest populations by median age, and the lowest birth and fertility rates. Perhaps the region’s only saving grace is that it took in the second highest number—almost 1.4 million—of international migrants from 2010 to 2015 for a net migration gain of about 152,000.
The U.S. Census Bureau delineates the Northeast region as the states of Maine, Vermont, New Hampshire, New York, Massachusetts, Rhode Island, Connecticut, New Jersey, and Pennsylvania. It is geographically the smallest region by a significant margin, and historically has been the most densely populated. Currently it is estimated that more than 80 percent of the Northeast population lives in urban areas.
The Northeast population has grown only a cumulative 10.8 percent since 1990, when the population was pegged by the Census Bureau at just under 50.1 million. This is measly growth when compared to the country as a whole, which experienced about 29 percent population growth during the same time, and is considered downright anemic when compared to the South, which saw a 41.8 percent population rise. And, on a decade-wise basis, the population increase numbers are dwindling down.
Between 2010 and 2015, the Northeast’s natural increase (the difference between births and deaths) was 871,276, with 3,350,436 births and 2,479,160 deaths, with all three counts being the lowest among all regions, and the 26 percent birth-to-death ratio also being the lowest of the regions.
With the exception of Maine, with 1,646 more deaths than births, all of the Northeast states experienced natural increases. The most populated state, New York, at more than 19.3 million people, experienced the biggest natural increase with more than 467,000, while the least populated state, Vermont, with just over 600,000 people, saw a natural increase of just over 3,000, but at least, unlike Maine, it marked an increase. All of the states experienced domestic migration population losses, with four experiencing net migration losses: Connecticut, -16,342; New York, -22,308; Rhode Island, -3,445; and, Vermont, -2,432.
COMPONENTS OF POPULATION CHANGE 2010–2015
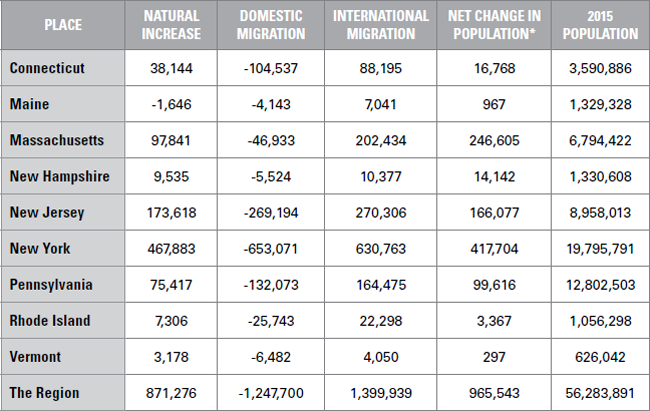
*As noted on the Components of Population Change table in Chapter 11, If you take the time to calculate the numbers in the table you will notice that the sums of the natural increases, domestic migration, and international migrations do not necessarily add up to the net changes in population. This is because the U.S. Census Bureau includes a “residual” in this number to account for “changes in the population that cannot be attributed to any specific demographic component.” I toyed with using the “true” net change in population numbers according to calculating the aforementioned sums but decided that for the sake of consistency I should utilize the “official” numbers despite the odd variance and potential confusion that might ensue should a reader count my sums.
The numbers in the table above are indicative of the big story with regard to the demographics of the Northeast and have pretty much been playing out in this fashion for at least the past twenty years.
So, in looking at the numbers in the table above, what can you tell me?
Right, Maine’s numbers do a pretty good job of showing why the hypothetical restaurateur named Ted in Chapter 11 never opened any new McDonald’s restaurants and is currently struggling to get his second kid through college.
What else?
With the exception perhaps of New York, the natural increase populations do not seem to be particularly robust, especially given the size of the states’ respective overall populations. In fact, the natural increase numbers are downright anemic. Based on those natural increase figures alone, it would take Pennsylvania more than 800 years to double its population, New Hampshire would need almost 700 years, and my own state of Connecticut would need more than 450 years. Even New York would need more than 200 years to double its population if relying on the five-year natural increase numbers of 2010 to 2015.
Notice anything else of note?
Bingo! People seem to be moving out—big-time!
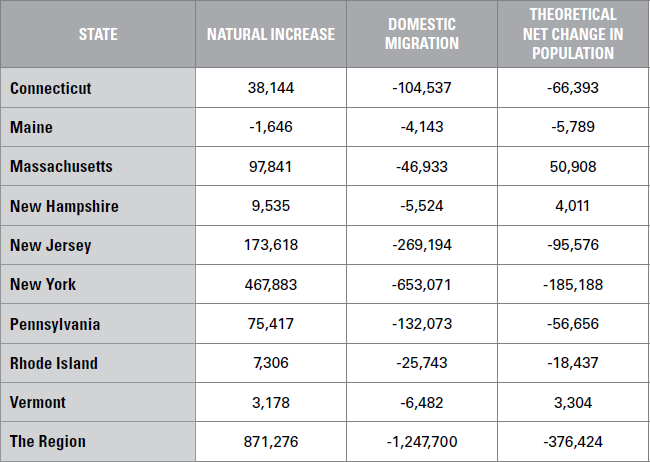
On a regional basis, hardly enough international migrants are filling the gap left behind by the departing domestic migrants, and some states are fully reliant on the natural increase to maintain their populations. Without international migration numbers, Connecticut, New Jersey, New York, Pennsylvania, Rhode Island, and Vermont would have joined Maine in suffering population declines, as seen in the table with the scary theoretical population numbers below.
TABLE 12.2
THEORETICAL POPULATION CHANGE ABSENT INTERNATIONAL MIGRATION 2010–2015
Now let’s take a closer look at the region’s population change with a couple of tables showing short- and longer-term rates of growth for each state. Unfortunately, as with the previous tables in this chapter, the numbers are going to be underwhelming.
TABLE 12.3
RATES OF POPULATION CHANGE 2010–2015

TABLE 12.4
RATES OF POPULATION CHANGE 1990–2015
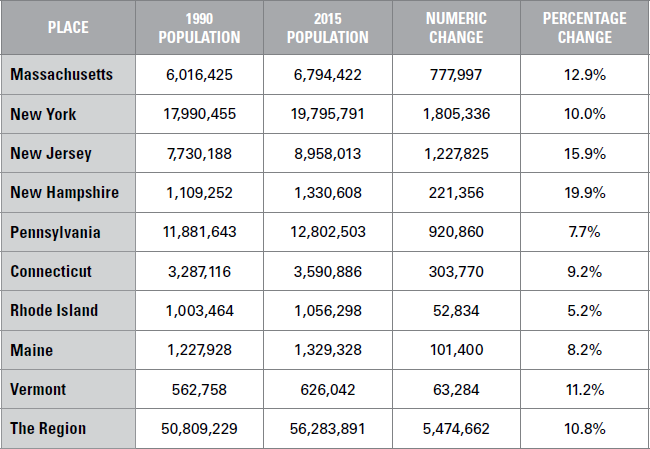
Well, excepting Massachusetts, I suppose.
But let’s stretch the time period out twenty-five years and see what happens.
OK, so not nearly as bad as the shorter-term numbers, but when you consider that the nation as a whole during this time frame grew by about 29 percent, well then, states from the Northeast would appear to be laggards.
Also of interest are the changes in racial and ethnic populations in the region. Have a look at this table:
TABLE 12.5
RACIAL AND ETHNIC POPULATION CHANGE IN THE NORTHEAST 2000–2014

This would seem to indicate that the White folks aren’t having babies and/or they are the primary members of the domestic migration outflows from the region.
As with the rest of the country, the Northeast is seeing strong growth in its Hispanic and Asian populations, while Black population growth can be considered healthy. Little doubt that on a proportional basis all of these populations are going to make gains in the coming years.
RACIAL AND ETHNIC COMPOSITION OF U.S. POPULATION 2014

Looking forward, the Census Bureau as of 2005 released projections based on the 2000 Census that indicated that the Northeast’s growth rate will continue to stagnate. For whatever reason, the Census Bureau “does not have a current set of state [or regional] population projections and currently has no plans to produce them.”2
In its 2005 projections the Bureau determined that the Northeast will see the slowest growth in the country, with its population projected to increase by about 4.1 million, a 7.6 percent increase between 2000 and 2030. Meanwhile, the South “will rise again”— It is projected to experience a 42.9 percent increase in its population, which will grow by about 43 million.
Of the Northeast’s nine states, the largest, New York, is projected to have the least growth, with its population theoretically adding only about 500,000 for 2.6 percent growth over the thirty-year period. Pennsylvania comes in with the second-lowest projected growth, with about 490,000 new residents for 4.0 percent growth. Projections for all the Northeast states are indicated in Table 12.7 on the following page.
We’re halfway through the thirty-year time frame for the projections, and thus far I would say their accuracy is mixed. Both New York and Pennsylvania have already exceeded their 2030 projections, with New York’s current population more than 300,000 larger than the 2030 projection, and Pennsylvania’s 34,000 larger. The current population of Massachusetts suggests that it will likely exceed the 2030 projection by 2025, while the current population of Connecticut suggests that it could meet its 2030 projection with some significant help from natural increase and migration. The current populations and last fifteen years of growth for the remaining states suggest that they will definitely not meet 2030 projections.
PROJECTED POPULATION CHANGE 2000 TO 2030—NORTHEAST

TABLE 12.8
PROJECTED VERSUS ACTUAL POPULATION CHANGE 2000 to 2015
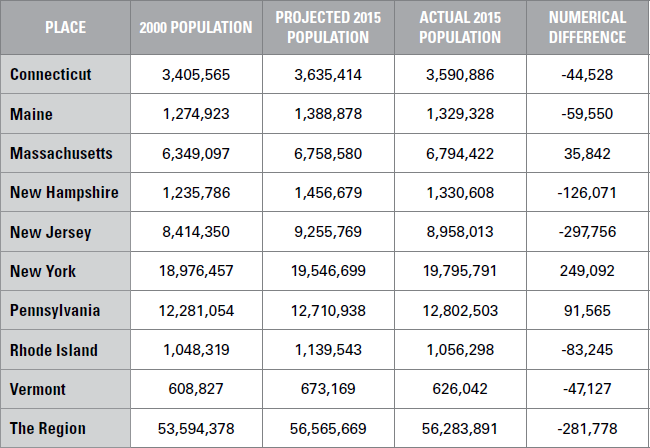
With regard to New Hampshire I can only believe that the Census Bureau forecast the strong growth of more than 33 percent by 2030 due to its relative strong economy and low tax policies. Apparently that has not been enough to stimulate the strong population growth forecast by Census Bureau analysts.
Crunching the numbers of population growth is relatively easy—determining the reasons behind the Northeast’s stagnating population growth3 presents far more difficulties. Opinions abound, and added all together most of them probably have relevance and contribute to the problem.
The economy, naturally, would be a primary determinant of the migratory metric of population growth, as people tend to move where the jobs are. On a historic basis the region as a whole has long enjoyed one of the strongest economies in the country, and some economic indicators—such as strong per capita income growth and high GDPs—suggest that this strength may have ebbed but is still powerful. However, a large portion of this historic economic strength is primarily carried by the states of New York, New Jersey, Massachusetts, Connecticut, and Pennsylvania. Moreover, the region’s economic health fluctuates over time and varies widely on a sub-regional, county-by-county, and even city-by-city basis, with some areas being economic powerhouses, others being destitute, and many somewhere in between.
While space in this book does not allow an in-depth examination of all the economic factors that may be contributing to the region’s stagnating population growth, the loss of manufacturing jobs in the region is definitely having a significant impact. According to analysts, the United States on the whole lost 5.7 million manufacturing jobs representing 33 percent of all manufacturing jobs in the 2000s, with the historical manufacturing centers in the Northeast and Midwest seeing the greatest declines. Not that the loss of manufacturing jobs in the Northeast started in the 2000s, as the region has been bleeding manufacturing jobs since the 1970s.
According to Kenneth M. Johnson, senior demographer at the Carsey School of Public Policy, the Northeast is growing slower than the rest of the country in large part because many of these states, especially the Northern ones, do not attract immigrants like states in the rest of the country (immigrants being the key in supporting the entire U.S. demographic, he notes), and domestic residents are migrating out because of the loss of manufacturing jobs. “There has been a significant population loss from what had been traditionally manufacturing counties,” he said, adding that an unrecognized factor is that “a larger part of the rural workforce works in manufacturing than the urban.” Many of these areas have experienced difficult economic times for the past ten to twenty years, he said, and, as a result, significant out-migration.
Mark Mather of the Population Reference Bureau says, “It’s all about jobs,” noting that parts of the Northeast “have been losing population for decades due to loss of employment opportunities, especially in manufacturing and farming.” Mather adds that the out-migration “is most pronounced for young adults,” and once that segment of the population declines, “the number of children and families starts to dwindle.”
While employment opportunities are certainly having an impact on the region’s population trends, the cost of living also plays a role. The Boston Globe, which chronicled Massachusetts’s stagnating population throughout the 2000s, conducted a poll of former state residents that indicated better jobs and lower housing costs were the top reasons for leaving the state, with 73 percent saying their new home was more spacious than their former Massachusetts one, 54 percent indicating that they were enjoying a higher standard of living, and half reporting that housing costs were a major factor in their departure.
Rich States, Poor States, the 2015 State Economic Competitiveness Index from the American Legislative Exchange Council (ALEC), calls the Northeast “America’s New Rust Belt,” and blames high taxes (both personal and corporate), irresponsible government spending, and overregulation as the primary cause of job losses, and resultant population declines. Using fifteen parameters that primarily deal with taxation and regulation, the index gives the states of the Northeast region among the worst economic outlook rankings, and suggests that the extensive out-migration of people will continue absent state government policy changes.
ALEC’s report describes how residents and companies in the region, with the exception of New Hampshire, pay state taxes “high above the national average.” The report notes that “high taxes don’t redistribute income, they redistribute people.”
While most of the Northeastern states’ personal income and property tax rates are “well above the national average,” all of their corporate tax rates are far above the average, notes the report. Other than these high taxes, powerful unions “may be the single greatest factor impeding economic competitiveness in the region.” Add these factors together and “it is no wonder migration out of these states was more than 2.6 million on net over the past 10 years.”
Given that ALEC is recognized as a “conservative” organization, not everyone subscribes to this viewpoint. In fact, the states in the Northeast region rank exceptionally high in a periodic study by the Kauffman Foundation and Information Technology and Innovation Foundation that tries to determine which states are best positioned to capitalize on America’s transformation to the “New Economy.” The term New Economy was coined in the 1990s to describe a set of qualitative and quantitative changes that have been transforming the structure, function, and rules of the economy. The New Economy is described as global, entrepreneurial, and knowledge-based “in which the keys to success lie in the extent to which knowledge, technology, and innovation are embedded in products and services.”
In the most recent rankings—“The 2014 State New Economy Index”—Massachusetts, Connecticut, and New Jersey were ranked in the top 10 for being furthest along in transitioning into the New Economy, while New Hampshire, New York, Vermont, and Rhode Island were ranked in the top 20.
The report suggests that many of these higher-ranked states may not be growing rapidly in employment, but it argues that they will be “best able to face the challenges brought on by the New Economy transformation.”
While economic factors are obviously a key component driving migration-induced population stagnation in the Northeast, retirement to warmer climates should be considered as well. Of course, economic considerations ultimately play a role in people’s retirement decisions, as evidenced by domestic migration patterns before, during, and after the Great Recession. Census data for the 2007 to 2010 period showed a significant decrease in domestic migration into the top states—Florida, Arizona, Nevada, Georgia, and North Carolina—known to be drawing retirees from the North. This corresponded with a noticeable decline in domestic migration out of the Northeastern states, with Massachusetts recording its first positive net inflow of domestic migrants for the decade, and New Jersey and New York also recording much higher population growth for the period.
Well, with the recession’s end, Northern retirees again started moving South, and all indications suggest that the numbers of them moving to warmer climates is rapidly rising again and should soon, if not already, reach pre-recession levels. And with the number of Baby Boomers reaching retirement age slowly accelerating, I would guess that these numbers are going to far surpass pre-recession levels within the next ten years.
Remember what I told that audience of Florida municipal financial workers, as described in Chapter 1? Well, I’ve been down to Florida recently and can tell you that the state is going absolutely gangbusters with building infrastructure to support a rapidly growing population, but I’m not sure whether it is building it fast enough.
In concluding this chapter, let me restate that there are many explanations for the stagnating population of the Northeast, and it appears that levels of population growth will continue to be lackluster in the years ahead, especially in comparison with the South and West. But what do you make of this?
Sure, “Don’t invest in or work for companies based in the Northeast” would be an easy answer, but nothing is that simple, is it?
No, it’s complicated, and just because people seem to be fleeing the region in droves and its population is on the precipice of potential decline doesn’t mean that the Northeast is going to become a wasteland in the next fifty years. It’s not like New York City is going to disappear. . . .
Again, this is just an exercise designed to show you the demographics while teaching you how to always be cognizant of the potential implications of population dynamics. So, while the demographic and economic health of the Northeast may not currently seem to be especially healthy, both demographics and economics are almost always in a state of change, and within change one can find opportunity. And perhaps the Northeast’s change will include that successful transition into the “New Economy” model. If so, the Northeast could become an economic powerhouse again, which would also likely spur a healthy transition of its current demographic dynamics.