
1. Getting to Know Visio 2013
In This Chapter
• What is Visio?
• How can I use Visio?
• How are Visio 2013 versions different?
• What is new in Visio 2013?
Allow us to introduce you to Visio 2013. We are confident that you will be excited to learn all about this application. This chapter briefly considers ways that you can use Visio; you even create your very own diagram in the first few pages. This chapter also shows you some of the differences between versions as well as the improvements included with Visio 2013.
What Is Visio?
People who have never used Visio often ask what it does. Even those who have used Visio over the years may have a hard time explaining what Visio is because they use it for only one or two very specific tasks. Visio is an application that allows you to create visually distinctive and professional diagrams that can be used in a variety of settings, subjects, and professions.
The idea behind Visio is to provide standardized tools that enable you to easily assemble drawings or diagrams using basic building blocks or shapes, so you do not need to be an artist or even know how to draw. This approach to diagramming makes it possible for anyone to create amazing charts and diagrams by putting shapes together from groups of shapes called stencils. Templates make this even easier by providing you with a basic starting point that determines formatting and which stencils are used. You start working by dragging and dropping shapes into a drawing.
Create a Basic Flowchart
Visio will quickly make sense to you as you follow the examples and create some of the sample diagrams in this book. Many tools will be intuitive, and you will see a layout similar to other Microsoft Office applications that you may already be familiar with. We progressively explain in detail what all the buttons and menus are for through later chapters. You do not need to be an expert before you start making Visio diagrams; in fact, you can start right now with a simple flowchart.
Follow these steps to create a basic flowchart:
1. Open the Visio application.
2. To the left you see a list of the most recent drawings you have opened. As you work with Visio this grows, even if it is now empty. To the right where you see a list of drawing types, select Basic Flowchart as shown in Figure 1.1.
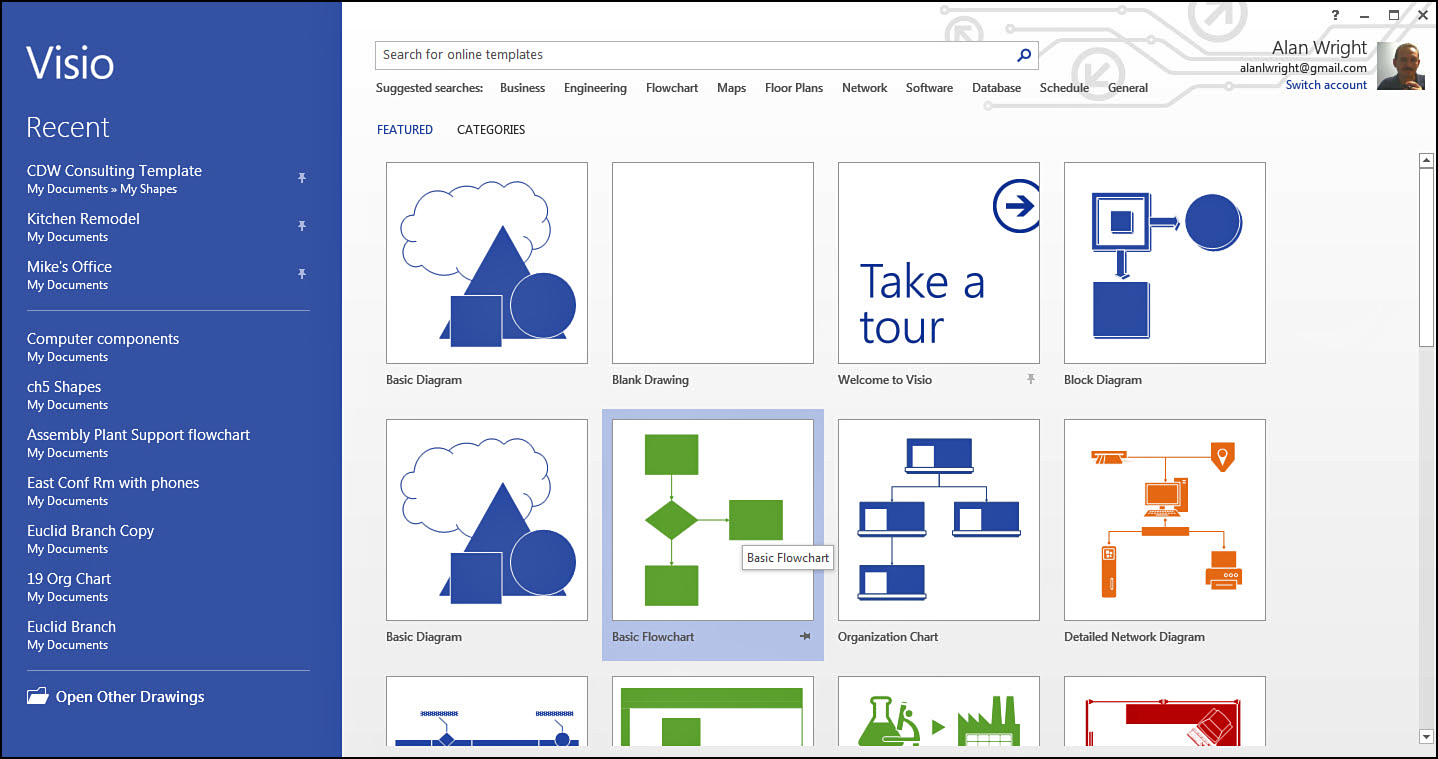
3. A smaller window appears, labeled Basic Flowchart. Click the Create button for now.
4. To the left you see a few shapes with different names. Look for the Start/End shape and drag it over to the drawing window by selecting it and dragging it. Drop it toward the top of the page, as shown in Figure 1.2.
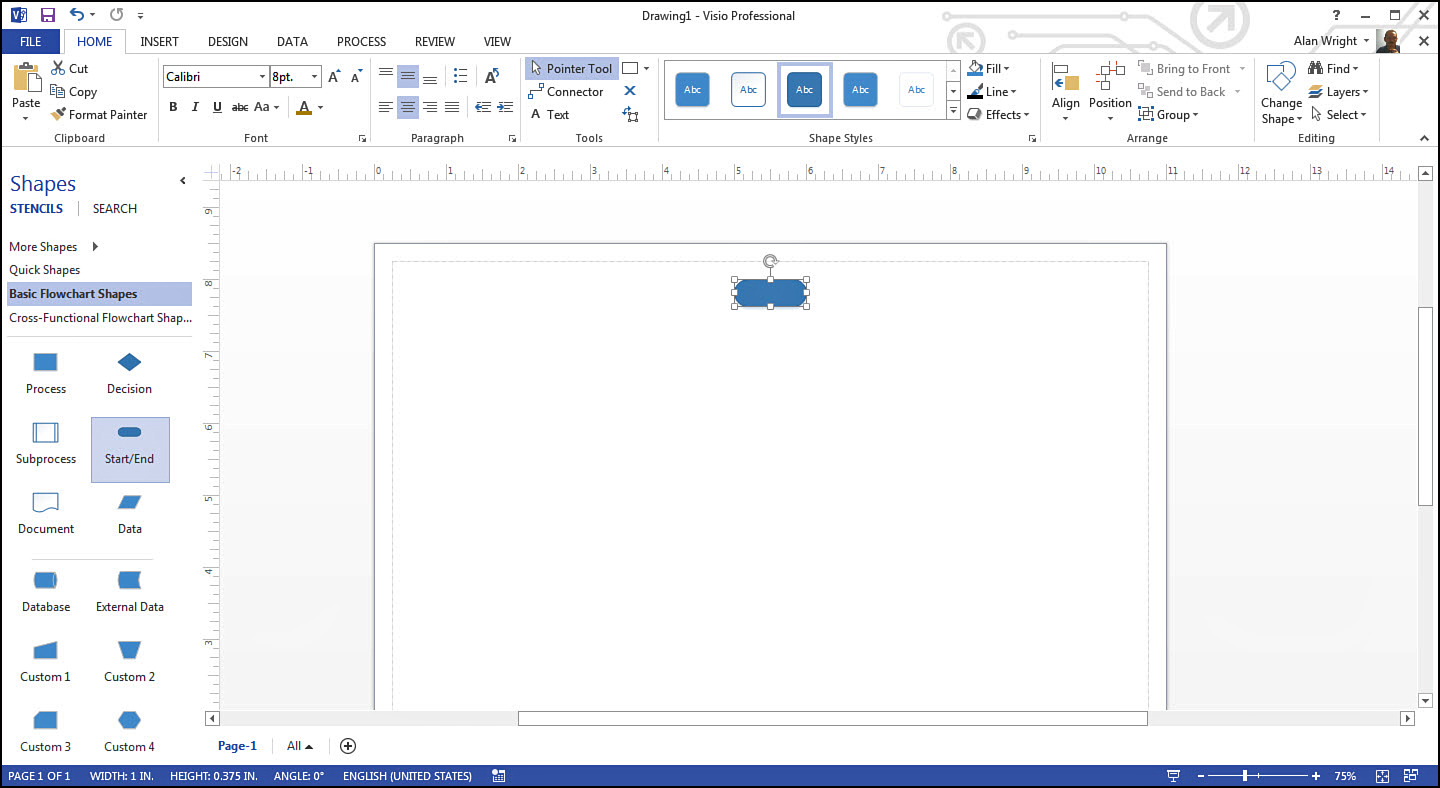
5. While the shape is still selected, type the words Start flowchart and then press the Esc key on your keyboard when you are done. The shape is still selected, and the words “Start flowchart” are now centered in the shape.
6. Position your mouse pointer over the shape for a couple of seconds to see four faint blurry arrows. Move the mouse pointer until you hover over the arrow pointing down. A group of four shapes appears; select the left-most rectangle with a click, as shown in Figure 1.3.
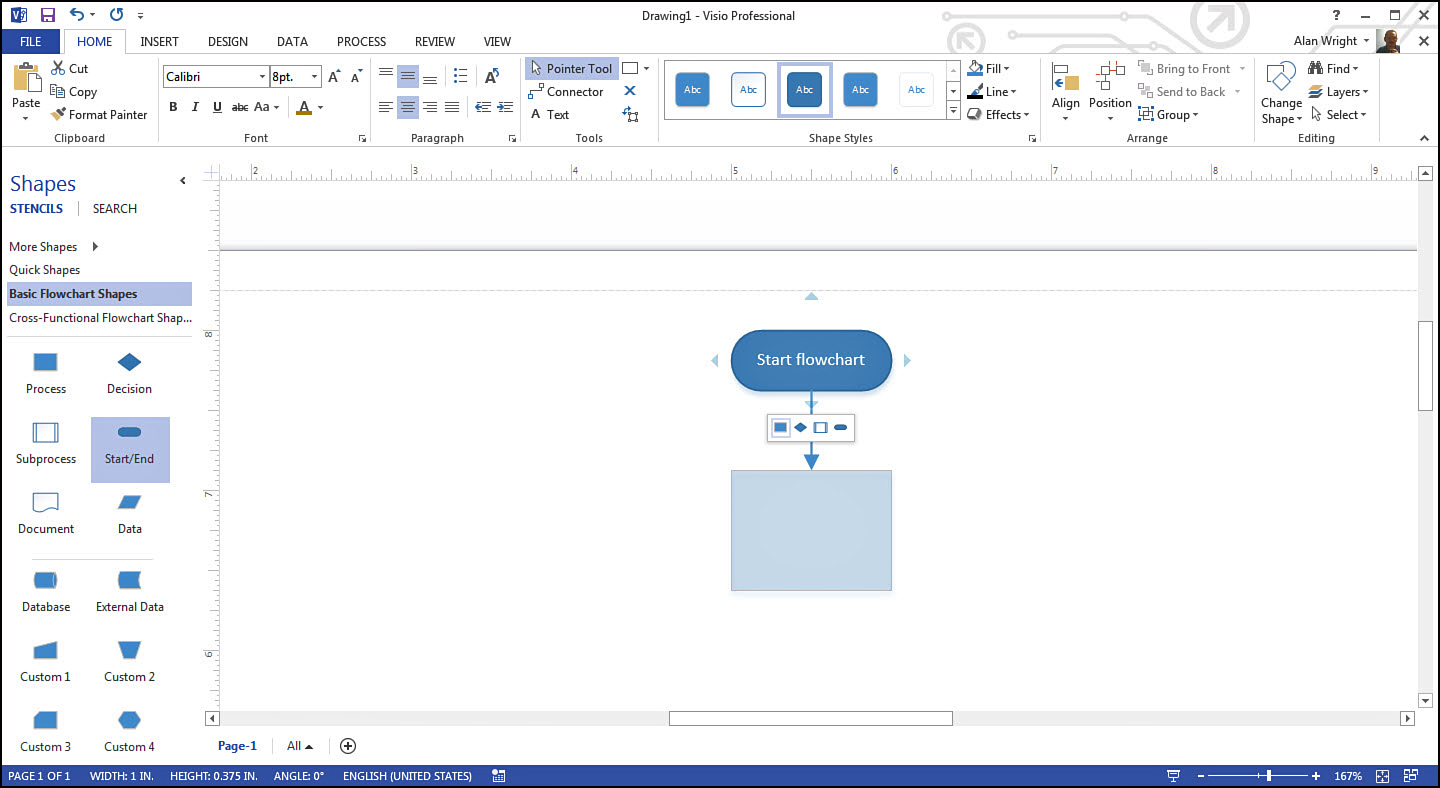
7. A rectangle is placed below your start shape, and a line with an arrow connects the two shapes. With the rectangle selected, type the words Add shapes to identify steps in the flowchart and press Esc again.
8. Hover your mouse pointer over this rectangle and then the arrow pointing down, as in step 6. Select the right-most oval shape as an end shape for your flowchart.
9. With this end shape selected, type in the words End flowchart. Press Esc when finished.
Your flowchart should look like the one in Figure 1.4. Congratulations! You have created a simple but complete flowchart that summarizes the nine steps just completed.
What Else Can I Make?
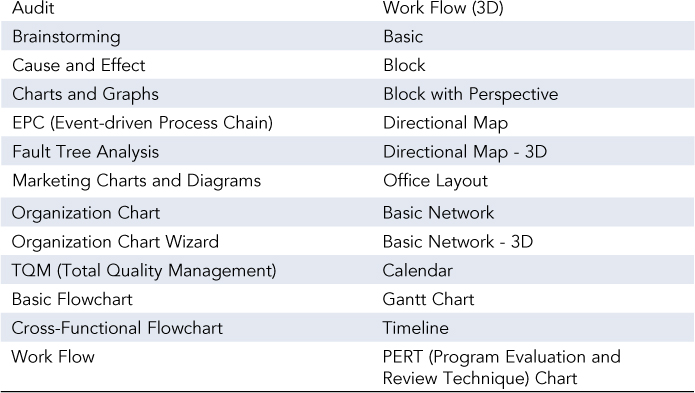
Visio is known for many other diagram types besides the flowchart that you just created. Out of the box, Visio Standard 2013 includes the 26 types of templates shown in Table 1.1; the Professional version includes 76 templates. Many are new and improved with the Visio 2013 versions.
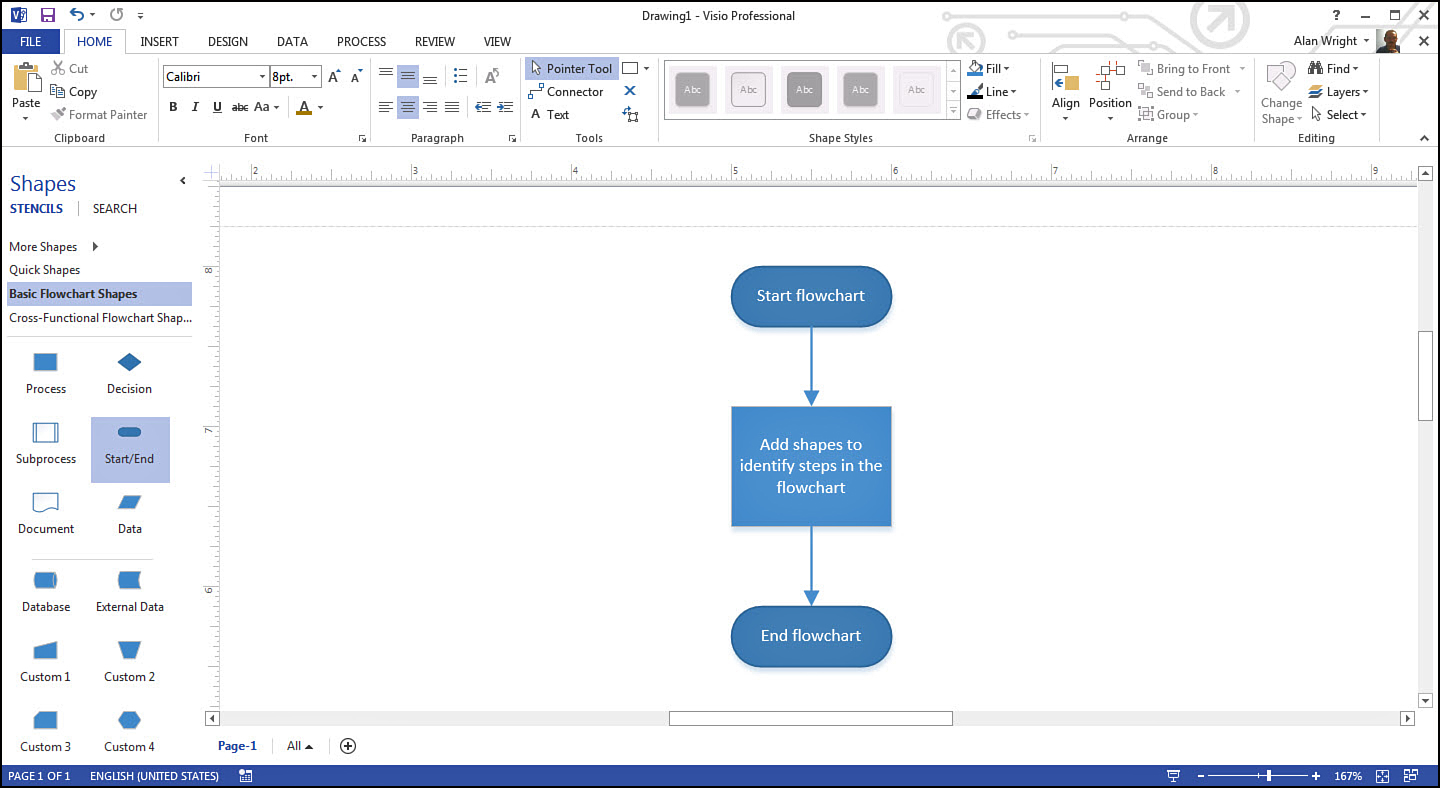
To see which templates you have, open Visio and scroll through the templates listed in the template gallery as shown in Figure 1.5. You learn more details about templates in Chapter 3, “Working with Basic Diagrams.”
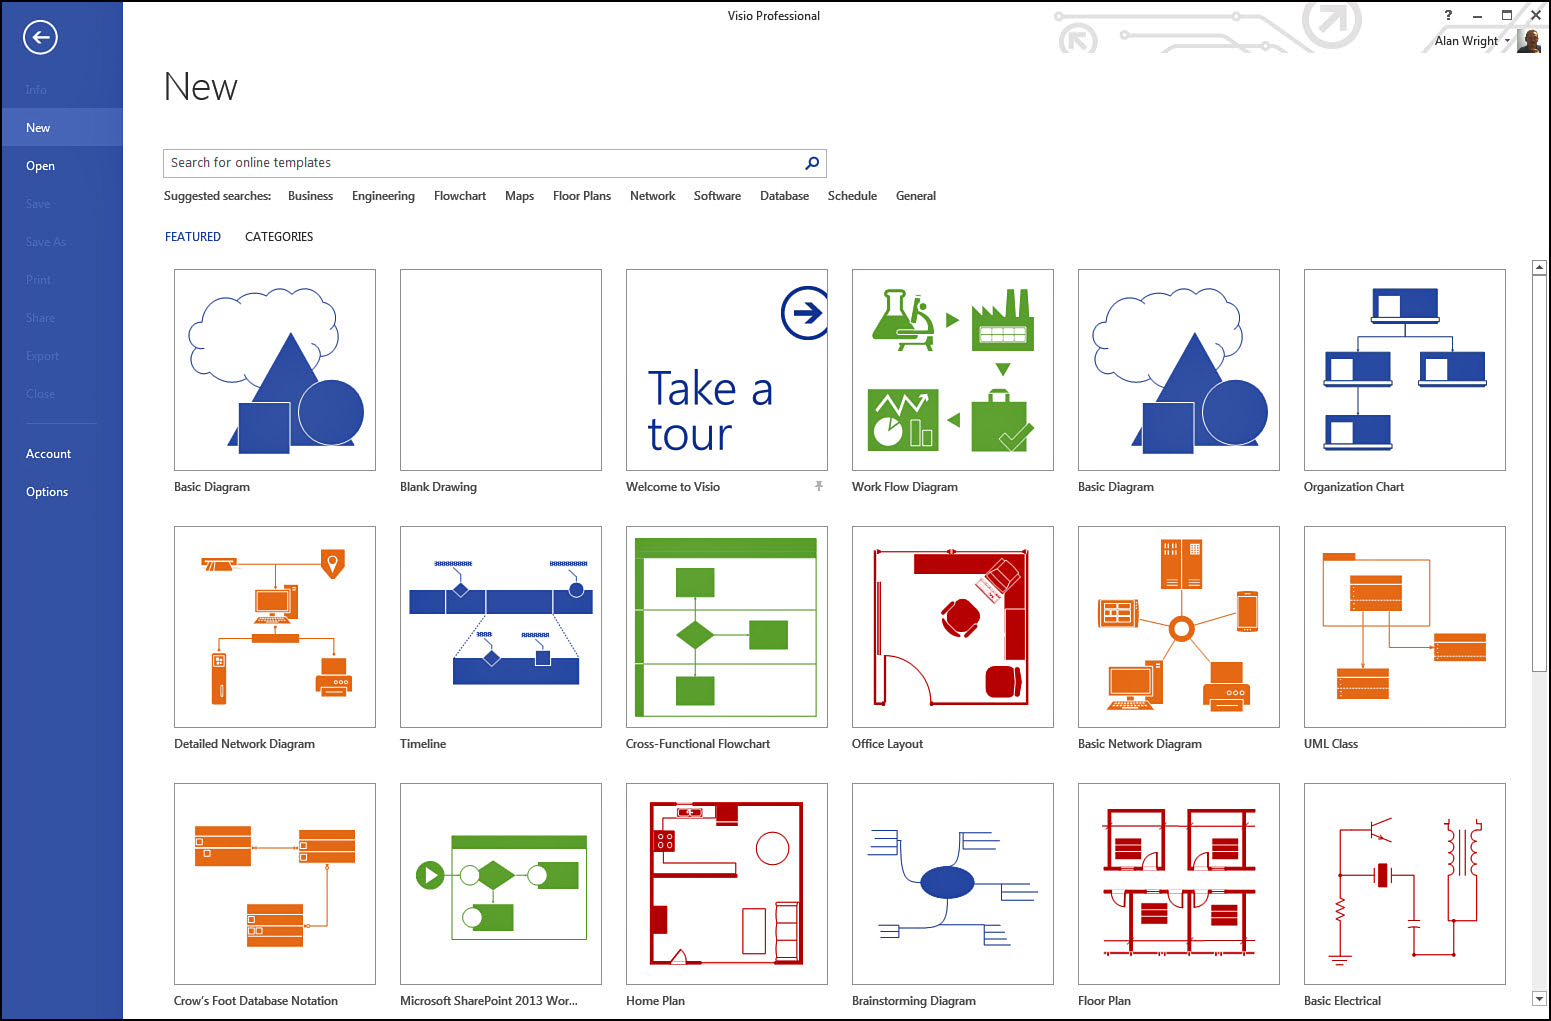
FIGURE 1.5 The template gallery offers many choices of drawings. These are a few of the templates that you can choose from in Visio Professional 2013.
Although these templates are included to provide the basic tools specific to a variety of fields and situations, you are not limited to these choices. Chapter 13, “Unique Needs: Touchscreens, Custom Templates, and Complex Printing Concerns,” looks at how you can create templates of your very own. Chapter 16, “Additional Visio Resources,” also suggests recommendations for websites that offer downloadable resources like templates.
To help you make sense of the way some of these templates are used, consider a few common examples:
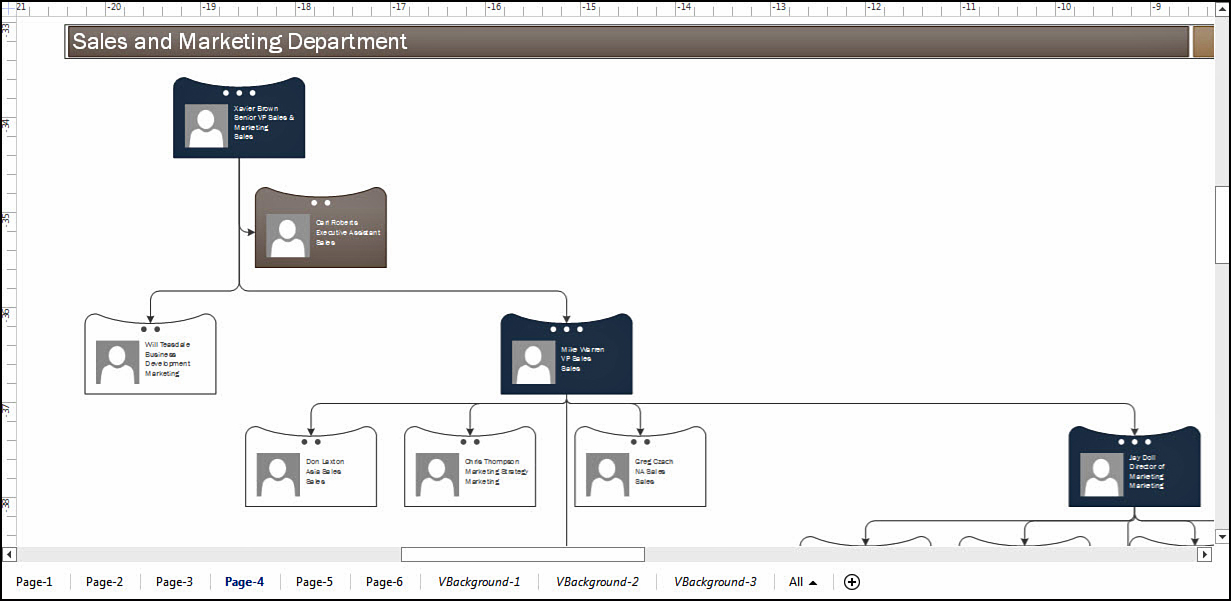
• Connected diagrams include flowcharts, network diagrams, brainstorming, org charts, database diagrams, and many types of engineering schematics that use lines to show how elements of the chart relate to one another or a correct flow for processes. Figure 1.6 shows an org chart that uses lines to show hierarchy.
• Block diagrams are often used to show concepts and illustrate relationships without using lines. Instead, shapes, colors, style, and the position are used to communicate how shapes and ideas relate to one another. Figure 1.7 shows a basic block diagram where smaller shapes represent components of a computer.
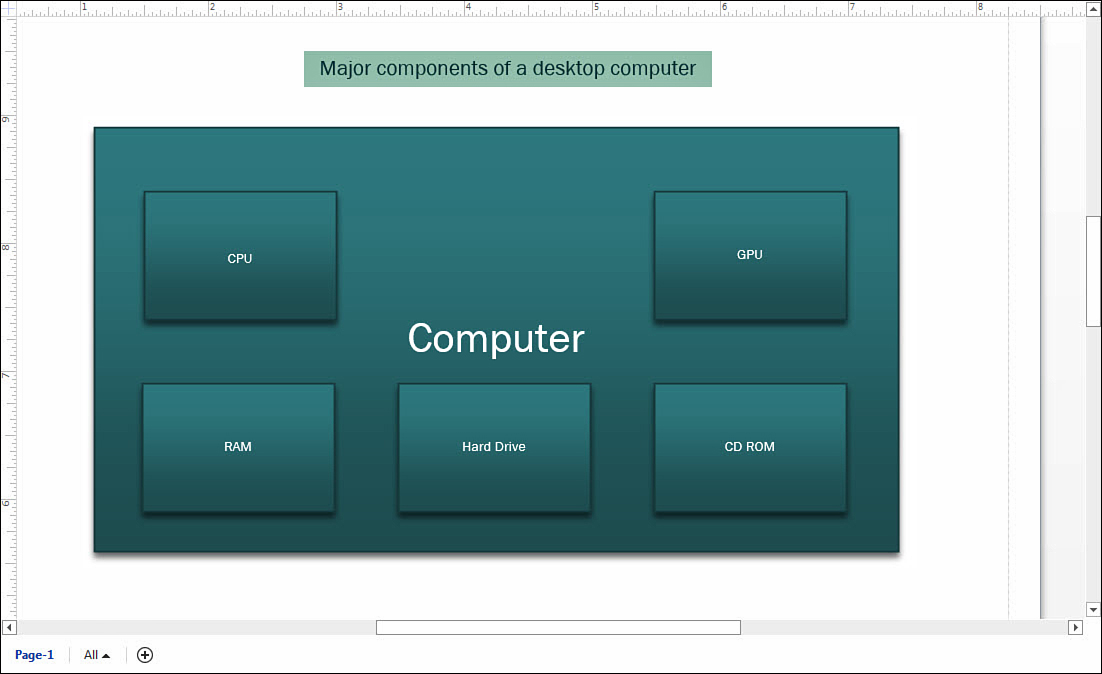
FIGURE 1.7 Block diagrams use positioning, color, size, and other visual cues to explain the relationship between shapes.
• Measured drawings include plans, maps, layouts, and views that rely on scale and measurements to communicate to the viewer. These are often used for planning and design and can be used to present ideas to clients. Figure 1.8 shows a floor plan with an assortment of dimensions that can be hidden or displayed as needed.
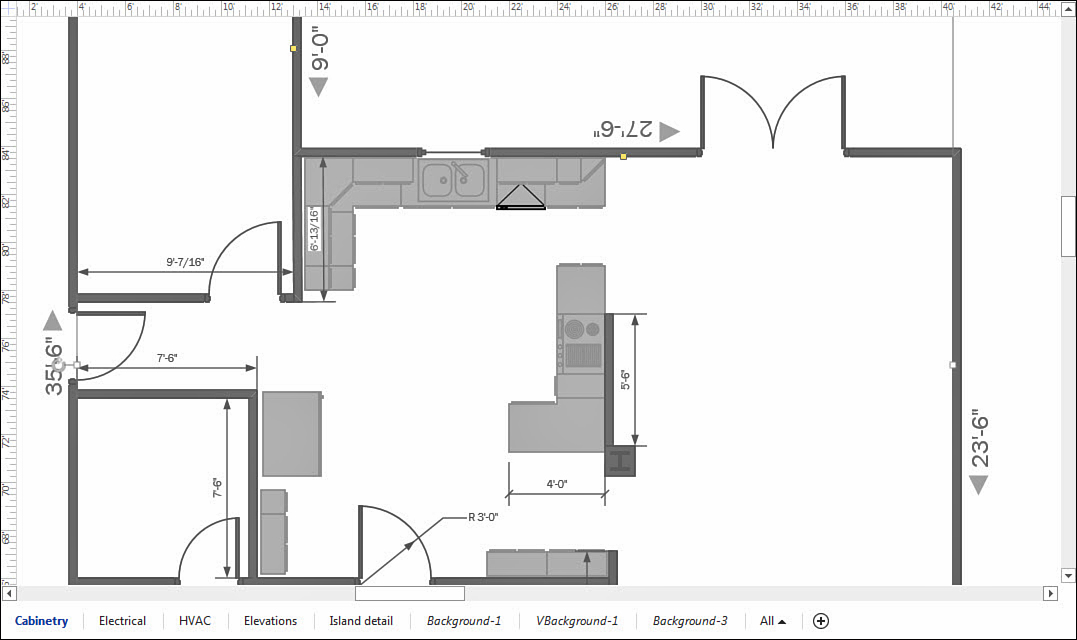
FIGURE 1.8 Measured drawings use measurements to accurately capture the position and size of drawing elements such as walls, doors, and windows.
Which Edition Should I Use?
There are three versions of Visio 2013 that you can choose from, and each provides unique features and advantages. Which one is for you? The answer depends on how you use Visio. Compare the basic features to get a better idea as to which fits your needs:
• Visio Standard 2013 is designed to work with basic business diagrams, organization charts, basic flowcharts, and multipurpose drawings. Table 1.1, shown earlier in this chapter, lists the 26 templates that are included. Some of the more advanced features are not included in this edition, such as importing external data and SharePoint integration.
• Visio Professional 2013 includes 50 more templates that allow you to create more advanced types of drawings, such as advanced process diagrams, engineering schematics, floor plans, logical network layouts, software mapping, and database and modeling. Enhanced tools for collaboration and many tools for linking data to your drawings are included.
• Visio Pro for Office 365 is a completely new subscription-based offering that includes the features of Visio Professional 2013. A person with an active subscription can install Visio Pro on up to five computers. Additionally, with an active subscription you can use Visio on Demand temporarily from any computer you happen to be using while logged in to your Office 365 online account, even if you are not the administrator or do not own the computer. You can save your work as you would with other Visio versions. Because it does not install onto the temporary computer, it simply is gone when you close the application.
What Is New in the 2013 Editions?
Microsoft recognizes that the way people and organizations work have changed. As a result, there are many new features in Visio that have been influenced by evolving needs and changing technology. People are more mobile, which creates challenges to collaboration and sharing; tablets have become more common in the workplace, which in turn has influenced the Visio interface.
Visio 2013 boasts updated and modern shapes and stencils. Many stencils have been improved with new shapes (see Figure 1.9), and new stencils have been created. Regarding shapes, the capability to change a shape has been added without the need to redo work or data when you decide a different shape would be appropriate.
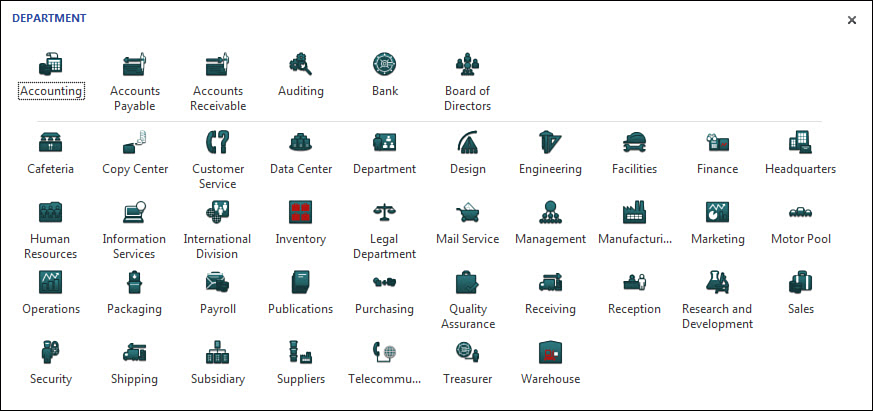
FIGURE 1.9 Visio 2013 includes updated stencils with modern shapes. Here the shapes in the Department stencil are shown.
For Visio Professional, drawings can be shared to a SharePoint server and then, using SharePoint Services, individuals without Visio can view Visio drawings from a SharePoint server. Multiple individuals can work on the same Visio drawing simultaneously, and even communication tools have been improved for collaboration from within Visio.
Improved Touch Support
Windows 8 and touchscreen-enabled devices have brought about a dramatic redesign of the ribbon interface and menus that make it much easier for you to use touch to work with Visio drawings. Figure 1.10 shows the Touch-mode-enabled ribbon interface.
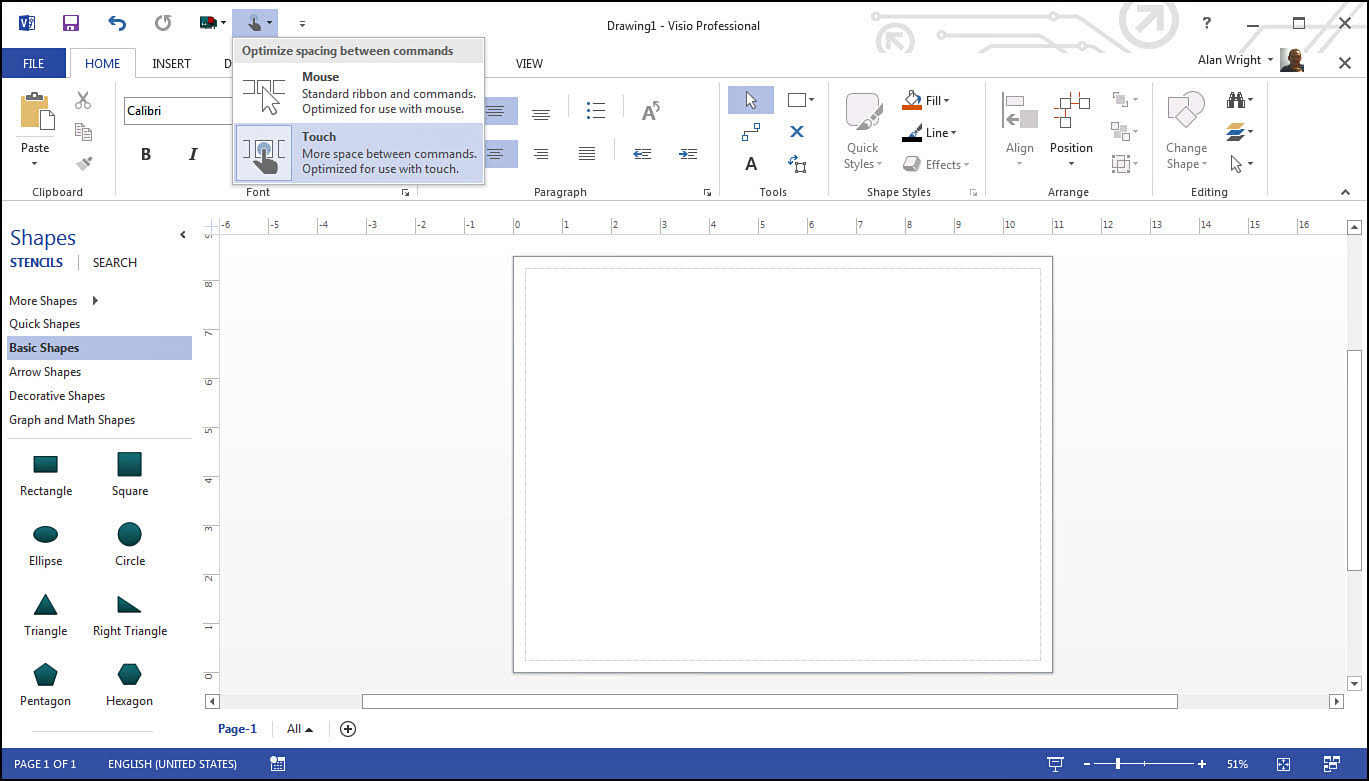
→ To learn more about using touch controls, see page 246.
Streamlined Layout
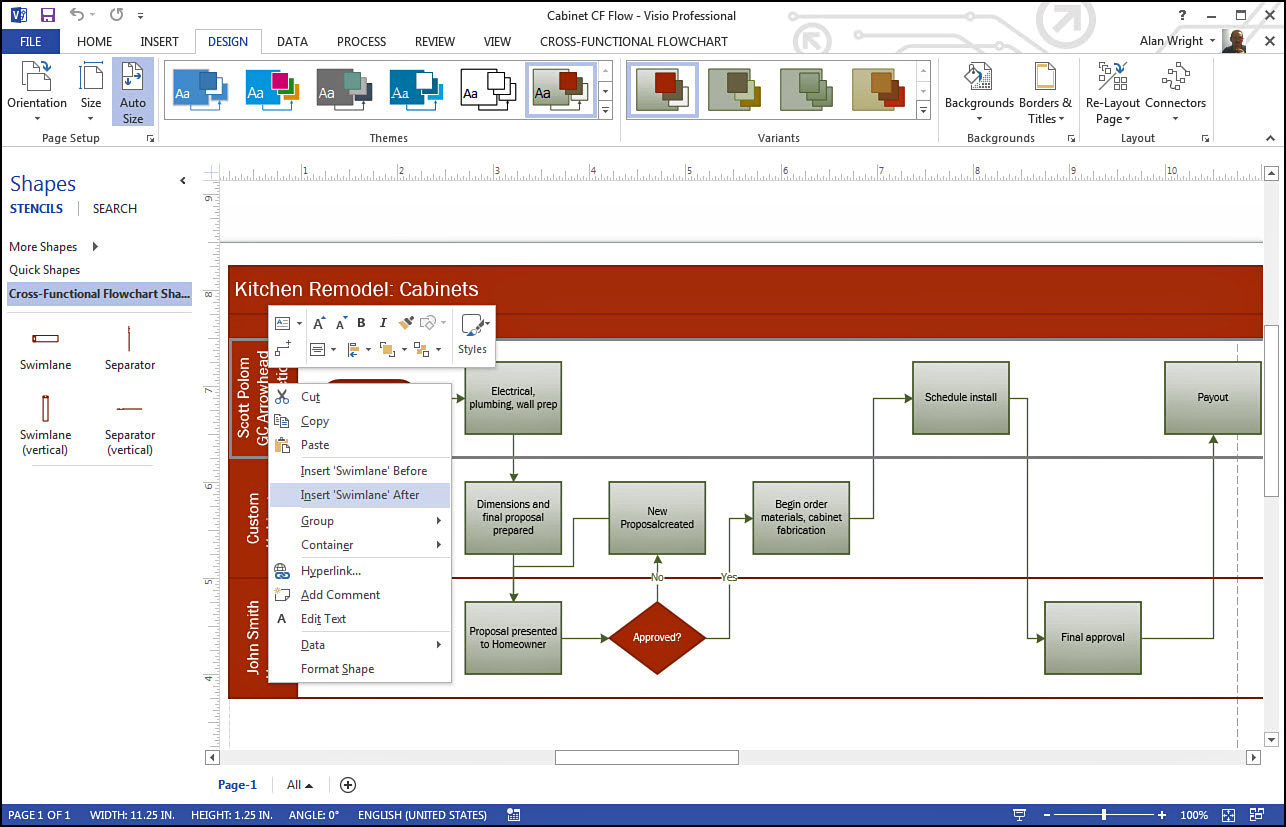
Work has been done to make tools easier to find and keep the drawing window at the focus of your work experience. Visio has so many tools to assist us that the interface can become cluttered, and you might forget where tools are located. To reduce this screen clutter, many tools appear as needed when you use a right-click to bring up the context menu, as shown in Figure 1.11.
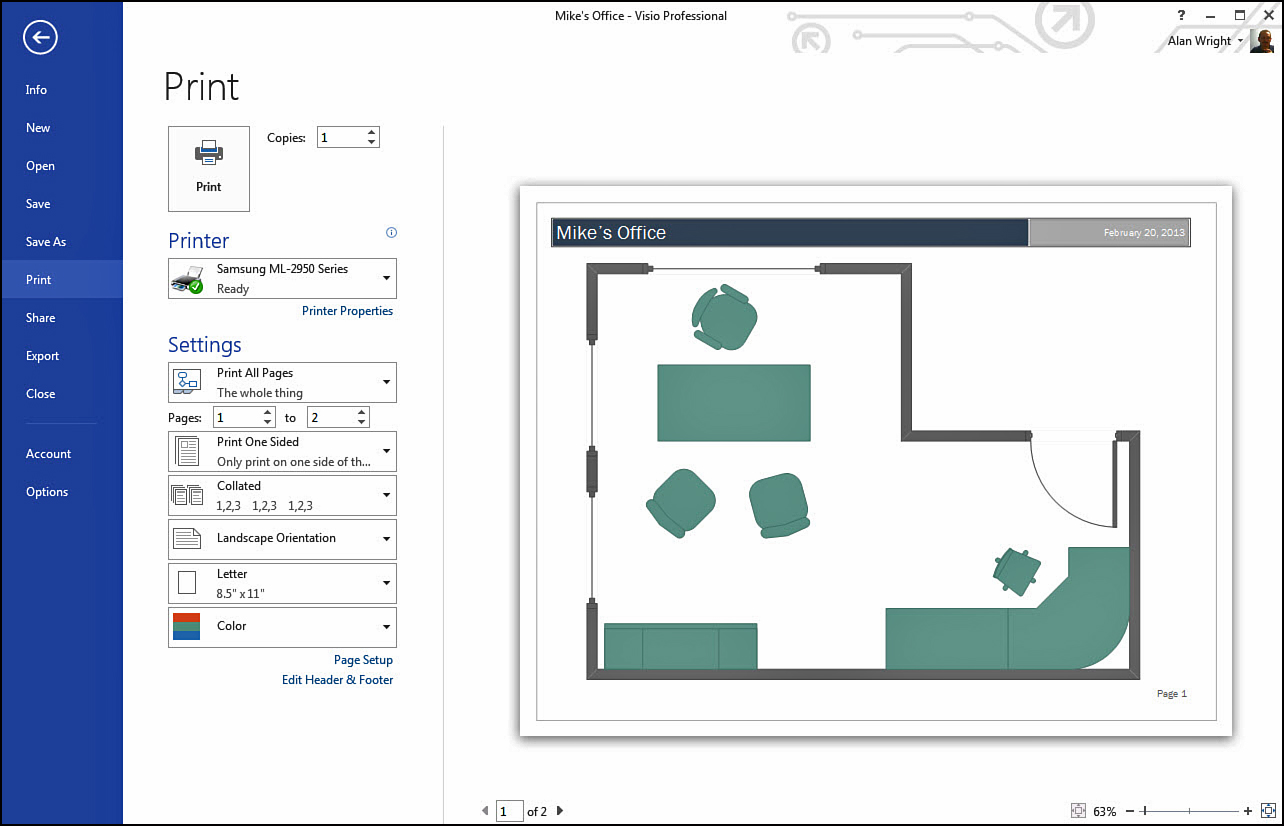
Another area that has been improved by this streamlining effort is the print preview. Shown in Figure 1.12, the Print Preview pane is a print-what-you-see live preview tool. You look closer at how to use this tool in Chapter 11, “Printing Visio Diagrams.”
The New VSDX File Format
Visio 2013 saves drawings to the .vsdx file format, which uses XML and brings Visio up to the standard that has been established for all the Office applications. This brings benefits such as smaller file sizes and easier data recovery, and third-party tools can work with XML to extract data saved to this format.
Drawings that have been created and saved to the older 2003–2010 drawing format can be converted to this new format, allowing you to take advantage of new themes, styles, and tools like co-authoring. You learn more about this format in Chapter 3.