
14. Using Data
In This Chapter
• What kind of secret data are shapes carrying around?
• Can I create my own shape data?
• How can I let shape data speak for itself using text in my shapes?
• How do I generate reports to see shape data in one place?
SmartShapes have the potential to contain an amazing amount of data called, oddly enough, shape data. Data can include names, numbers, descriptions, sizes, quantities, and so on. Imagine how much more impact your Visio drawings can wield when you understand how to use this often-hidden data.
This chapter considers how shape data is accessed and how you can put it to work. You also look at how to create your own types of shape data that enable you to capture data relevant to you and your business. Finally, you look at putting this data at your fingertips using reports.
What Can I Do with Shape Data?
Chapter 10, “Shapes: More Than Meets the Eye,” discussed SmartShapes and touched on the thought of data being contained in our shapes. This section delves deeper into this characteristic and considers how you can use this capability in your diagrams.
Exploring
Examine some of the predefined shape data fields from a couple of common diagram types.
1. Open a new Basic Flowchart template.
2. Add a Start/End shape and a couple of Process shapes.
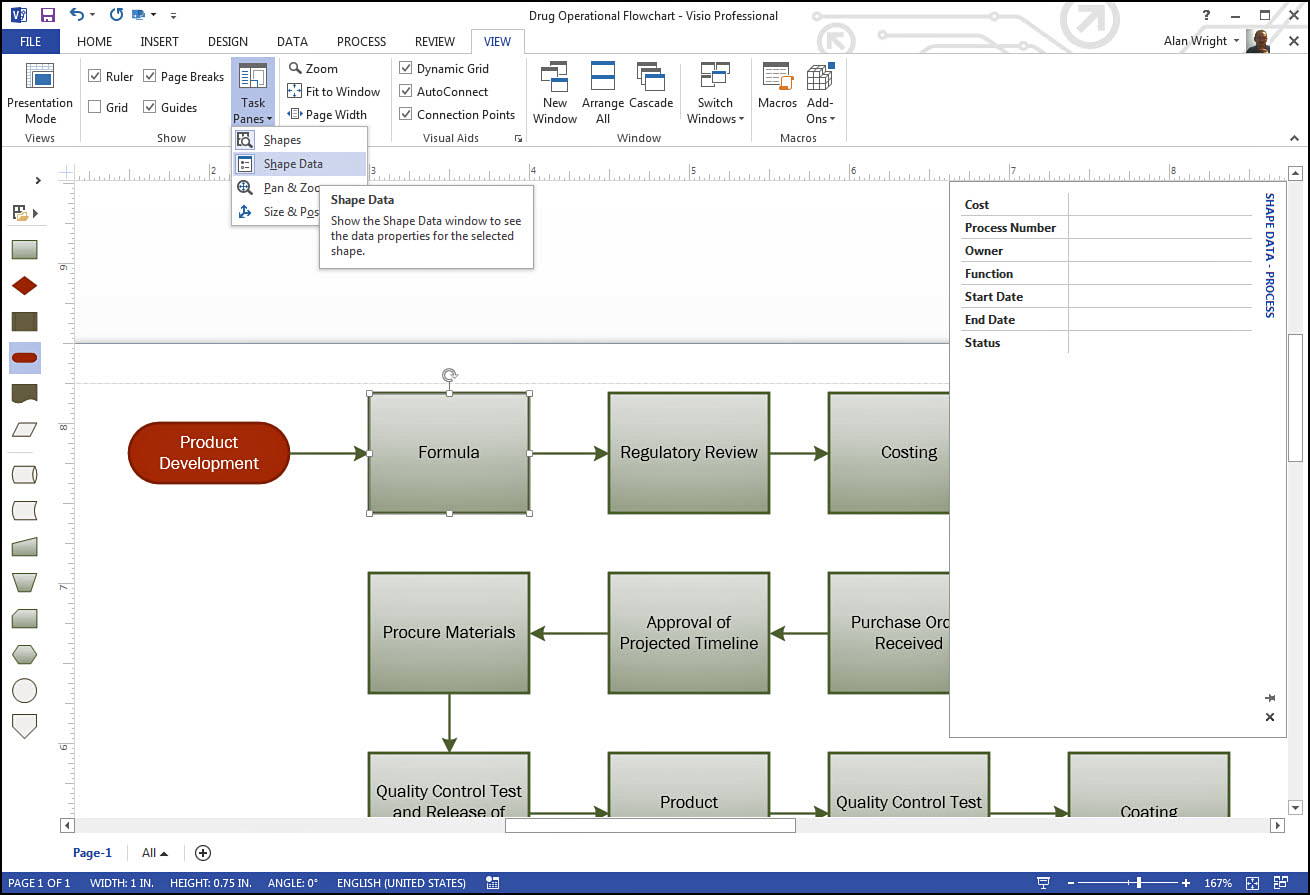
3. If not open already, select the View tab, and from the Show section select Task Panes and enable Shape Data.
4. Select one of the shapes. Notice in the Shape Data pane that there are several fields for data, such as Cost, Process Number, Owner, and so on (see Figure 14.1).
5. Open a new Basic Network Diagram–3D diagram template.
6. Add a router and a couple of server shapes.
7. As in step 3, select a server and look at the Shape Data pane (see Figure 14.2). Notice you can add data to many more fields that would be unique to a network server.
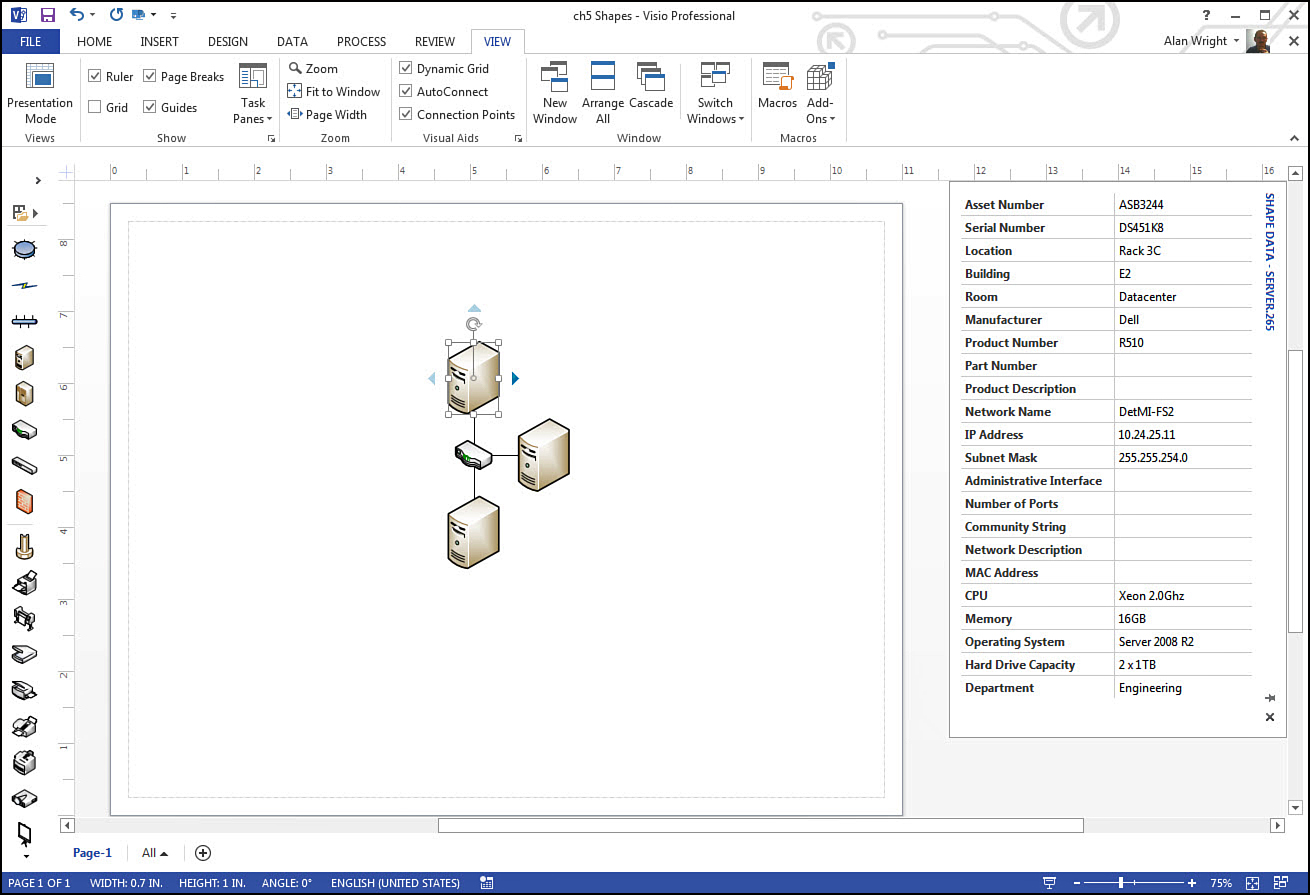
FIGURE 14.2 Shapes can have a few or many fields, depending on the anticipated usage of the diagram and shapes.
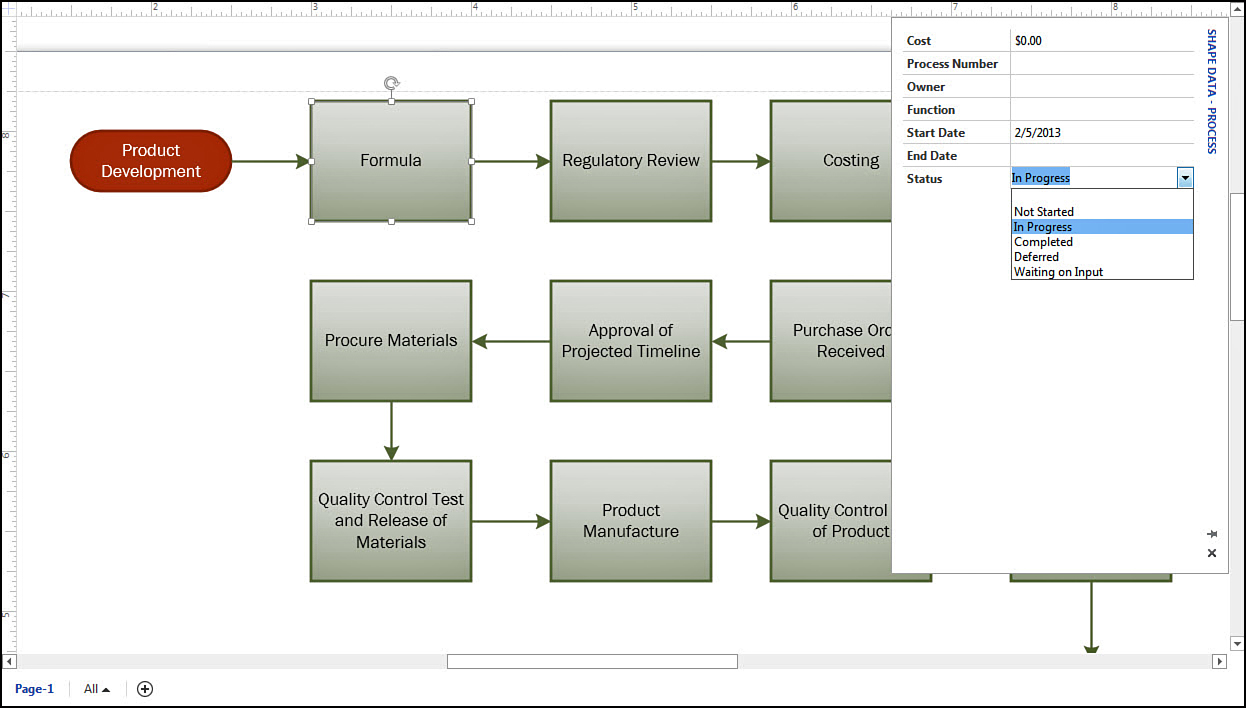
You can see in Figure 14.1 that the fields are blank. A flowchart can be used for many purposes, and some fields may be relevant and others not so much. You can manually enter the values that pertain to your flowchart, as was done in Figure 14.2. What is nice with Visio is that many fields have input controls that help you be consistent. In Figure 14.3, notice that the Status field offers five choices. You can type in text of your own choosing, but this is one way to ensure consistency. Date fields offer a navigable calendar for dates, and fields related to monetary units convert numbers into money.
 Tip
Tip
You can select multiple shapes that are similar and edit the Shape Data fields for all selected shapes at once. For example, in Figure 14.1 a few processes might have the same owner. You could select all those shapes while holding down Ctrl and then modify the Owner field in the Shape Data pane. All selected shapes now have that owner when looked at individually.
Types and Uses
Depending on the diagram type and the shapes used, shape data can be static information that is held for reference, or it can influence the visual configuration of the shape in your diagram.
Notice in Figure 14.4 that shapes added to a floor plan have dimensional shape data revealed in the Shape Data task pane. Changing the dimensions immediately changes the size of the shape in your floor plan. This holds true for windows and doors. Most dimensional fields have input fields that reflect common standard sizes, which is again very useful.
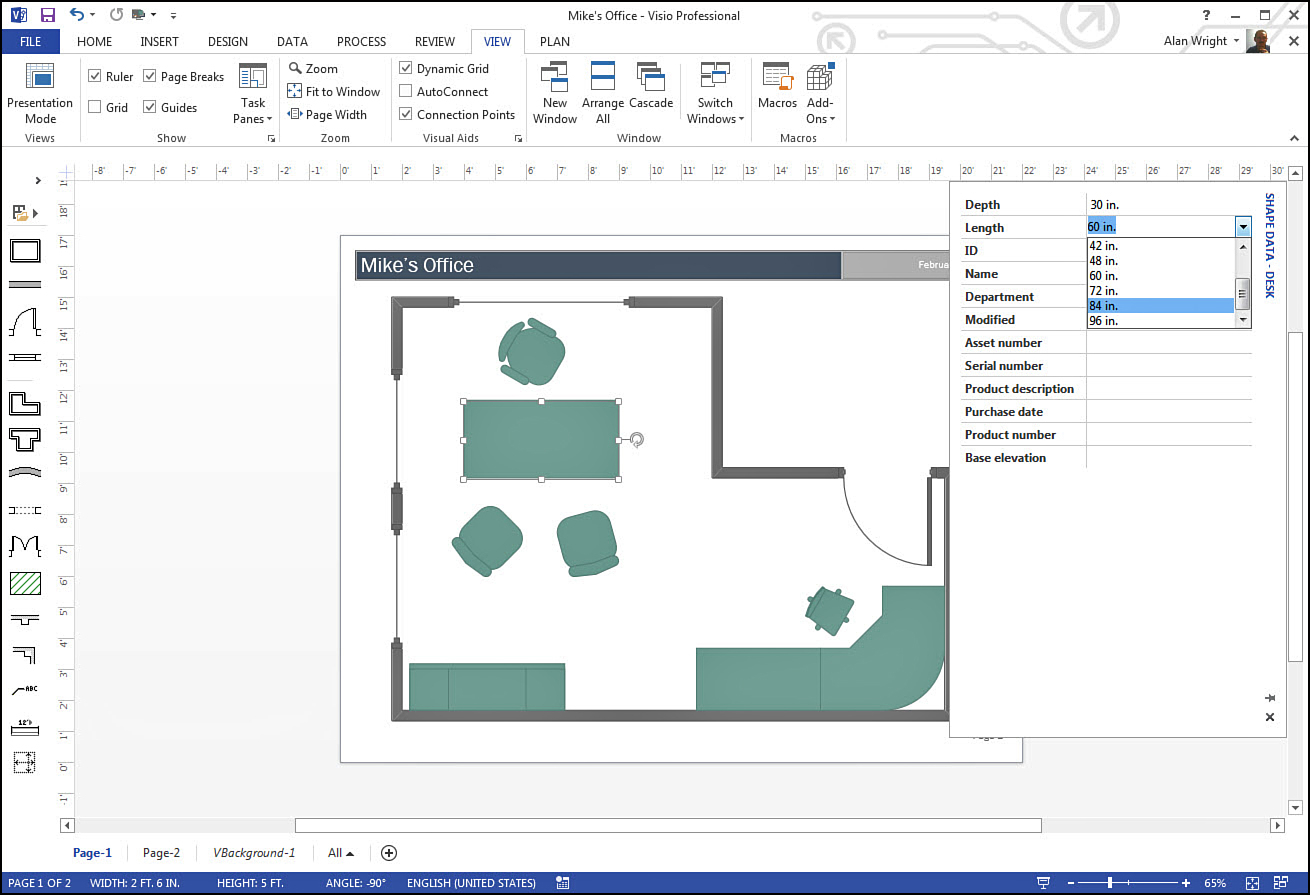
FIGURE 14.4 Shape data can also influence the way shapes are displayed in a diagram. Here, the change in shape dimensions changes the size of the desk displayed in the floor plan.
How Can I Use Shape Data in the Real World?
If you thought in the past that Visio was a simple tool for making attractive diagrams, perhaps you start to see new ways to use Visio based on this capability to hold shape data. Building managers and office administrators often struggle with keeping track of assets. How does your company track cost, purchase dates, manufacturer, and other relevant details?
Overworked network administrators and engineers cannot memorize all the details about hardware and ownership for servers that populate their topography. Although many types of network management software exist for auditing and monitoring equipment connected to a network, this is not always an effective method for keeping tabs on company assets. Items such as part numbers, vendors, and contact information can be easily added to shape data.
Companies face the reality of losing key employees that take information that can be very time consuming to re-create. Visio enables administrators and managers to use many ways to centrally manage information that might otherwise be fragmented and lost.
Creating Shape Data Fields
Although it is nice when you find shapes that have everything predefined, at times you may have a special project or need that is not, and no SmartShapes seem to work. You can create your own Shape Data fields easily. Consider some ways to do this.
Add a Simple Data Field
Create a shape that allows you to track paint colors. It is a simple shape you can drop into a room that contains details for the room.
1. Create a new Blank Drawing.
2. Create a basic circle shape using the Home tab and drawing tools.
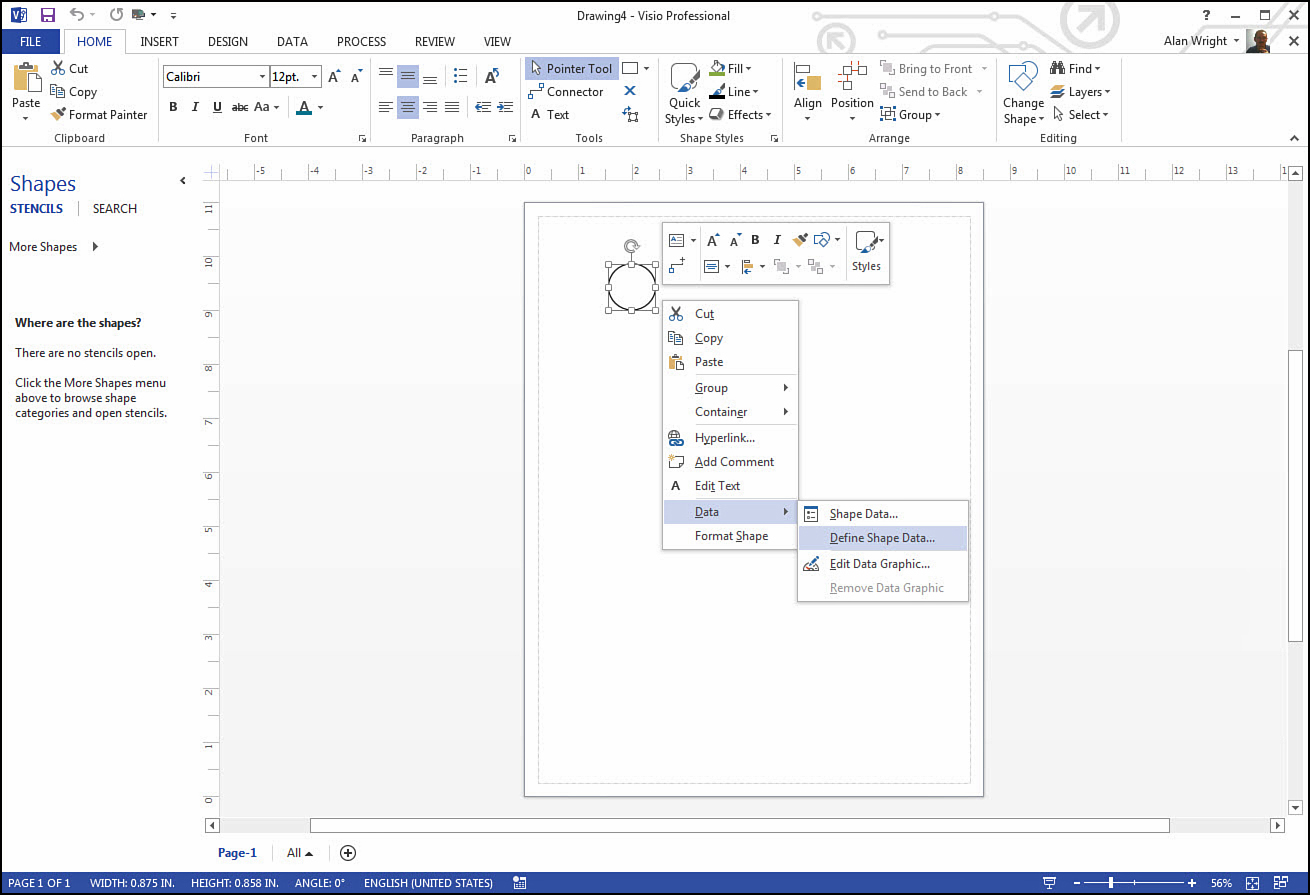
3. Right-click the circle and select Data, Define Shape Data as shown in Figure 14.5.
4. In the Define Shape Data dialog box, change the Property1 Label to Wall Color (see Figure 14.6).
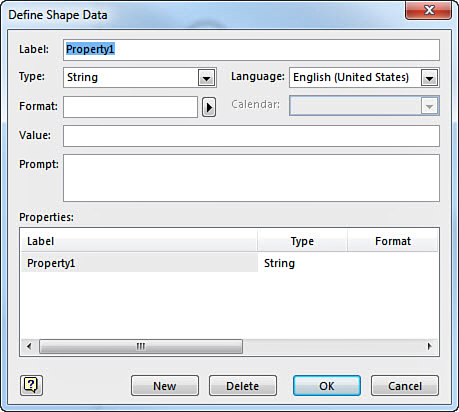
5. The Type remains String; Format can be Normal; and you can input a Prompt, if you would like. Prompts present hover text when inputting information.
6. Select New and replace the Label Property2 with Gallons. The Type is Number, and Format can be General Units.
7. Repeat step 6 a few more times, adding Brand, Trim, Cost, and Date Labels with appropriate type and format fields until you have something like Figure 14.7.
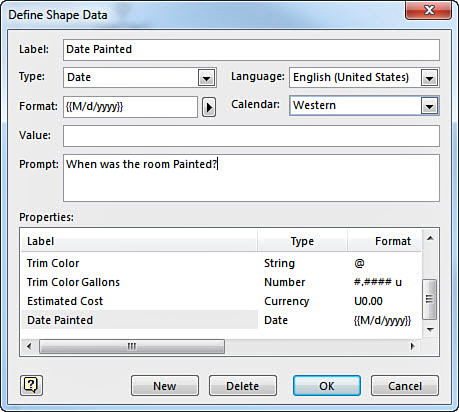
FIGURE 14.7 Add several new labels to a shape to collect the precise data you want to refer to later.
8. Select OK when you’re finished, and select the shape. Make sure that the Shape Data pane is visible and you see something like Figure 14.8.
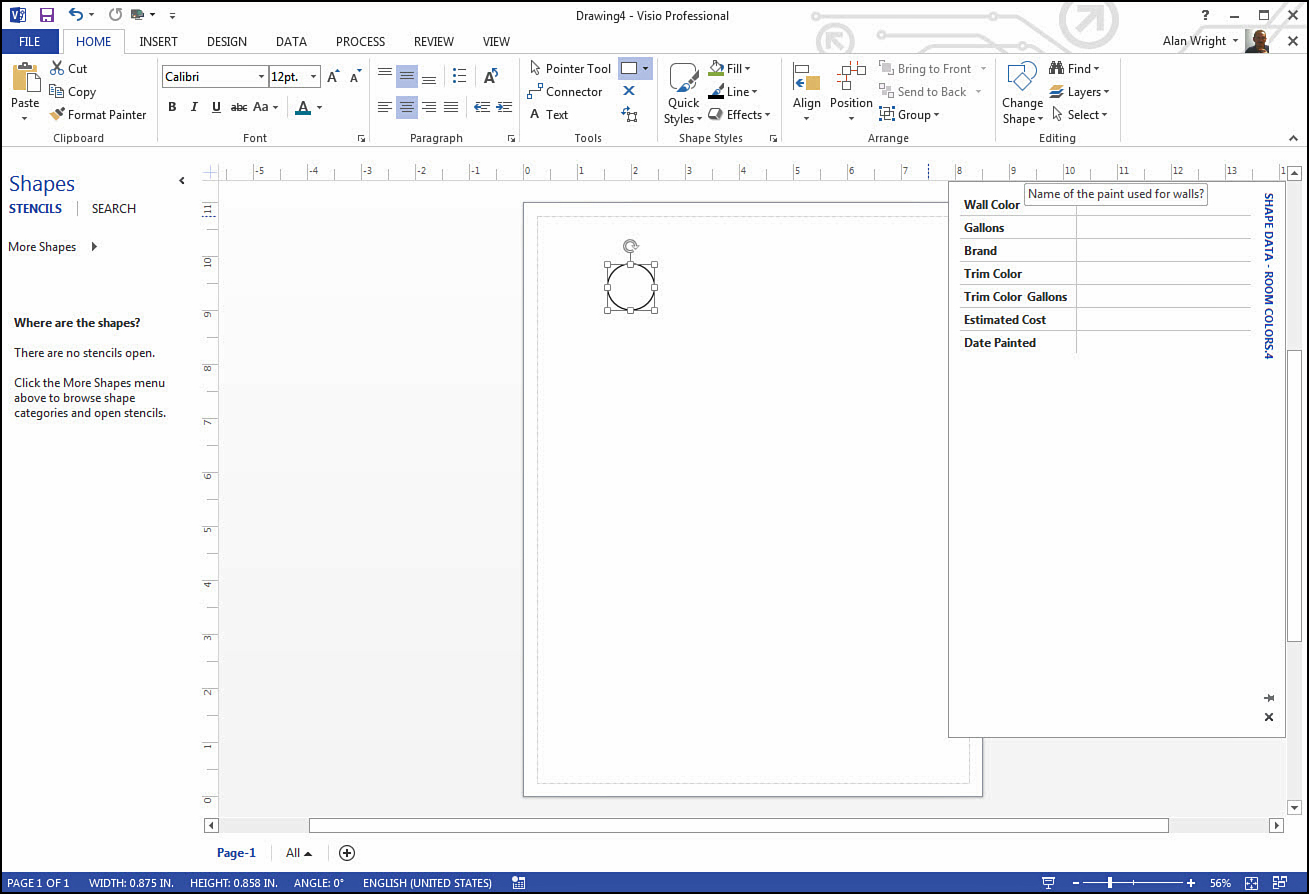
FIGURE 14.8 Work with the Define Shape Data window until you see the desired results in the Shape Data pane.
This shape can be added to a custom stencil and dropped into floor plans to hold information later, as shown in Figure 14.9.
→ To learn more about adding shapes to stencils, see page 91.
Selecting the Correct Data Type
The type of data you use is an important selection to make because it determines the format of the shape data. As shown in Figure 14.10, you can choose from eight types of data.
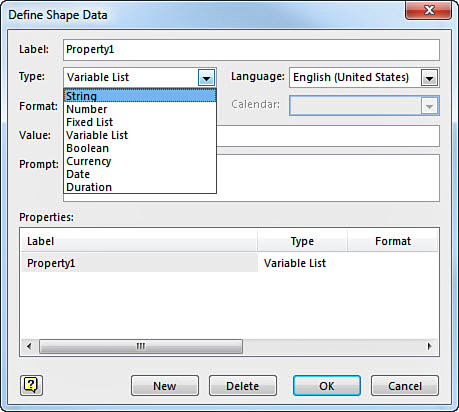
• String data refers to text; it can be formatted as normal, uppercase, or lowercase.
• Number data can be a whole number, a number with units of measurement, or decimal points; fractions can also be included in the formatting.
• Fixed List refers to a drop-down list that you establish with no choice for indicating anything outside of the list.
• Variable List includes a drop-down list with the option to type in a custom entry.
• Boolean offers a simple true or false choice.
• Currency provides a few variations based on currency currently selected for the computer system.
• Date offers a calendar; however, you can type in a date and Visio presents it in the indicated format. Format can include day and time aside from the normal variations of date.
• Duration allows formatting for weeks, days, hours, minutes, seconds, and a combination of hours, minutes, and seconds.
Adding Lists and Format
Adding lists is relatively easy, and it can save time later when you know that selections for a data field fall most likely into one of a few possible options.
Use the Wall Color field that you created earlier for maintaining a log of paint colors. Imagine this is used in a set of offices that have limited colors to fit a corporate standard.
To add a fixed list, follow these steps:
1. Select the shape you created in the last example (or create a new one).
2. Right-click and select Data, Define Shape Data to open the Define Shape Data dialog box.
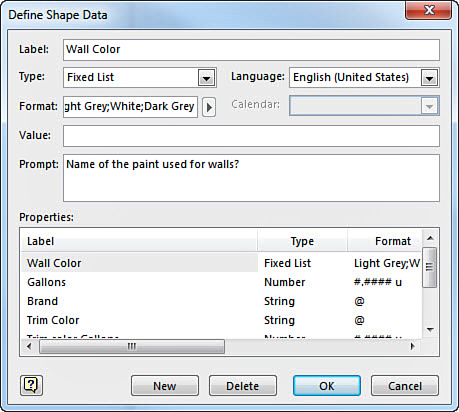
3. For the wall color, change the Type from String to Fixed List.
4. As shown in Figure 14.11, add the list contents to the Format field. Type list items separated using semicolons and no spaces.
5. Click OK. Notice that now the shape offers a fixed list of colors for the Wall Color field, as shown in Figure 14.12.
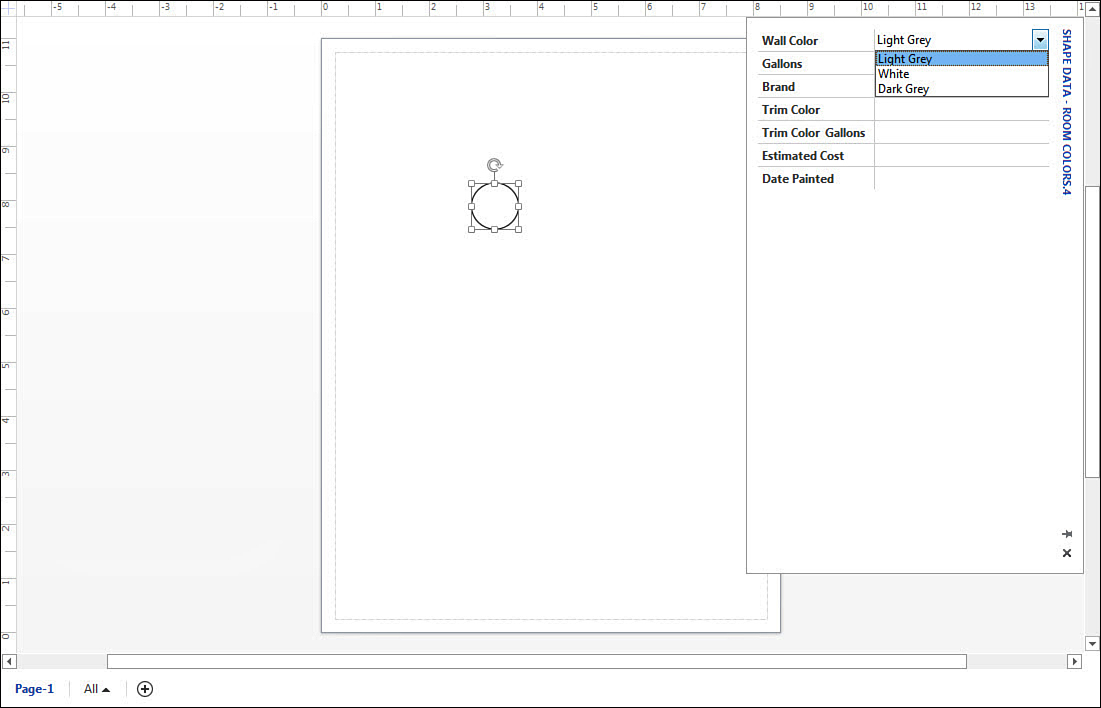
FIGURE 14.12 Fixed lists can save time when you are able to predetermine possible choices for shape data.
If you want to allow for additional choices, use the Variable List option and follow the same steps described previously. You can still have a list in the Format field, but there is the option to type in data that you could not anticipate.
Saving a Set of Shape Data Fields
After you have created a set of custom Shape Data fields, you can save and apply the set of shape data to additional shapes. Imagine a shop that fabricates custom cabinets. A list of available colors and sizes and styles for cabinets could be created and then applied to units with different sizes.
Stick with the paint list that you created earlier and apply it to a different shape to illustrate how this would be done.
1. Select your circle shape from earlier that has all the data fields you created, and make sure the Shape Data pane is visible.
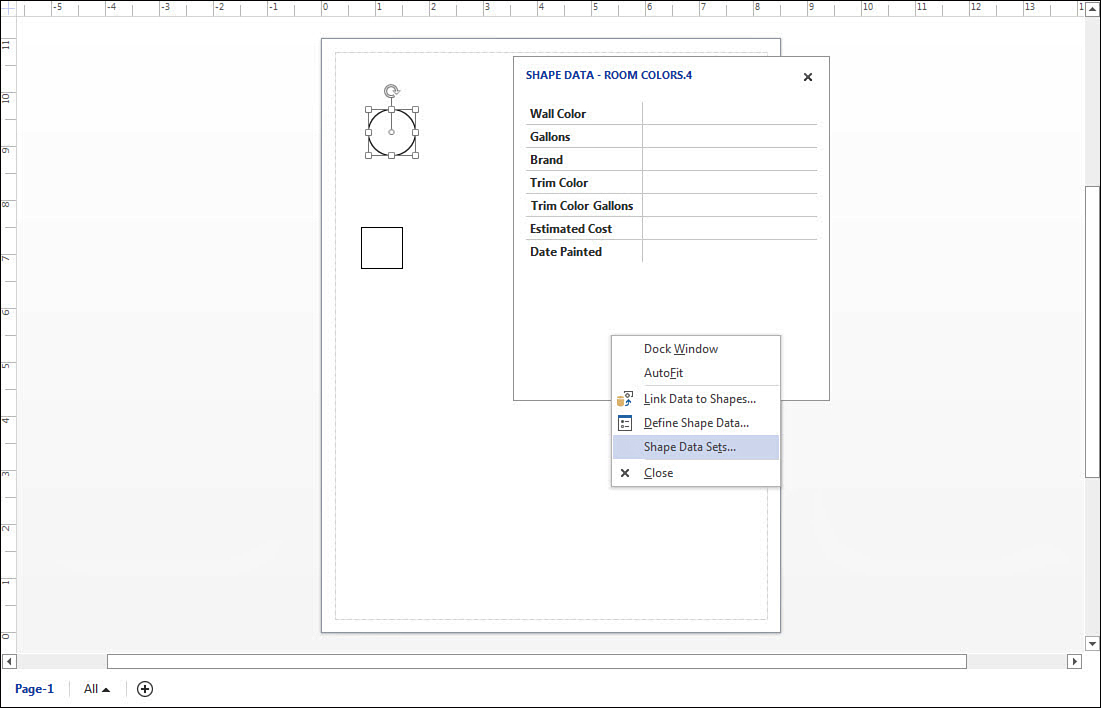
2. In the Shape Data task pane, right-click and select Shape Data Sets, as shown in Figure 14.13.
3. In the Shape Data Sets pane, select Add.
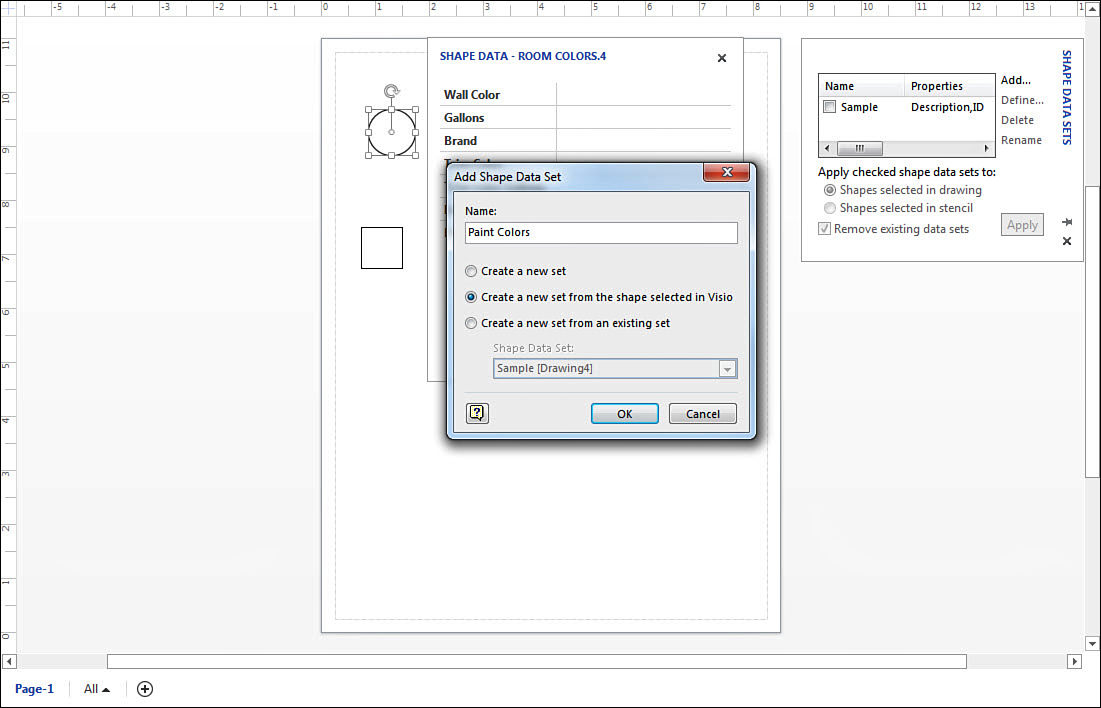
4. In the Add Shape Data Set pane, type in a name for this set of data fields. Notice you are copying from the selected shape (see Figure 14.14). Click OK.
5. Create or select a different shape, and in the Shape Data Sets pane select the new set that you just created (see Figure 14.15).
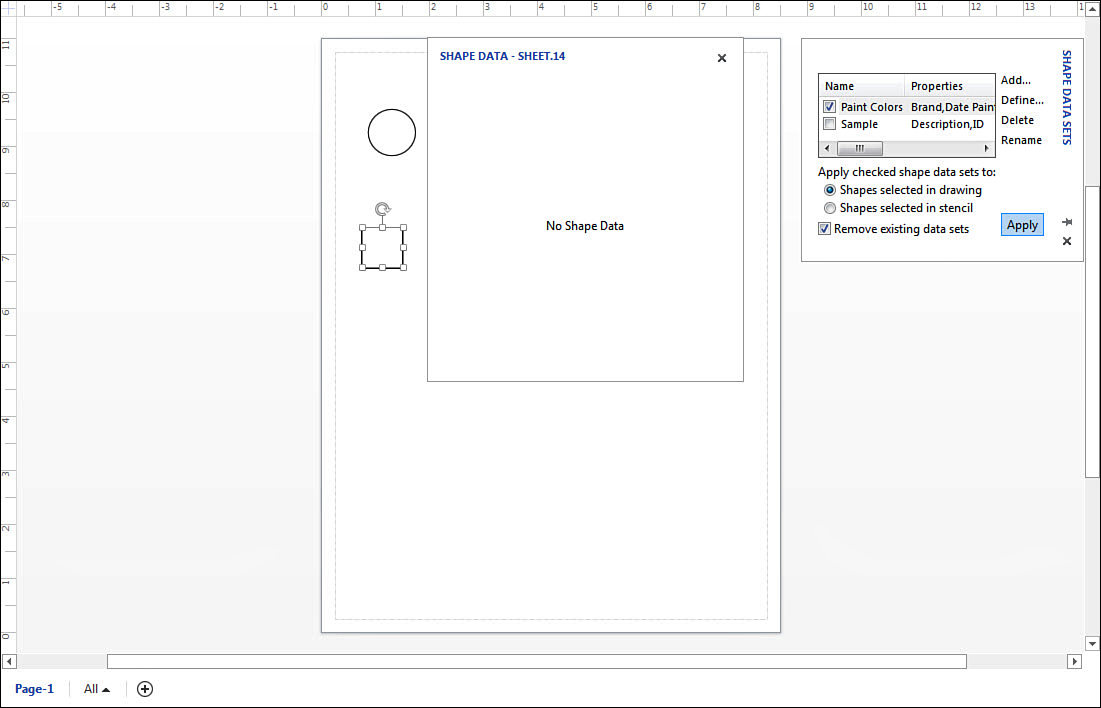
6. Notice the other options that are selected by default in the Shape Data Sets pane, Apply checked shape data sets to. Shapes selected in the drawing, and the Remove existing data sets. Click Apply.
7. Select and compare the original shape and the new one. They both have the same data fields.
If you close Visio, the shape data sets are not saved for the next session. You need to open a shape that has the set of shape data you created and add this set again if you want to apply to additional shapes. For this reason it is a good idea to add shapes to a custom stencil where the data fields are retained for use elsewhere. The data set can be pulled from a saved drawing as well.
Displaying Text in Shape Data Fields
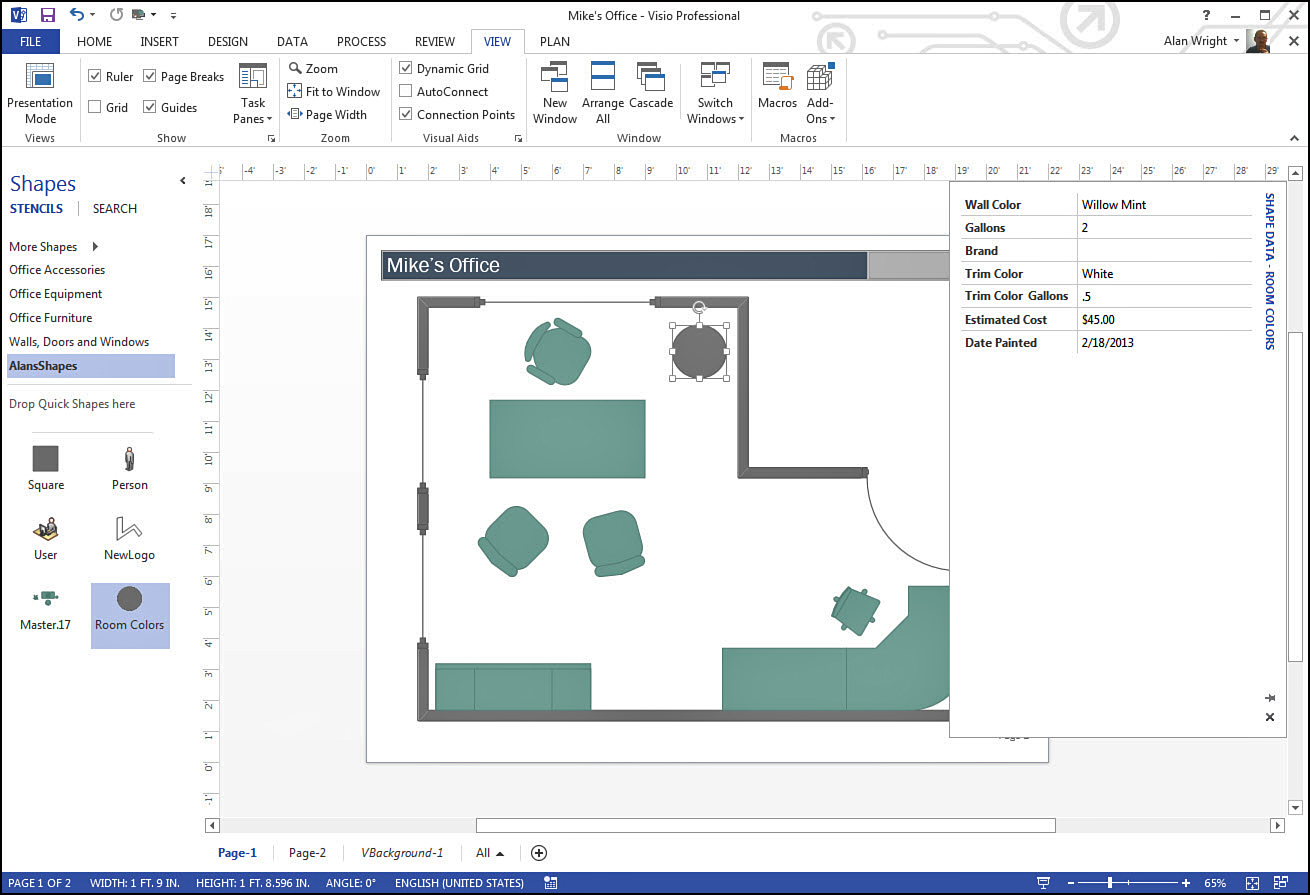
Now that you know how to add data to a shape, you might find it useful to display this hidden data. For example, if you plan to print a floor plan and you would like to see the wall color choice you created earlier in this chapter, you can enable that choice easily.
1. Select a shape with shape data.
2. Select the Insert tab and select Field from the Text tool group. This will open a Field dialog box.
3. In the Category: column, select Shape Data.
4. In the Field name: column, select the data field you wish to display. In Figure 14.16, the field “Wall Color” is selected.
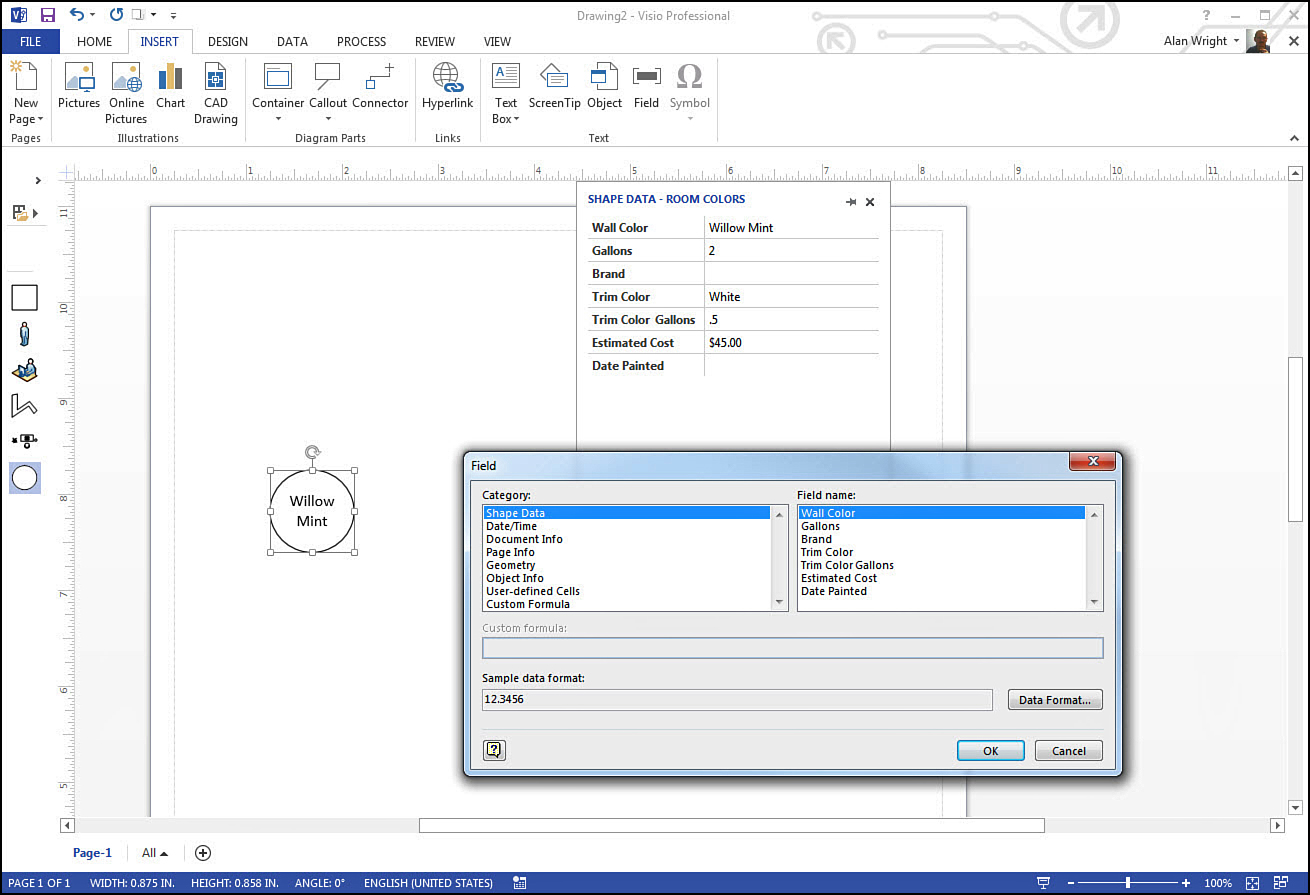
5. Click OK. In Figure 14.16, the shape displays the words “Willow Mint,” which is the value that is held by the Wall Color field in this example.
→ To learn more about inserting Text Fields, see page 160.
Creating Reports
Visio has the capability to generate reports that summarize shape data information. This can be very useful for inventory tracking.
Using the Report Definition Wizard
To illustrate how these reports work, use the Paint Color shape from earlier in this chapter. In Figure 14.17, you can see that this shape has been added to a basic set of floor plans. Information has been filled out for each room. Now you generate a report in one place that tells you how much paint was used and the colors.
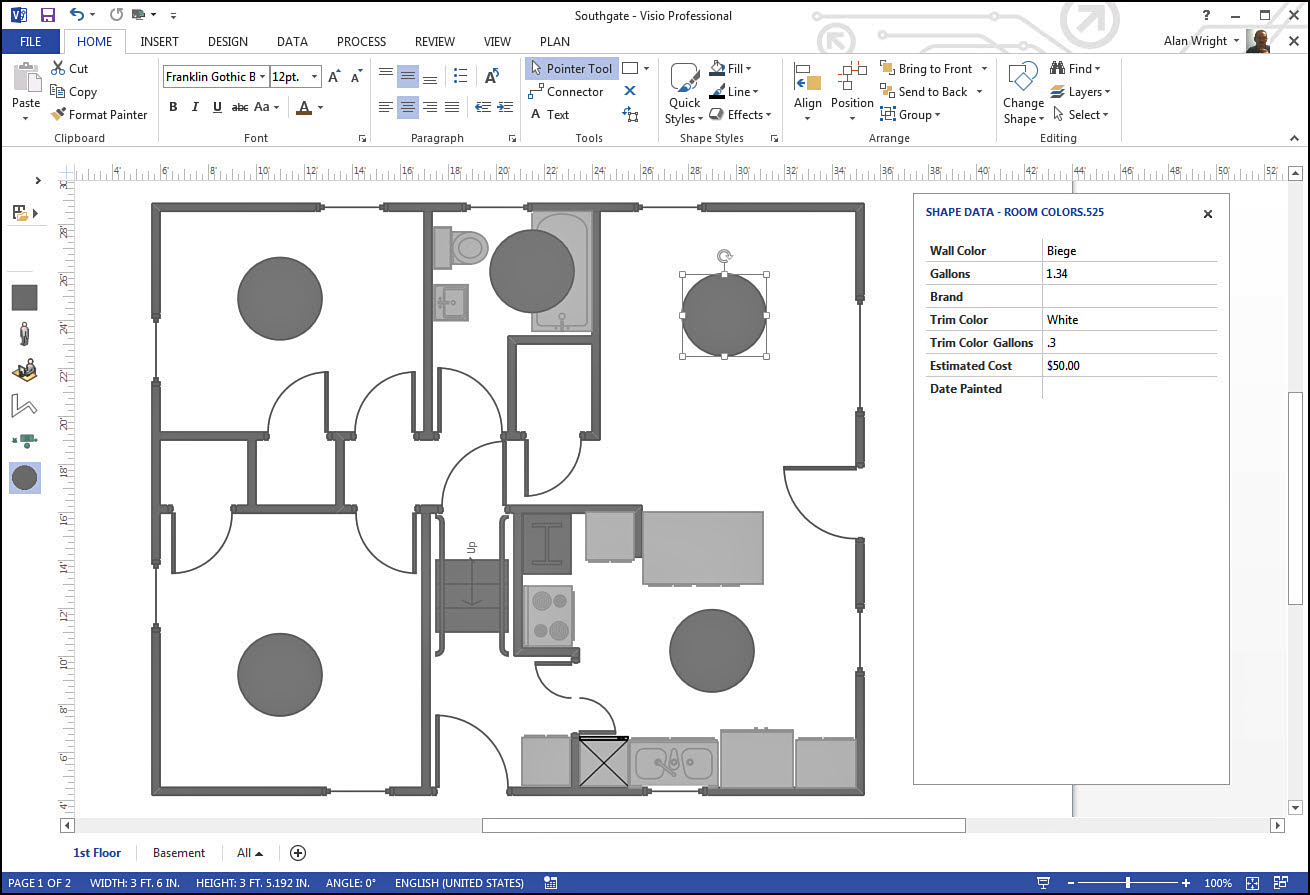
FIGURE 14.17 Visio allows you to create reports from shape data. For example, you can get a report for paint colors and costs.
Start by creating a new report using the Report Definition Wizard.
1. Open a drawing and add the Paint Color shape from earlier to a new page. A new page named Paint Report was added to the floor plans in Figure 14.18.
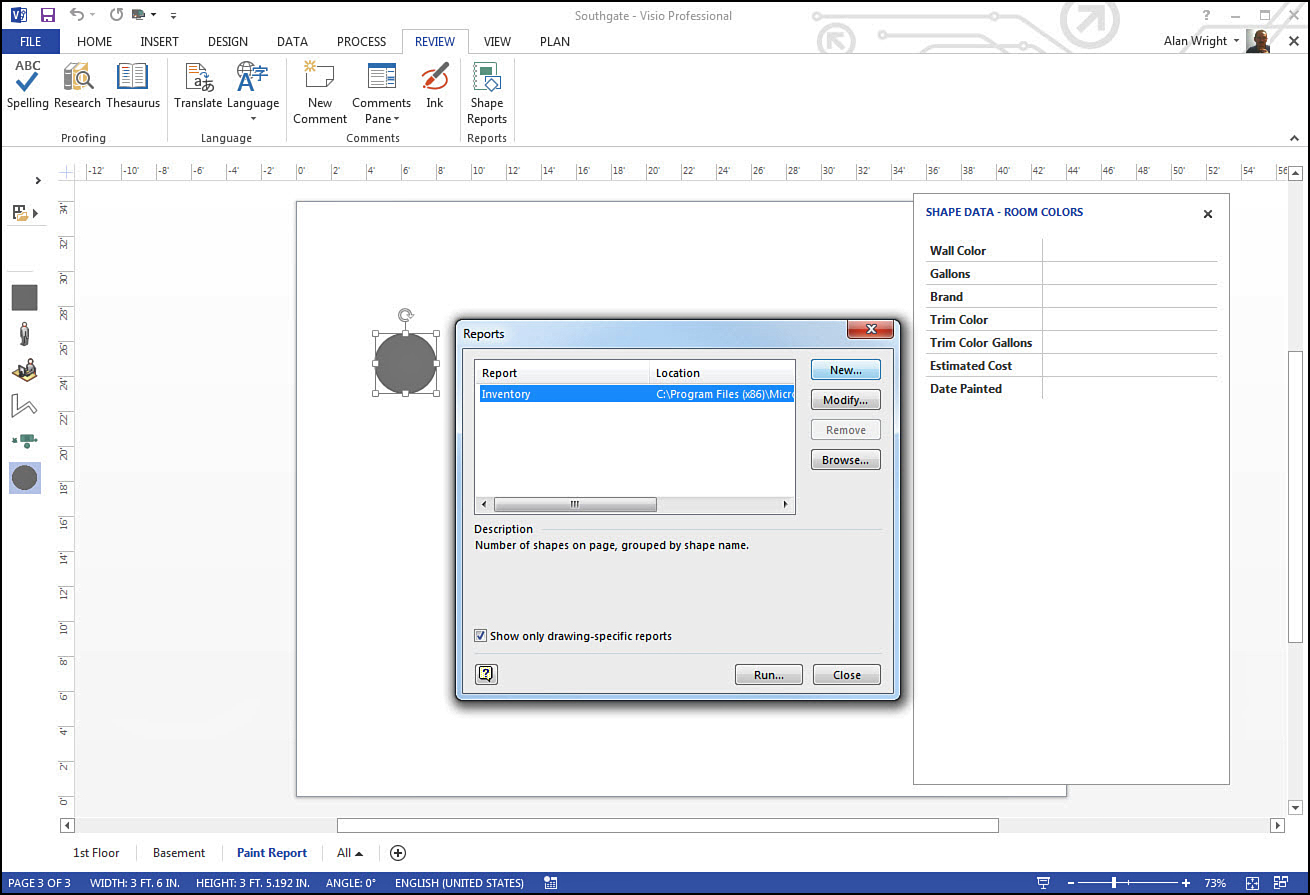
2. Navigate to the Review tab and select Shape Reports. In Figure 14.18 you can see the Reports dialog box that opens.
3. Select New to open the Report Definition Wizard.
4. Select Shapes on the current page. Before clicking Next, select Advanced to refine the shape data that is included in the report.
Tip
As shown in Figure 14.19, you can define reports to look at a single page from a drawing, all pages, or only selected shapes. Use the Report Definition Wizard to create or modify reports accordingly.
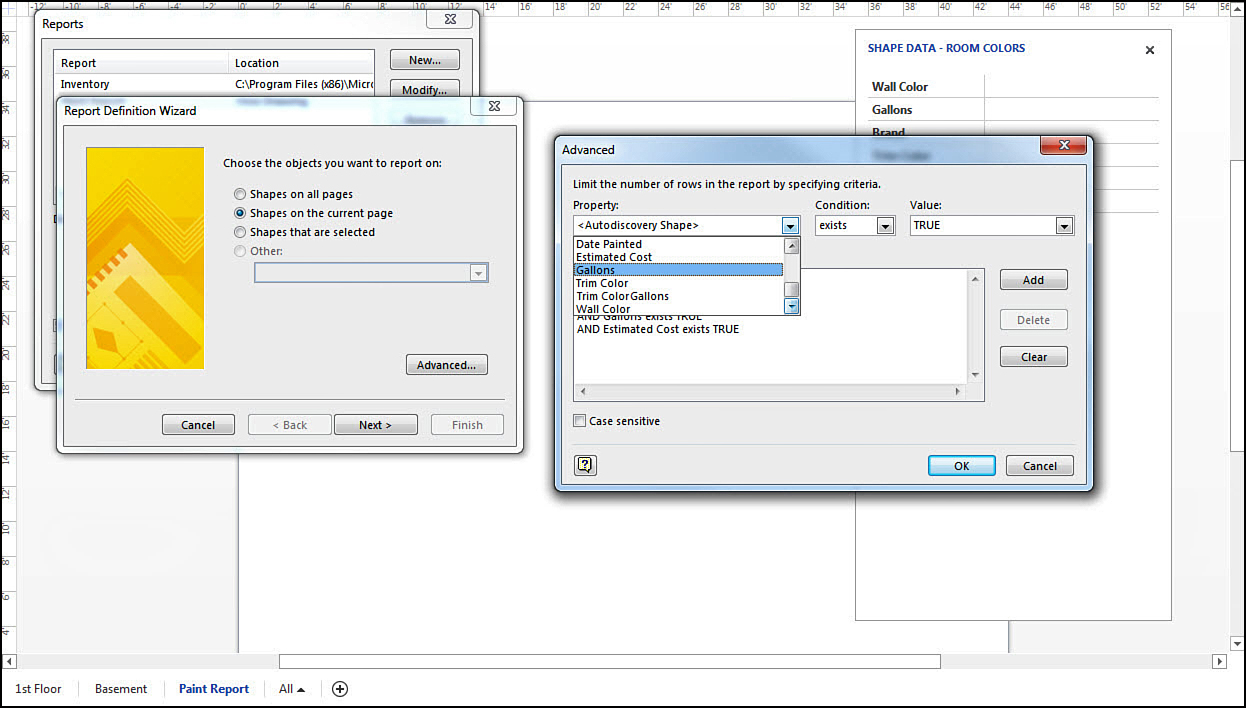
FIGURE 14.19 It is a good idea to use the Advanced dialog box to refine the report definition criteria.
5. In the Advanced dialog box, expand the drop-down labeled Property. As shown in Figure 14.19, you want to change the Condition to Exists and the Value to True for any Shape Data fields you want to include in the report. Use the Add button to add them to the Defined criteria field. Click OK when finished. If you do not refine the criteria, Visio includes many common bits of shape data criteria, and the report leaves a blank row for those properties, which needlessly clutters up the final report.
Tip
The Condition and Value fields in Figure 14.19 allow for a very flexible array of definition criteria for your report. Experiment based on the need for the report. For example, if you only want data included that has value in excess of a certain monetary amount, you select a Condition of Is Greater Than and input a Value to use for the baseline value.
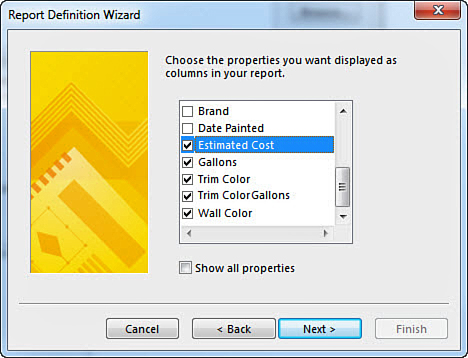
6. Click Next to indicate the properties you want to see as column titles in the report. Select all the values that you want to include (see Figure 14.20).
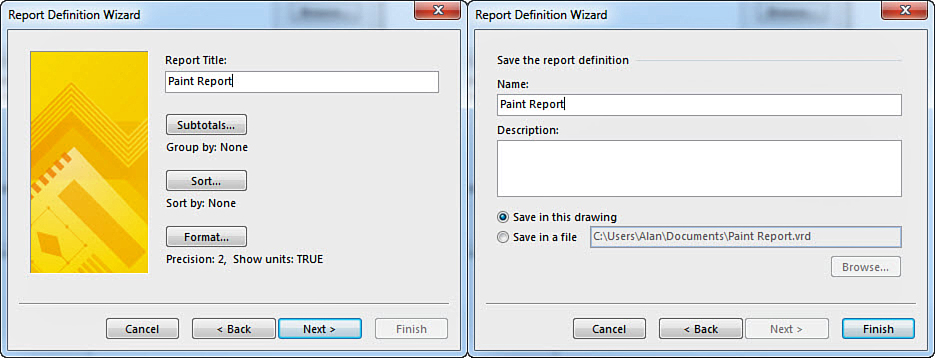
7. Type in a name for the Report Title and click Next. As shown in Figure 14.21, the next window asks you to type in a name for the saved report definition. Use the same name you typed in for the report title, and leave the option button selected for Save in this drawing. Click Finish.
Generating Reports
Now that you have a definition created, run the report to see how it works.
1. Go to a page in the Visio drawing and from the Review tab, select Shape Reports again. This time, select and run the report just created by clicking the Run button. In Figure 14.22 the report is named Paint Report.
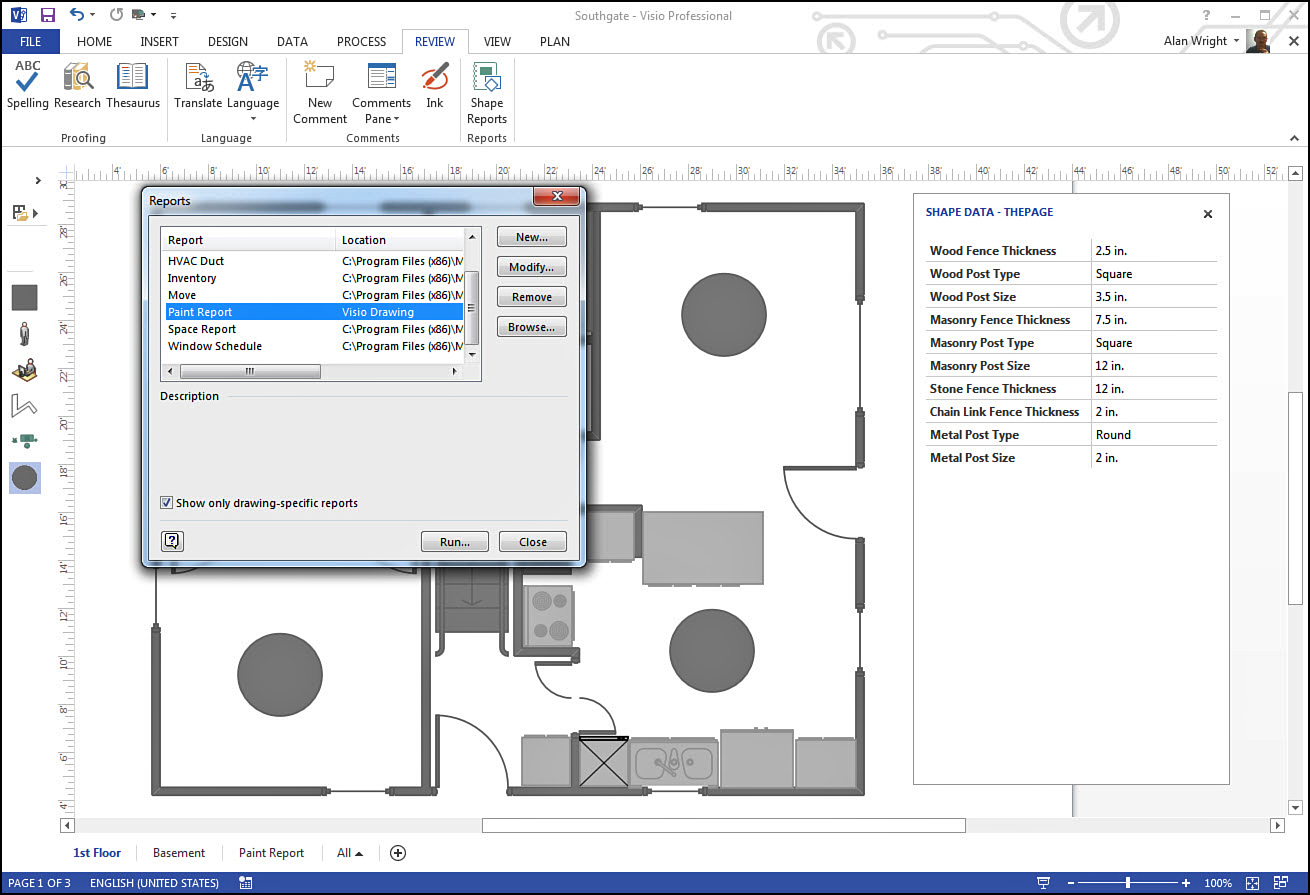
FIGURE 14.22 From the Review tab, use Shape Reports to select from available reports in the Reports dialog box.
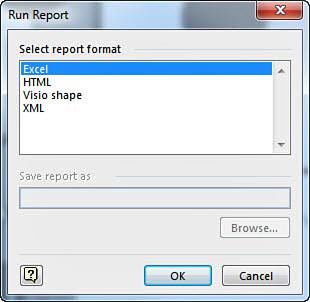
2. In Figure 14.23 you can see that a few output options exist in the Run Report dialog box. In this case, select Excel and then click OK. (Selecting Visio Shape creates an embedded Excel spreadsheet that becomes part of the page.)
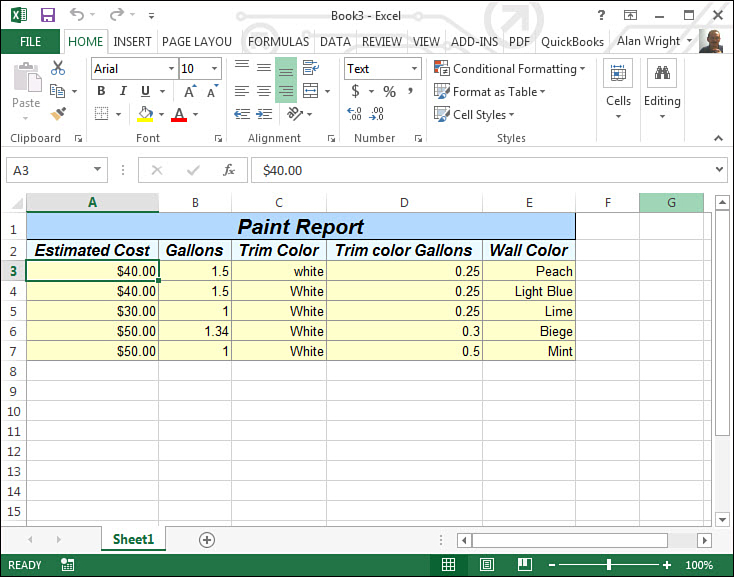
3. Figure 14.24 shows the final result in an Excel spreadsheet.
Tip
There are many ways that data that can be assembled using reports, and this flexibility provides you with many ways to present and use data generated in a report. You might want to include the report right in the same page. This can be useful when printing. Select your output as Visio Shape in step 2 and Link to Report Definition to get an embedded Excel spreadsheet. (An example of an embedded report is shown in Figure 14.25.)
Reports are really snapshots of shape data that you have chosen to view or that are predefined based on shapes that are in your drawing. Changes to data after a report has been run require you to rerun the report to get a new snapshot.
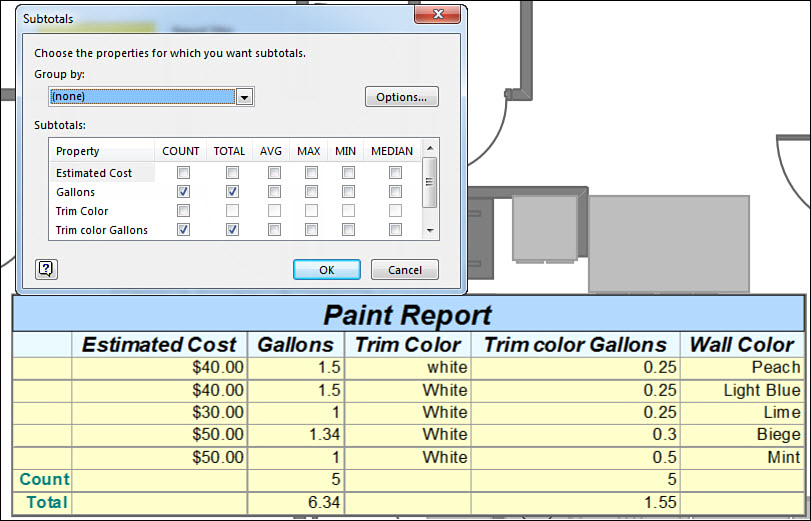
Adding Totals and Subtotals
Reports may be more useful when you add totals and quantities to them. You can do this easily using the Report Definition Wizard. You can modify existing reports or include this in new definitions. In Figure 14.21 you see a Subtotals button in the left pane. This opens the Subtotals dialog box shown in Figure 14.25. By adding Count and Total properties, the embedded Excel spreadsheet also shown in Figure 14.25 has calculated additional information.