
8. Making Advanced Diagrams
In This Chapter
• How do I keep shapes contained?
• How can I best use callouts and ScreenTips?
• Texting etiquette in Visio.
• If onions have layers, can diagrams have layers, too?
As you look at advanced diagrams you will learn about a few tools that will help you add complexity to your drawings without getting lost in the process. In this chapter, you quickly embrace these tools as time-saving and valuable ways to present your ideas through Visio.
Although Visio is mainly a graphical presentation of your information, text is an important part of almost all diagrams. This chapter spends some time looking at text. Just like ogres and onions, Visio drawings have layers. You might recall Donkey explaining to Shrek that not everyone likes onions. You may find Visio Layers to be your new best friend, however.
Organizing Diagrams
We discussed using groups for organizing shapes back in Chapter 6, “Manage Shapes.” This chapter looks at containers, which are a bit more of an advanced concept in Visio and have some unique features that give you further control over how your diagrams appear. Lists and callouts are also newer tools designed to provide additional structure to a diagram.
Containers
Containers were a new feature starting with Visio 2010; they provide you with a powerful way of grouping shapes in a visual container, but you have the flexibility to work with either the shape or the container. Containers can be used to represent a department, a geographical location, or even a concept that “contains” other resources or ideas.
Organize Your Shapes
To see how to add a container to a drawing page, let’s create a new diagram to visually represent the network servers at two satellite offices.
1. Open a new drawing and select the Basic Network template.
2. Open the Insert tab and select a container from the Diagram Parts section of this tab. As you hover over Containers, notice that a preview displays on the page (see Figure 8.1).
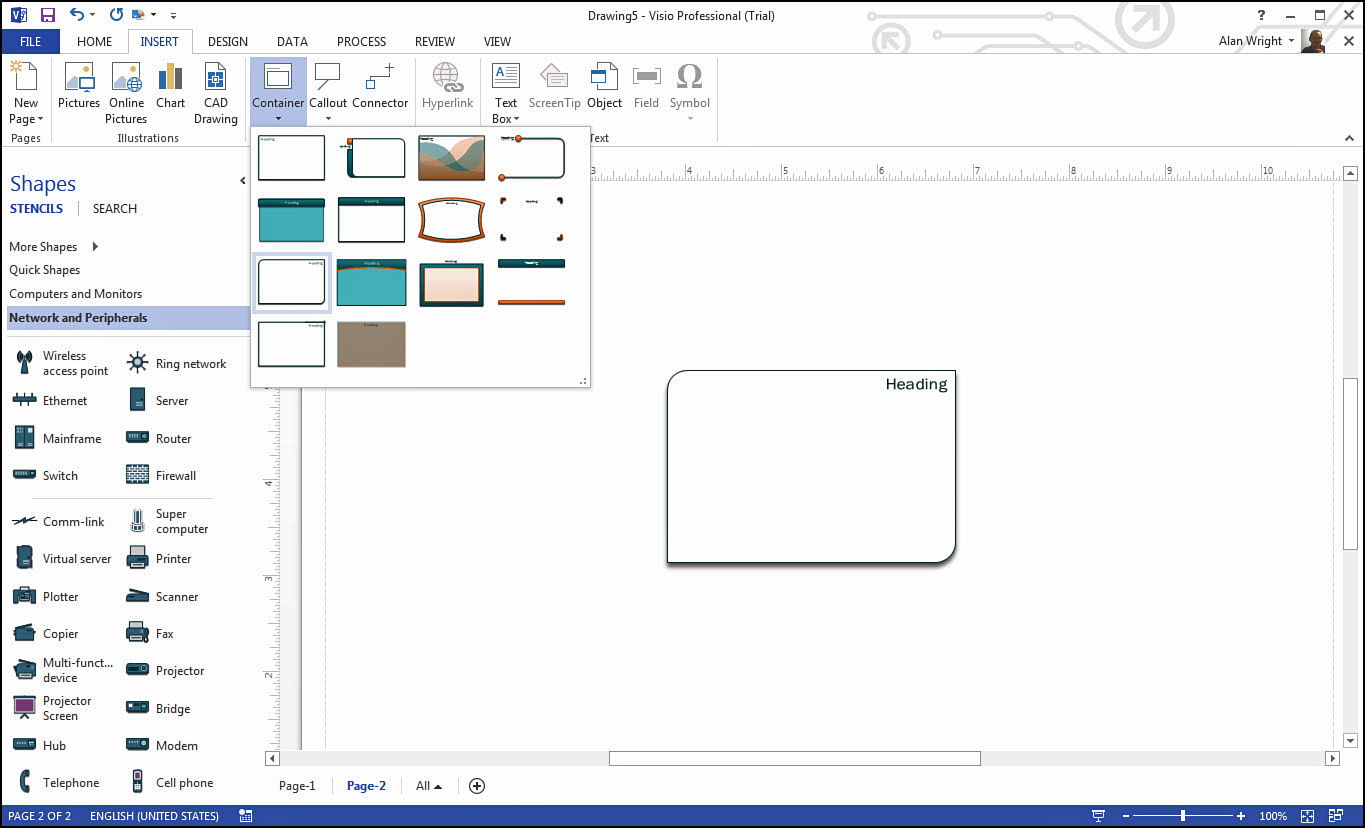
FIGURE 8.1 As you place a container in the drawing window you can choose from several styles as shown here.
3. With the container selected, start typing Atlanta. This is considered the header for the container.
4. Drag over two server shapes and drop them into the container labeled Atlanta.
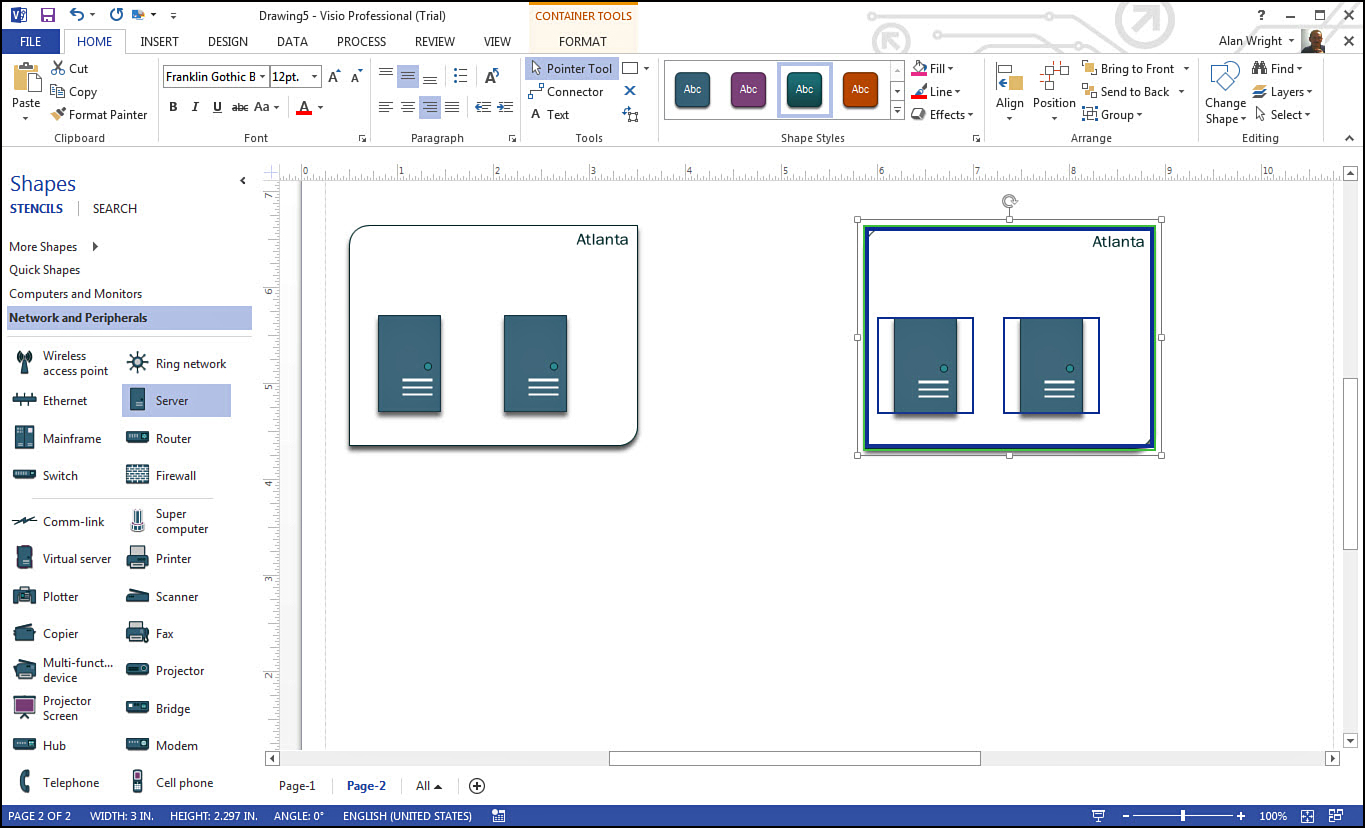
5. Select and move the servers around within the container. Notice that you have no difficulty selecting individual shapes and that the container glows with a green outline to let you know that this is a container.
6. Drag one of the servers out of the container and drop it onto the drawing page. Again, no problems, and this was all it took to remove it from the container.
7. Select the server again that you just removed and drag and drop it back into the container labeled Atlanta. It is now part of the container again.
8. Select the container itself. You must click part of the visible container rather than empty space within the container, which helps you avoid unwanted selecting of the container when working within it.
9. Drag the container around the drawing page. As you can see in Figure 8.2, a ghost image moves around the screen until you drop the container; this becomes its new location. Notice all contents traveled together as a group.
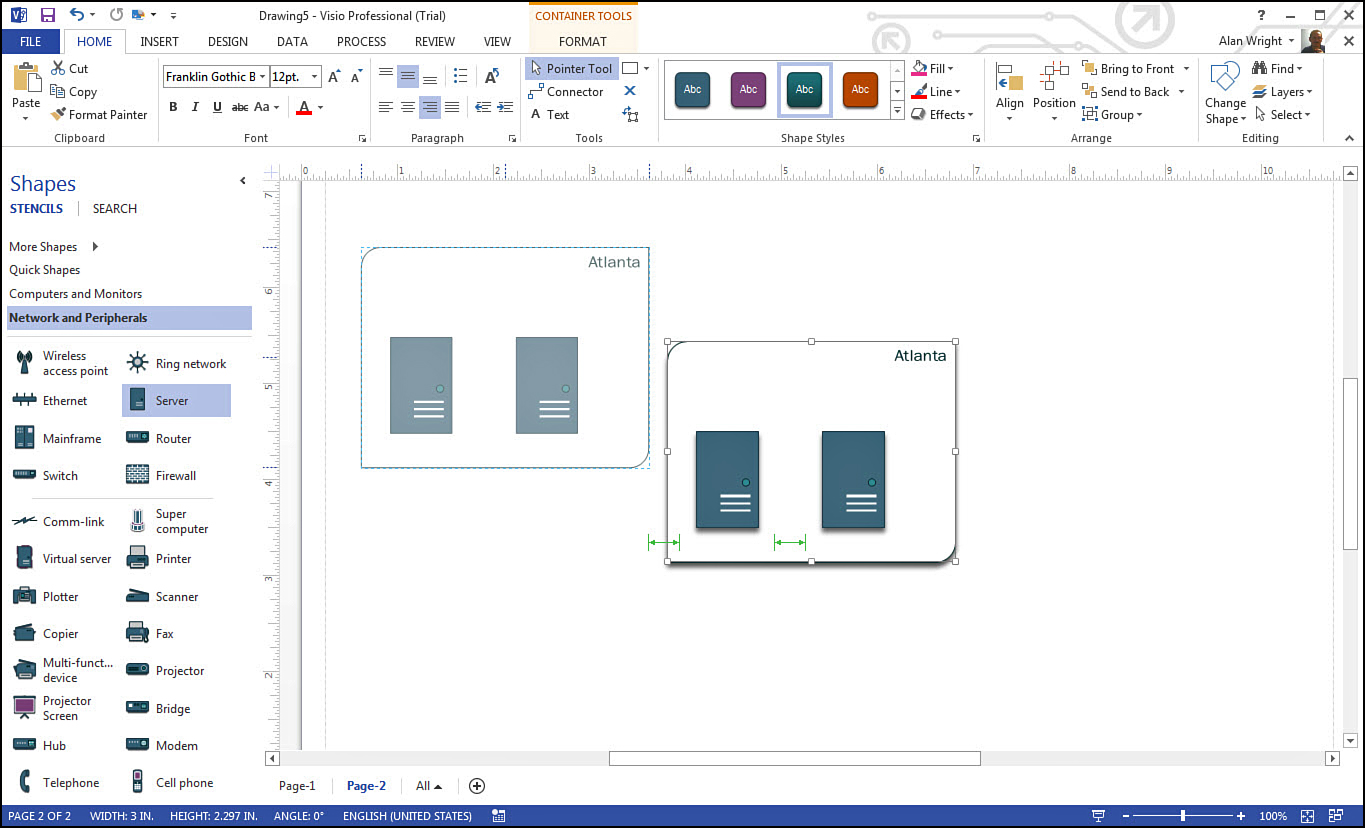
10. Select the Atlanta container again, hold down the Ctrl key this time, and drag the container to another part of the page. When you drop the container this time, notice a clone has been created (see Figure 8.3).
11. Name the new container Detroit.
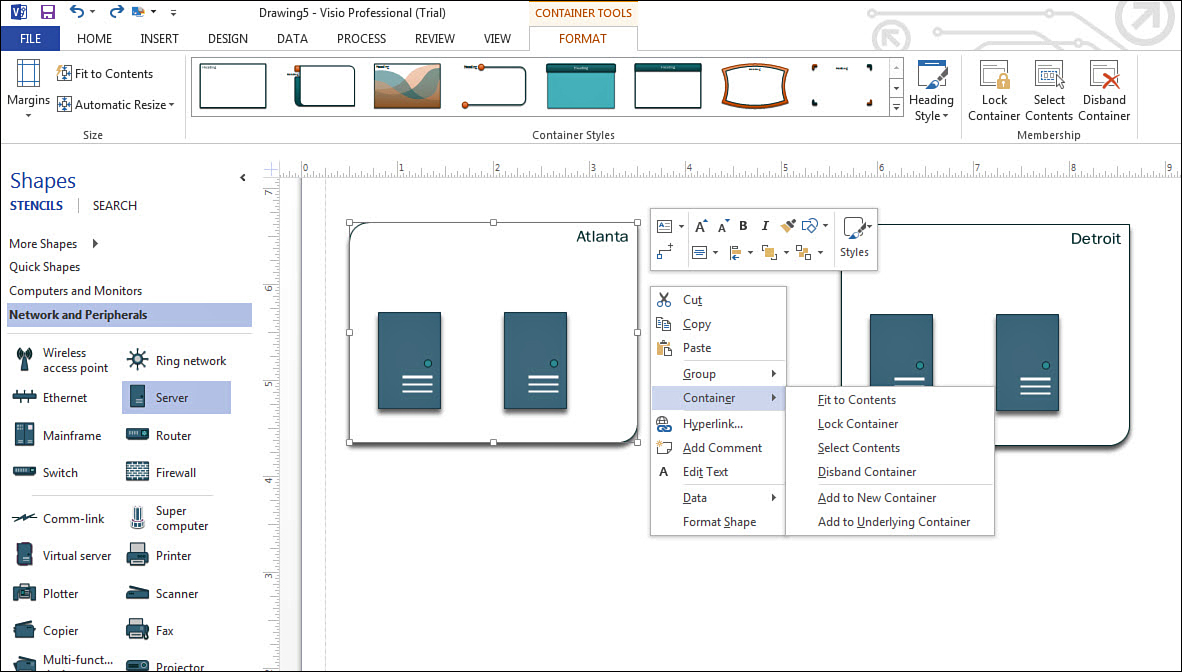
12. Select the contextual tab labeled Container Tools Format and then right-click the container labeled Atlanta. Select Container in the menu, and compare the menu contents to the tools listed in the Container Tools Format tab (see Figure 8.4).
13. Select Atlanta and press the Delete key. Notice the entire container and its contents are gone.
14. Select Detroit and now choose Disband from the tab or from the right-click menu. Notice the contents remain, but the container disappears.
15. Select the two homeless servers and, from the Insert tab, select another container. Notice the new container forms around the selected shapes.
16. Select the new container and on the Container Tools, Format tab select Lock Container. Select a server from the container and drag to a location outside of the container and drop it. Notice the locked container expands to keep the shape within the container.
As you can see, containers provide a dynamic tool for managing your shapes. Containers can even be placed within other containers using the same characteristics to manage the structure that you just examined.
Modifying Containers
So far you have created, cloned, moved, and deleted containers. Now consider some further steps you can take to control and manage your containers.
In the Container Tools, Format tab there are still a few buttons to try out. The first section of this tab is labeled Size. The Margin button presents a drop-down menu that adjusts the container to fit to the contents, leaving the selected margin of distance between the contents and the container. It may also alter the header of the container, as in the case of the container style named Notch. (Each container style has a name that is revealed when you hover over these container styles with your mouse pointer.)
Figure 8.5 also shows the Fit to Contents, which makes the container as compact as the contents allow. This can be used in conjunction with the Margins button to tweak the desired space around the shapes within the container.
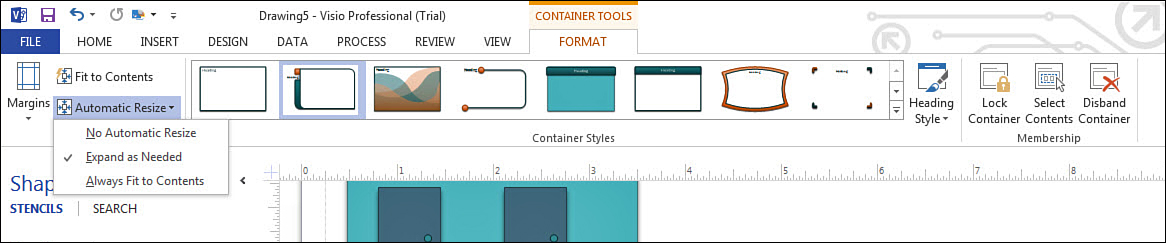
The Automatic Resize button opens the drop-down menu shown in Figure 8.5. You can set this at the container level, and the container can be locked into a size by selecting No Automatic Resize. Expand as Needed allows the container to grow as new shapes are added. Always Fit to Contents allows the container to expand and contract as you add or remove shapes.
On the Container Tools, Format tab you also have Heading Style, which presents some variations on the header position and orientation unique to that container.
Another way to modify containers is with Embellishment. This was briefly touched on earlier in the book when discussing themes in Chapter 4, “Taking Control of Your Diagrams” (see page 76).
To modify the appearance of a container using the Embellishment tool, go back to the Atlanta and Detroit containers used previously. In Figure 8.6 notice that each container has a different container style assigned, and the Design tab is open. The Variants section has been expanded using More, and Embellishment is set to the default Automatic setting. You can preview the effects of overriding the Automatic setting by hovering your mouse pointer over another setting such as Low. You can see in Figure 8.7 how the container’s visible presence has been altered in this preview to appear more subdued. If you like the appearance just select it to lock in this setting. Some containers do not respond visibly to the embellishment settings; others change radically.
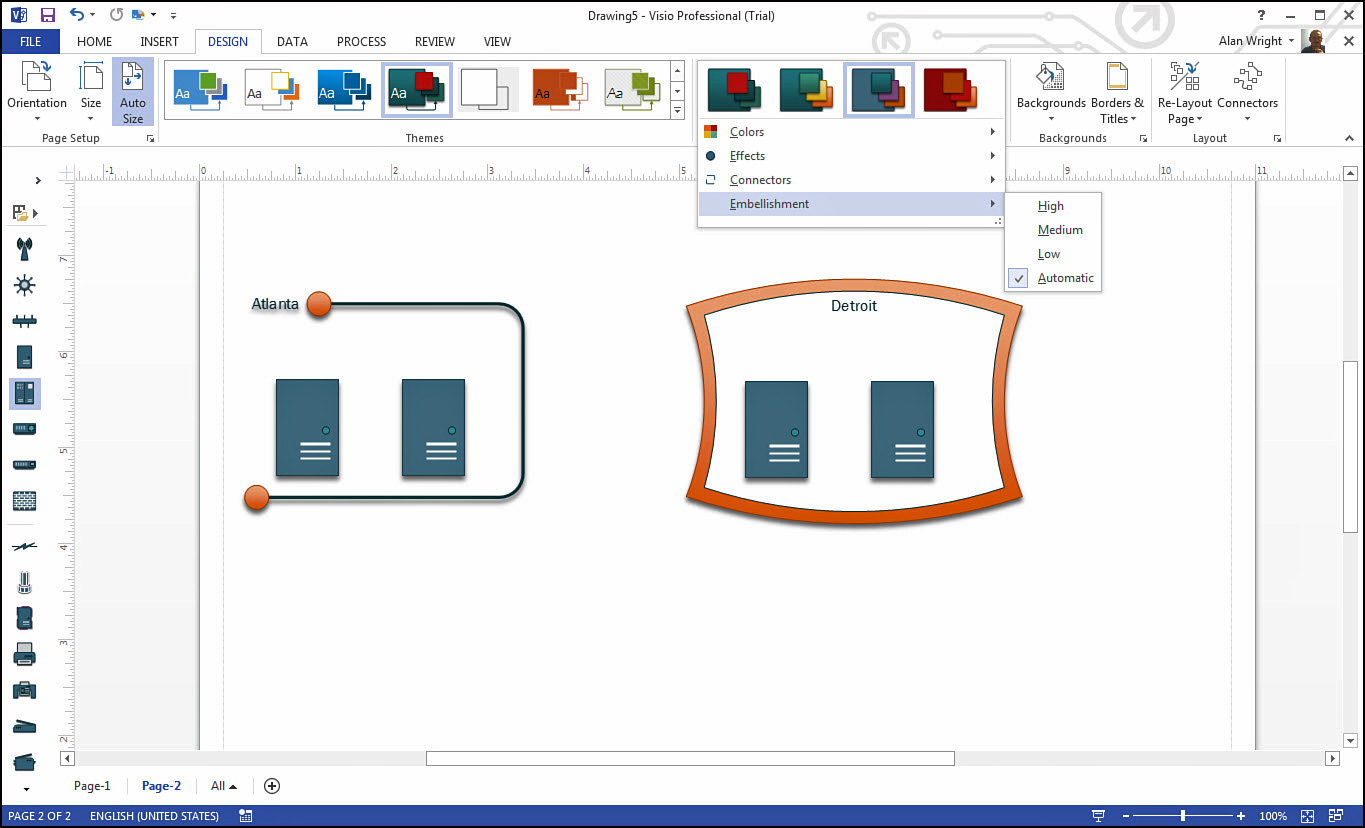
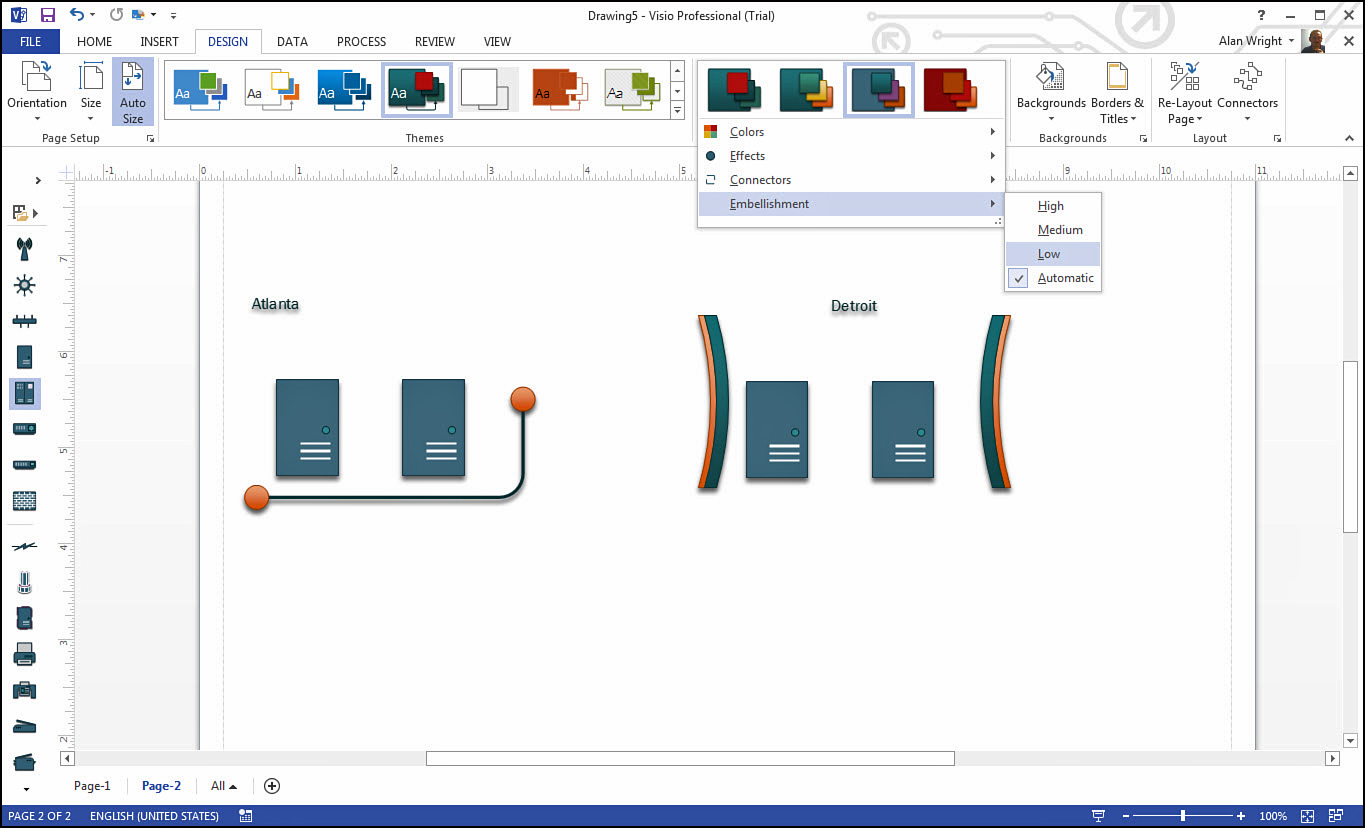
FIGURE 8.7 Changing the Embellishment setting alters the appearance of containers as shown here where Low is previewed on the containers from Figure 8.6.
Embellishment is a new feature for Visio 2013 and affects any shapes or containers that have been designed to use this setting. The Embellishment setting you choose is applied to the entire drawing page and cannot be applied to individual containers.
Lists
Lists are another type of container in Visio, which explains some similarities to the container characteristics you’ve already seen. They are used in certain situations where it is crucial to maintain the correct order and to arrange any added items in sequence. Because of their special nature, they cannot be chosen and dropped into a basic template like containers can.
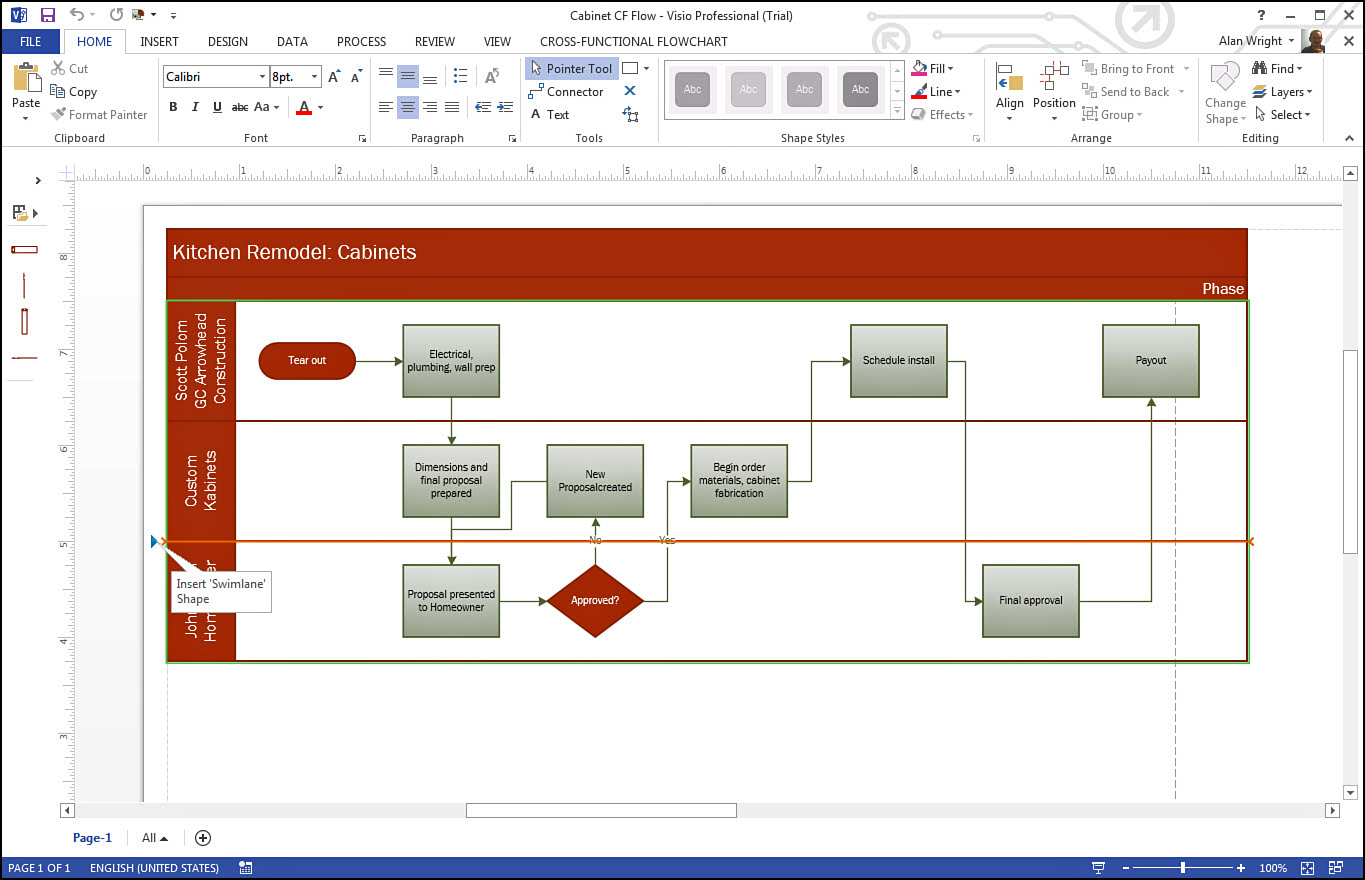
Cross-function flowcharts are an example of this type of container. These flowcharts are often used to show the progression or sequencing of tasks, and they also identify the ownership of the tasks. Notice in Figure 8.8 how shapes are arranged neatly in the horizontal containers called Swimlanes. By hovering over the top or bottom of the left edge of a Swimlane, notice that a blue arrow tool appears and offers to Insert “Swimlane” Shape. An orange line indicates the location where the insert would occur. Also, the group of Swimlanes is surrounded by a glowing green line.
When a Swimlane is grabbed and moved, it is a simple one-step process. Just grab the header of the Swimlane and drag and drop. Notice in Figure 8.9 how the flowchart can still be understood; all the steps maintain their order despite the arrangement being busier looking.
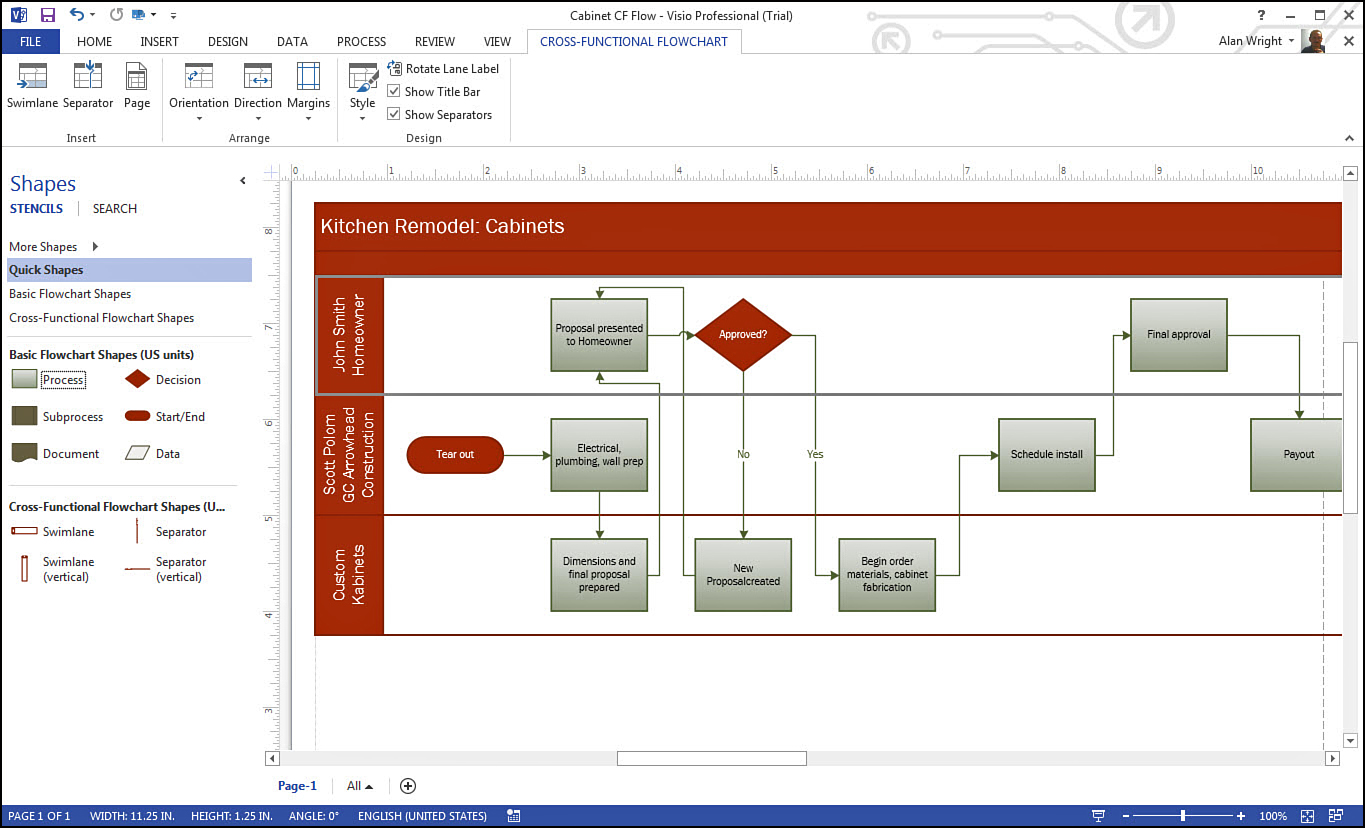
FIGURE 8.9 Lists allow you to rearrange shapes and connectors without losing the established order or sequence.
You may never use the Lists feature, but if you do work with this type of flowchart, legend shapes for data graphics, or other unique templates that focus on sequential presentation, you will certainly benefit from their inclusion in Visio.
Callouts
Callouts are a great way to add textual information to your diagrams without distracting from the flow of the diagram. You might think of a comic book the first time you use them because they basically look like the way dialogue has been thrown back and forth in comic strips since before Charlie Brown missed the first football Lucy held for him. Their principal use is to draw attention to some detail in a diagram.
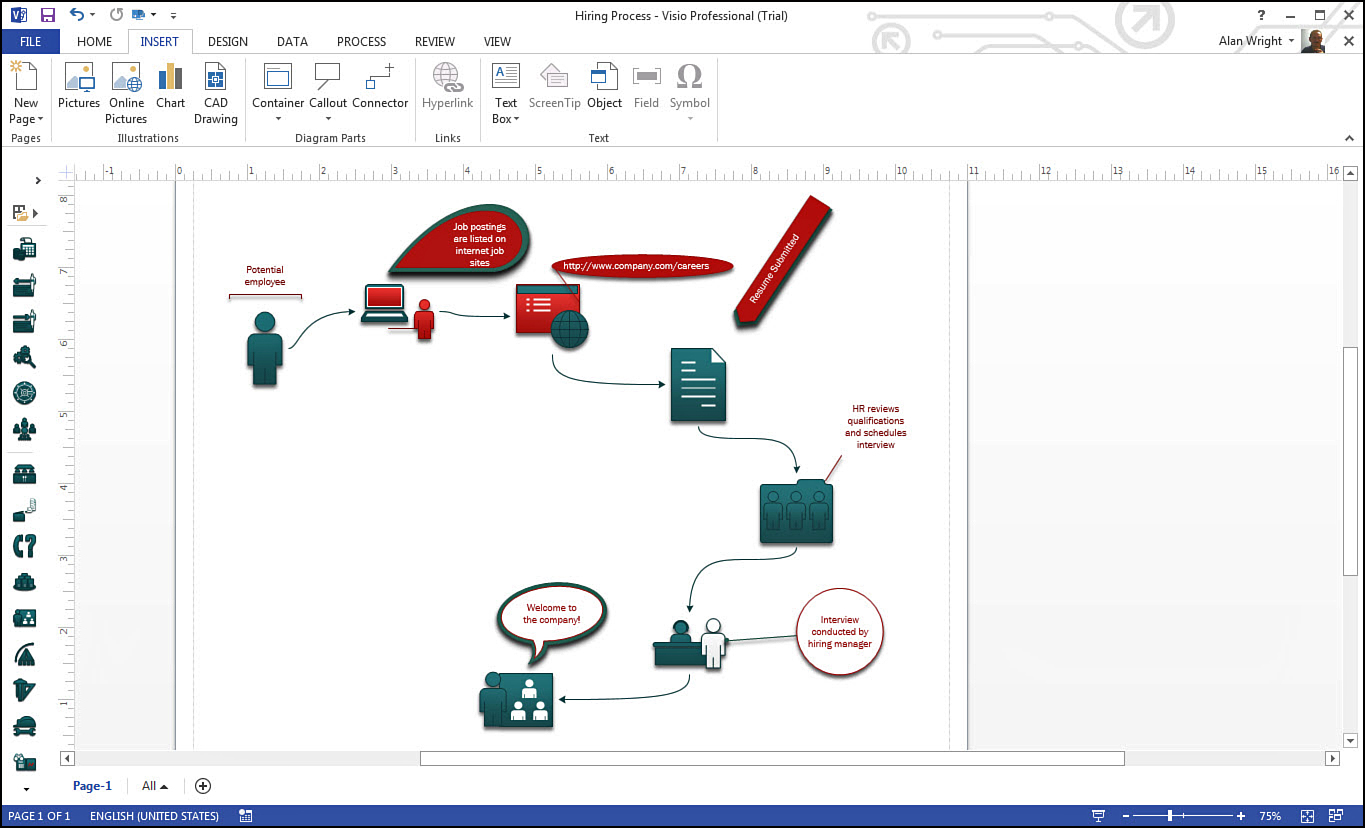
They have new properties since Visio 2010, and they certainly help in organizing and structuring your diagram. Used properly, they serve as yet another tool to take your diagrams to the next level of professionalism. Figure 8.10 shows many new types of callouts solely to illustrate their variety and appearance.
Technically, callouts have an associative relationship to a shape because the text balloon is associated with the target shape in a special relationship that is different from two connected shapes.
1. Open the Insert tab.
2. In the section labeled Diagram Parts, select Callout and choose the one named Orb. Callout names are revealed with a hover.
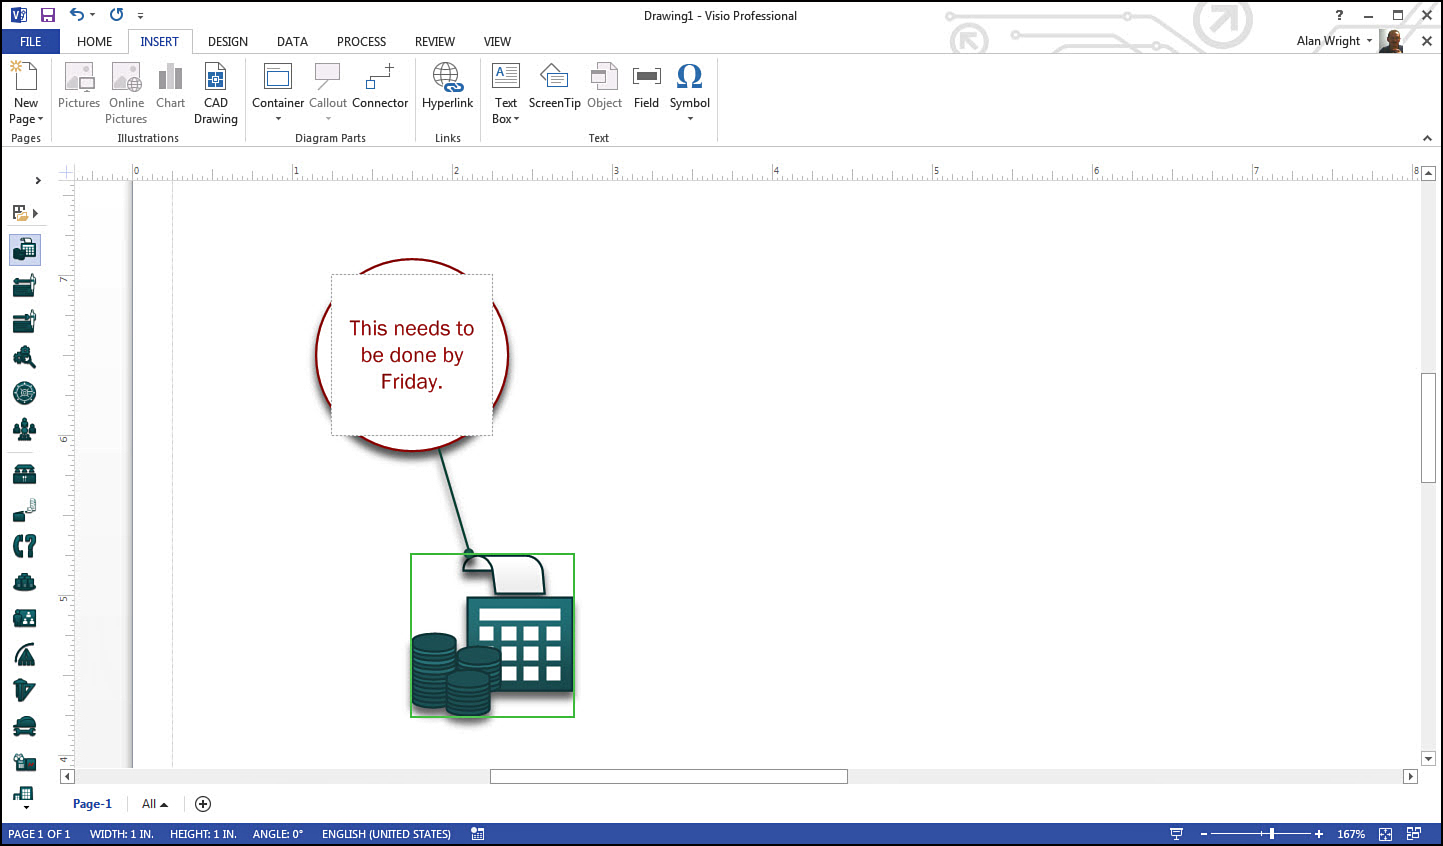
3. Your shape is no longer selected, but notice the bright green line outlining the shape. In the selected callout, type some text (see Figure 8.11).
4. Press the Esc key on your keyboard, and now drag the callout shape to a different location. Notice that when dropped, the connecting line is redrawn to show which shape the callout is associated with.
5. Select the shape. Drag the shape to a new location. Notice that the callout travels with the shape and is an extension of the shape.
6. Select the shape and press Ctrl+D to create a duplicate of the shape. Notice that both the shape and the associated callout have been duplicated.
7. Select the callout on the new duplicate. In the center of the shape you see a small yellow control handle or association point. Select the point, and drag it to a blank area of the drawing. Notice that it is no longer connected (see Figure 8.12).
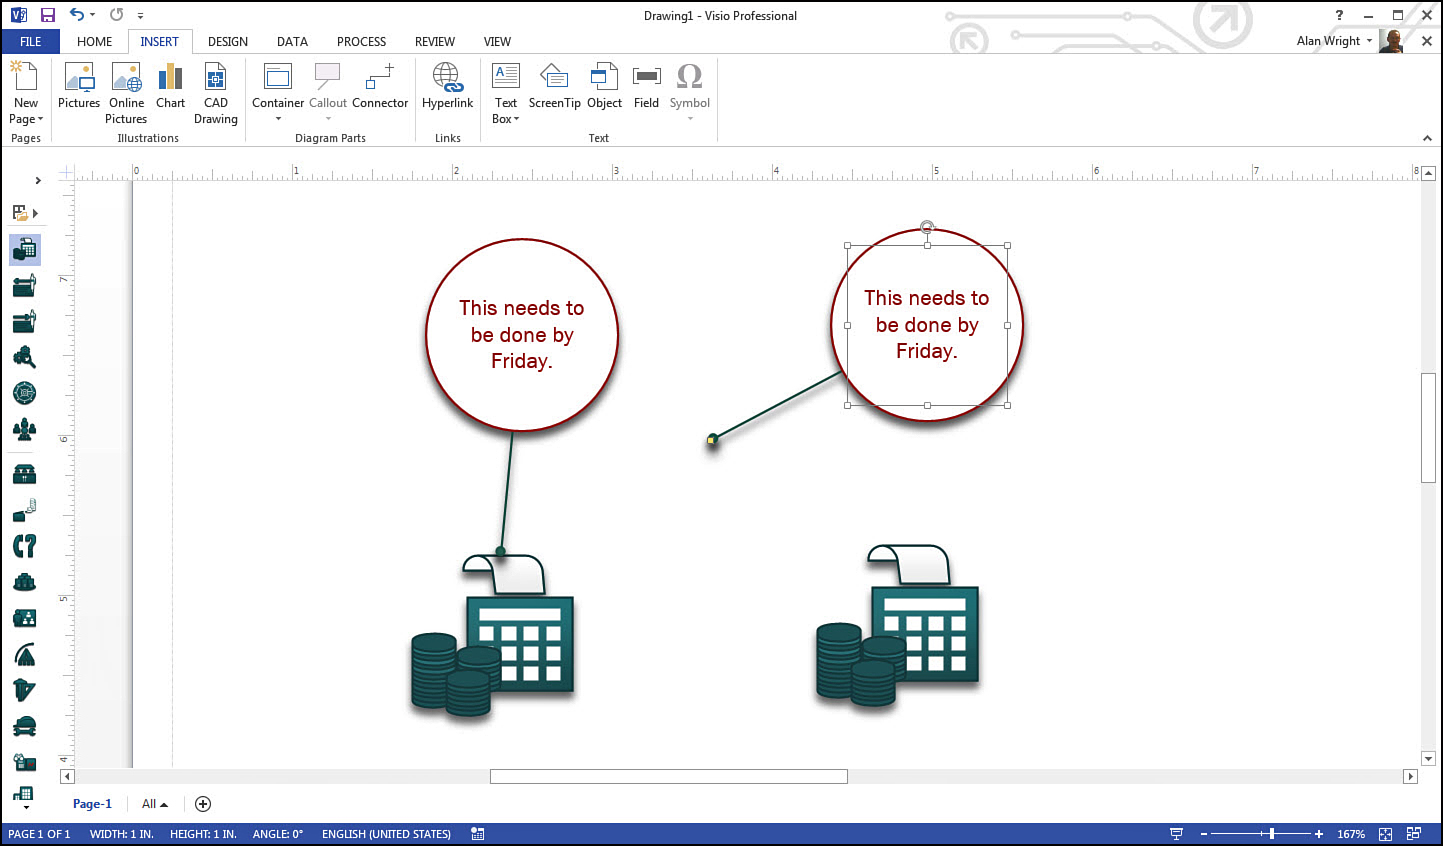
8. Select the duplicate callout and then the yellow association point, and drag and drop into the first shape. Notice now that both callouts are connected, and moving the shape moves both callouts, as shown in Figure 8.13.
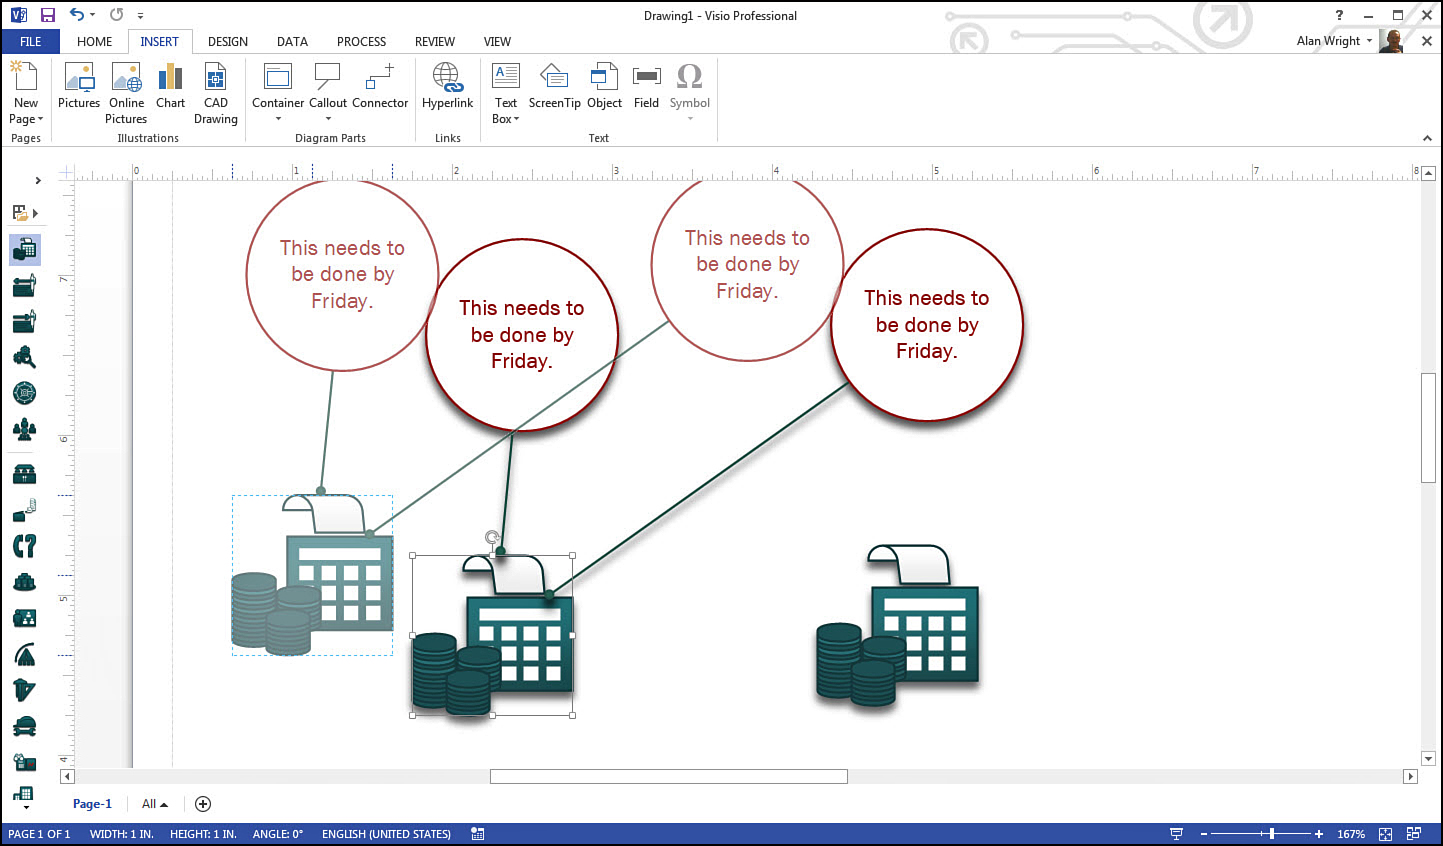
FIGURE 8.13 Target shapes can have multiple callouts attached. Here Visio shows how attached callouts move with a shape as it is repositioned in this image.
 Caution
Callouts stay on top of shapes or connectors they overlap. This means you need to position the callout to allow for this characteristic. Also, in the case of overlapping callouts, the newest formed callout is on top.
Callouts can be overused as a visual effect, so be careful how you use them. In Figure 8.10 you can see how inconsistent use makes the drawing look busy. Judicious use of callouts draws the eye to critical points of interest in diagrams and work flows, or highlight special features in advertising and maps.
ScreenTips
ScreenTips have been used in applications like Visio by developers for many years, and you have benefited from their presence many times. Usually they appear when you hover over an item on the screen; they provide additional information that evaporates when you move the cursor away. In Visio you can create your own ScreenTips.
They are an elegant way to have information available in a diagram without the clutter. Because they are hidden, your user has to be in the know or accidentally hover over the shape to trigger their appearance. Despite this potential limitation, you may find their inclusion in your diagrams to be a great training aid or a handy way of reminding yourself of important additional information or explanations.
Creating Useful ScreenTips
Follow these steps to create your own ScreenTip.
1. Open a new drawing using the Basic Diagram template.
2. Drag a couple shapes to the diagram.
3. Select a shape, and in the Insert tab select ScreenTip from the Text section (see Figure 8.14).
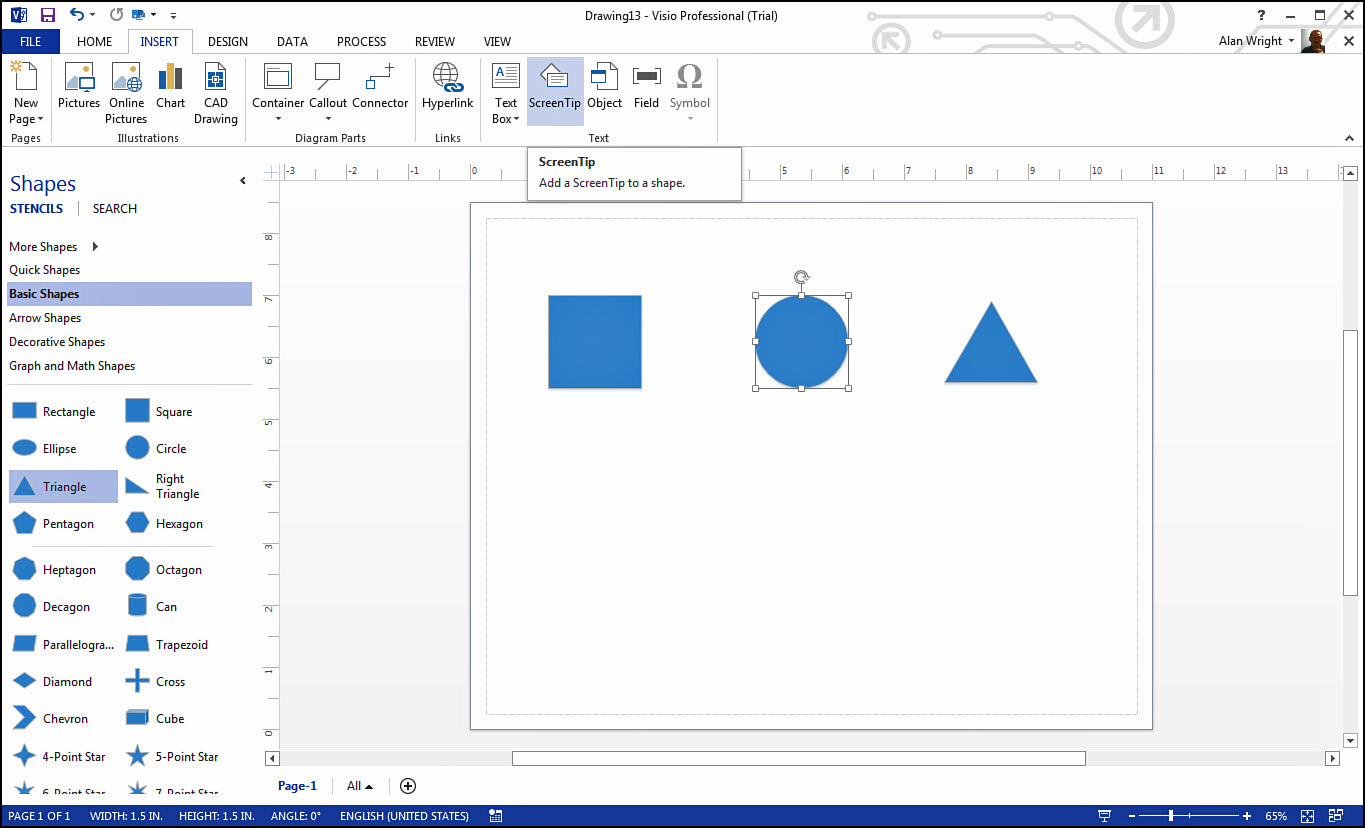
4. In the small Shape ScreenTip window, type in the text you want to use and click OK.
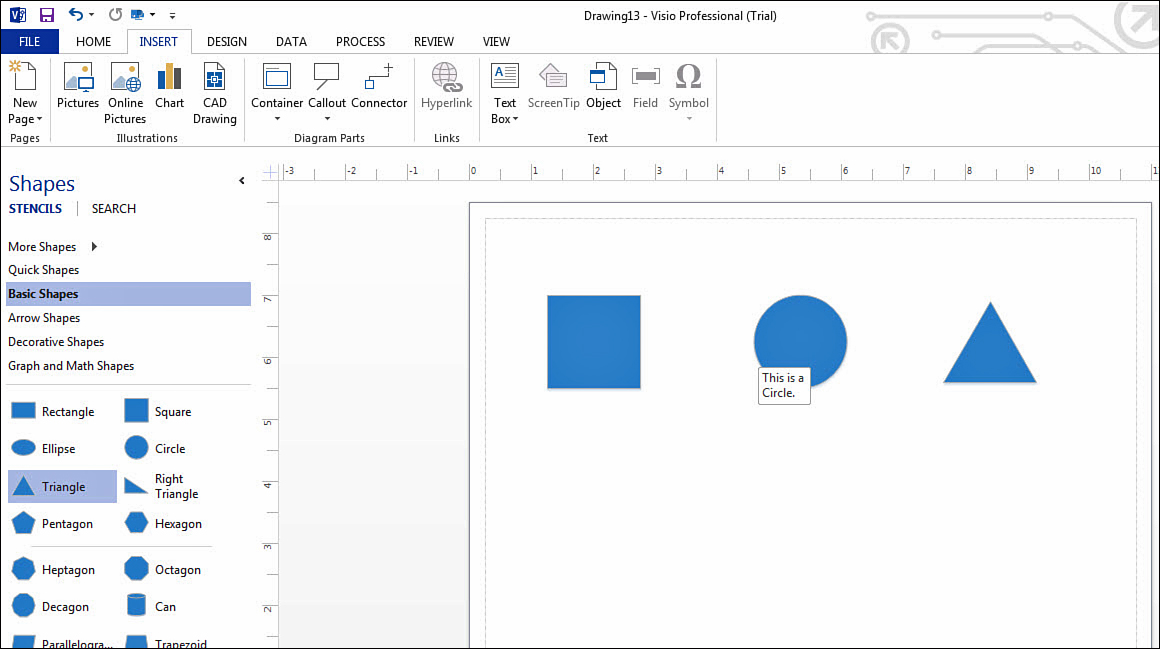
5. Click a blank part of the drawing window, and hover over your shape. Notice the ScreenTip appears, as shown in Figure 8.15.
 Tip
Tip
ScreenTips are useful additions to a Visio diagram, but they are visible only if a person knows to look for them. They are not shown in printed diagrams. You might consider adding a visual cue to your diagram to alert others (and remind yourself) of their presence.
Using Headers and Footers
In Chapter 4 we touched on the use of borders and titles on the background pages. It is good to spend a little more time on the usage of borders and titles in drawings.
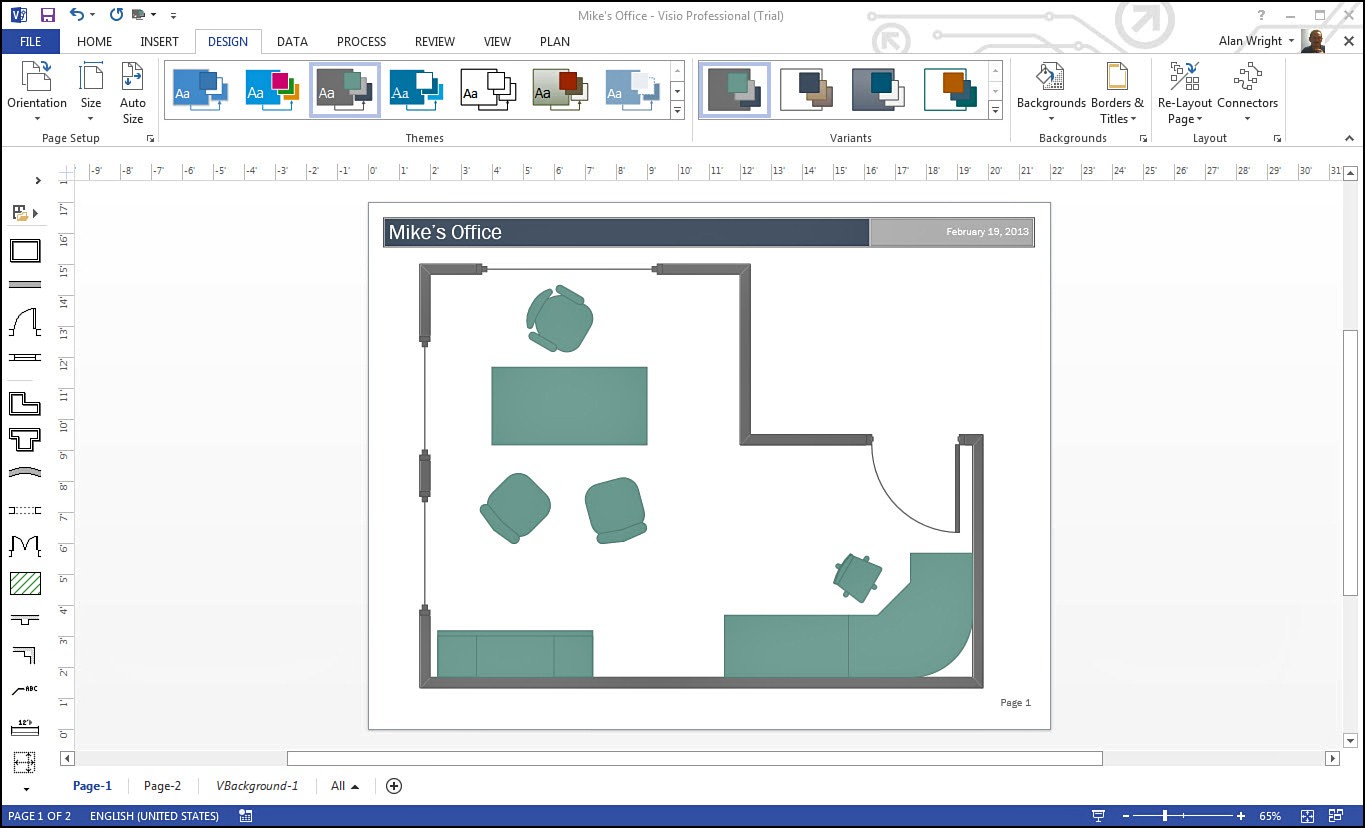
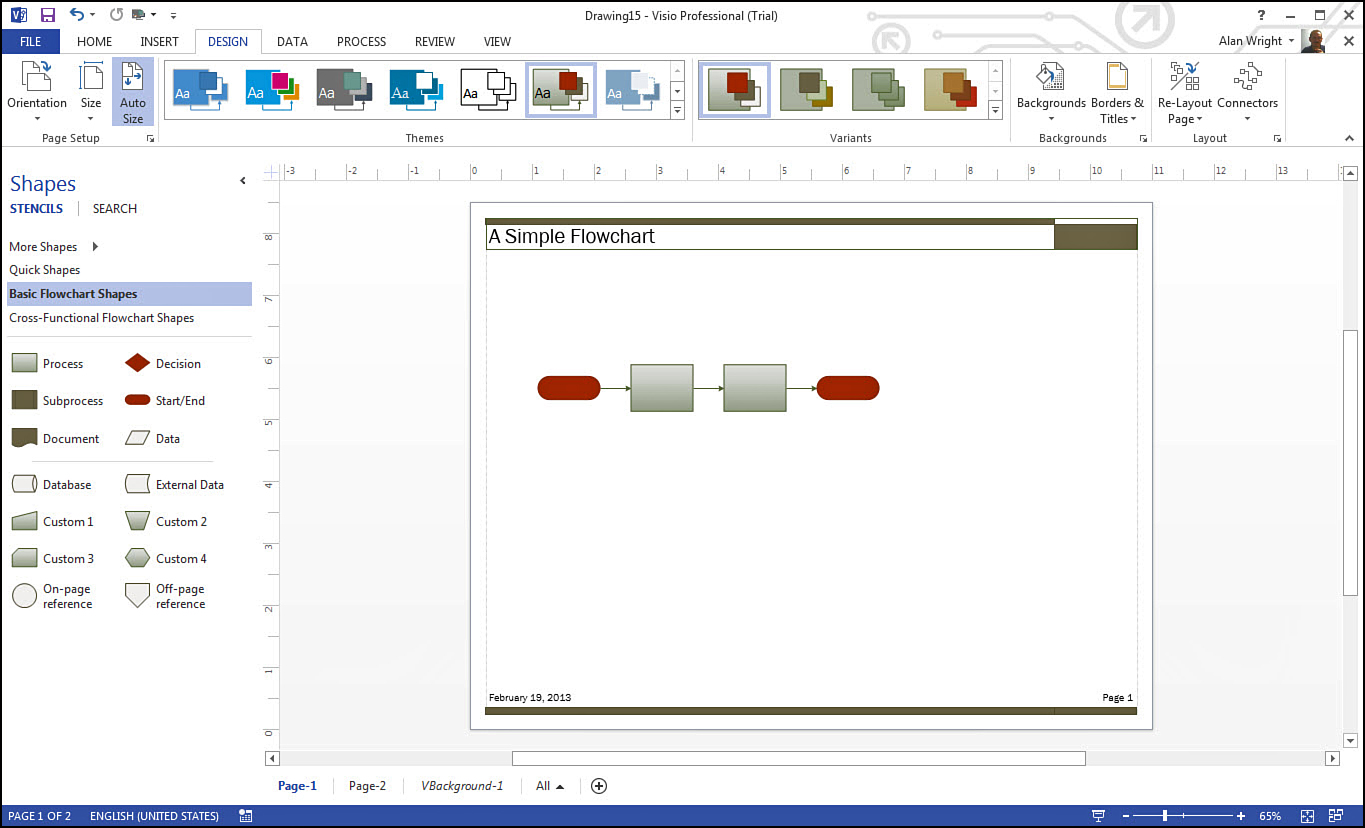
Visio uses the background page to insert visible headers and footers into the drawings. In Figure 8.16 you can see this drawing is easily identified by the header and footer fields which provide a title, date, and page number.
To add these features to a drawing, a few steps are required.
1. Create a new drawing using the Basic Flowchart template.
2. Drag a Start/End shape over to Page-1.
3. Add a couple Process shapes and a final Start/End shape.
4. Press Shift+F11 to insert a new page.
5. On Page-2 that was just created, open the Design tab and expand the Borders & Titles button. Select Blocks from the choices, as shown in Figure 8.17.
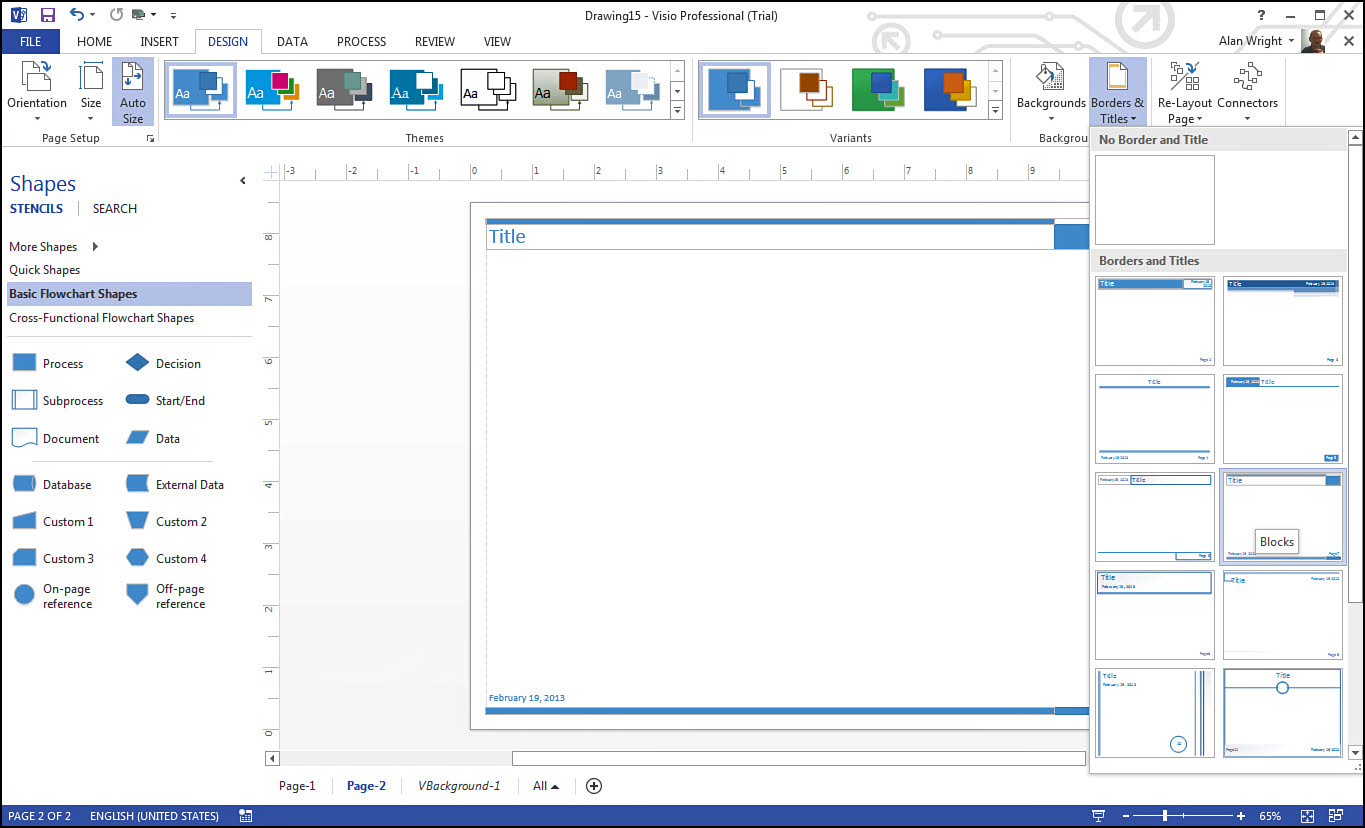
6. Notice that on Page-2 you are unable to double-click and modify the Title. Select the VBackground-1 page using its Page tab.
7. Double-click the word Title on the VBackground-1 page, and enter a name for the drawing.
8. Return to Page-2 and notice the title has been updated. Also notice that the footer has the date to the left and Page 2 off to the right.
9. Right-click the tab for Page-1 and select Page Setup to open the Page Setup dialog box.
10. On the Page Properties tab, change the Background to VBackground-1 and click OK, as shown in Figure 8.18.
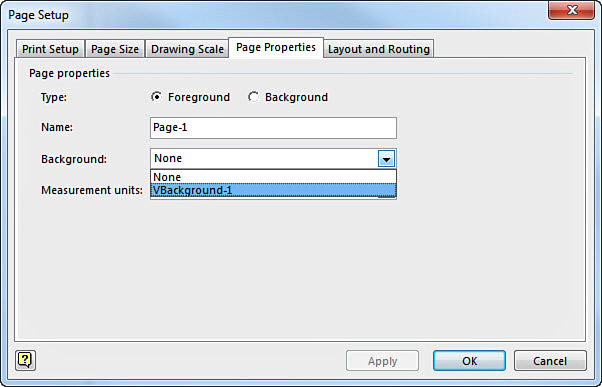
11. Notice something similar to Figure 8.19. When using this in a presentation, the title is easily seen, and displayed page numbers provide easy reference for discussion.
The creation of visual headers and footers using the background page in Visio is a bit rigid. Individual pages all have the same title as the assigned background page. However, you can create multiple background pages and assign the appropriate background page to a particular page in the drawing. To carry this concept even further, you can assign background pages to other background pages to further refine how common elements are brought to groups of pages.
→ To learn more about the use of background pages, see page 64.
Another type of header and footer is available from the Print menu and is considered later in this book.
→ To learn more about printing header and footer fields, see page 211.
Working with Text
You have already seen a few ways to use text with callouts and ScreenTips earlier in this chapter, and you have seen quite a few examples of adding text to shapes and connectors. Now look at a few more ways that you can incorporate text into your diagrams.
Creating Text Boxes
Visio includes horizontal and vertical Text Box tools right on the Insert tab in the Text section. You can quickly select one or the other and draw a box outline that is formatted for that orientation of text.
You can easily edit the text inside by double-clicking the text or right-clicking and choosing Edit Text, where even more tools for formatting are available. The text box itself is treated as a shape and can be resized, rotated, and connected to other shapes. Generally the box is invisible, leaving only the text visible and allowing you to strategically place text on the drawing page without any visible shape. An example of this can be seen in Figure 8.20 where the words “Text Fields” appear. You can also apply styles to the text box by right-clicking and selecting the desired style that applies color and outline to the surrounding box.
Using Text Fields
Text fields are a way to insert text into a diagram, such as date, author, page information, measurements, and other data types.
Follow these steps to learn how text fields can be inserted and used.
1. Open a new drawing using the Basic Diagram template.
2. Drag three shapes over and drop them onto the drawing window.
3. Select the first shape and go to the Insert tab, Text, and select Field.
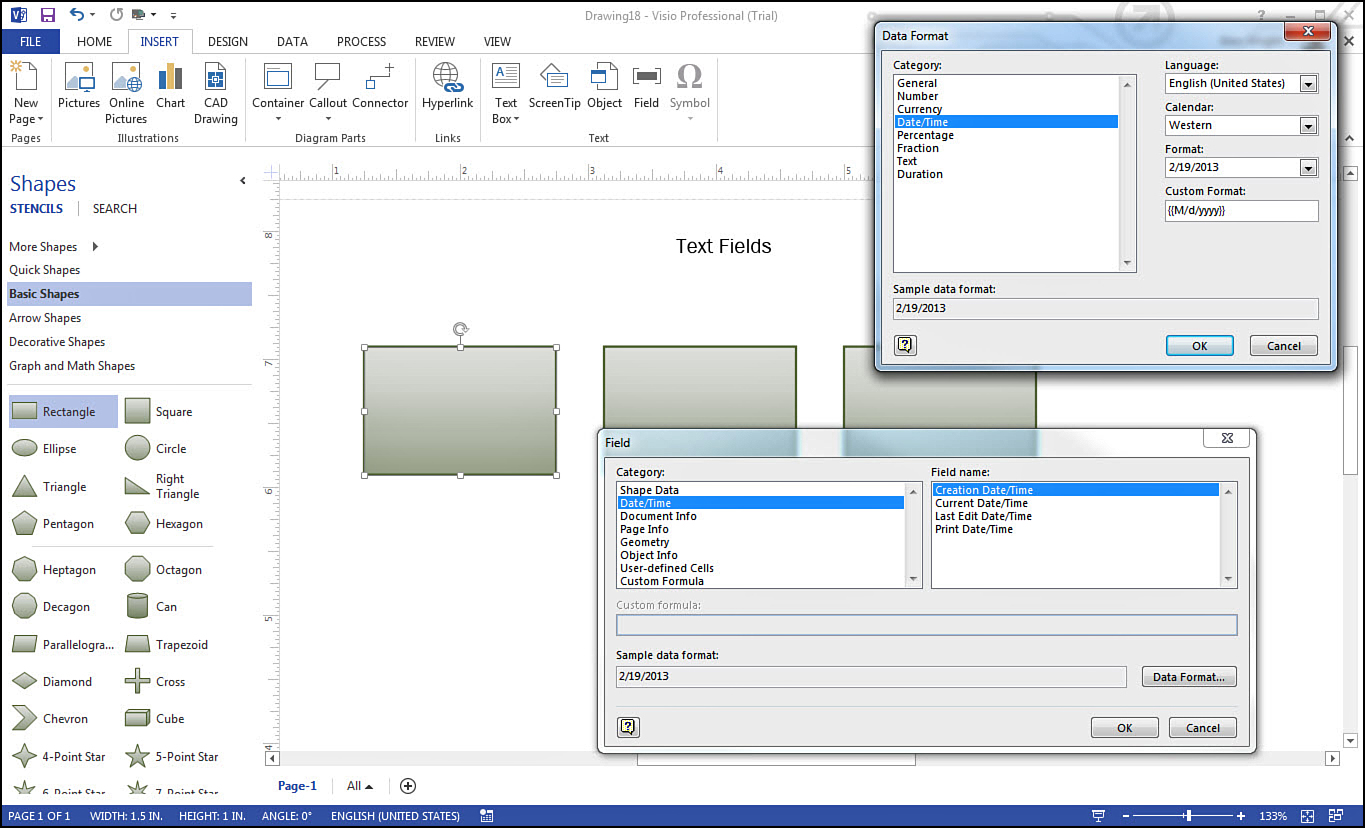
4. Choose Date/Time from Category and Creation Date/Time from the Field name list. Click Data Format to see a variety of format choices in the Data Format window (see Figure 8.20).
5. For the second shape, choose Page Info and Name.
6. For the third shape, choose Document Info and Filename.
7. Press Ctrl+S to open the Save As File menu and type Text Fields for the name. Click Save.
8. Notice that the third shape updates the name of the drawing to show the name Text Fields.vsdx (see Figure 8.21).
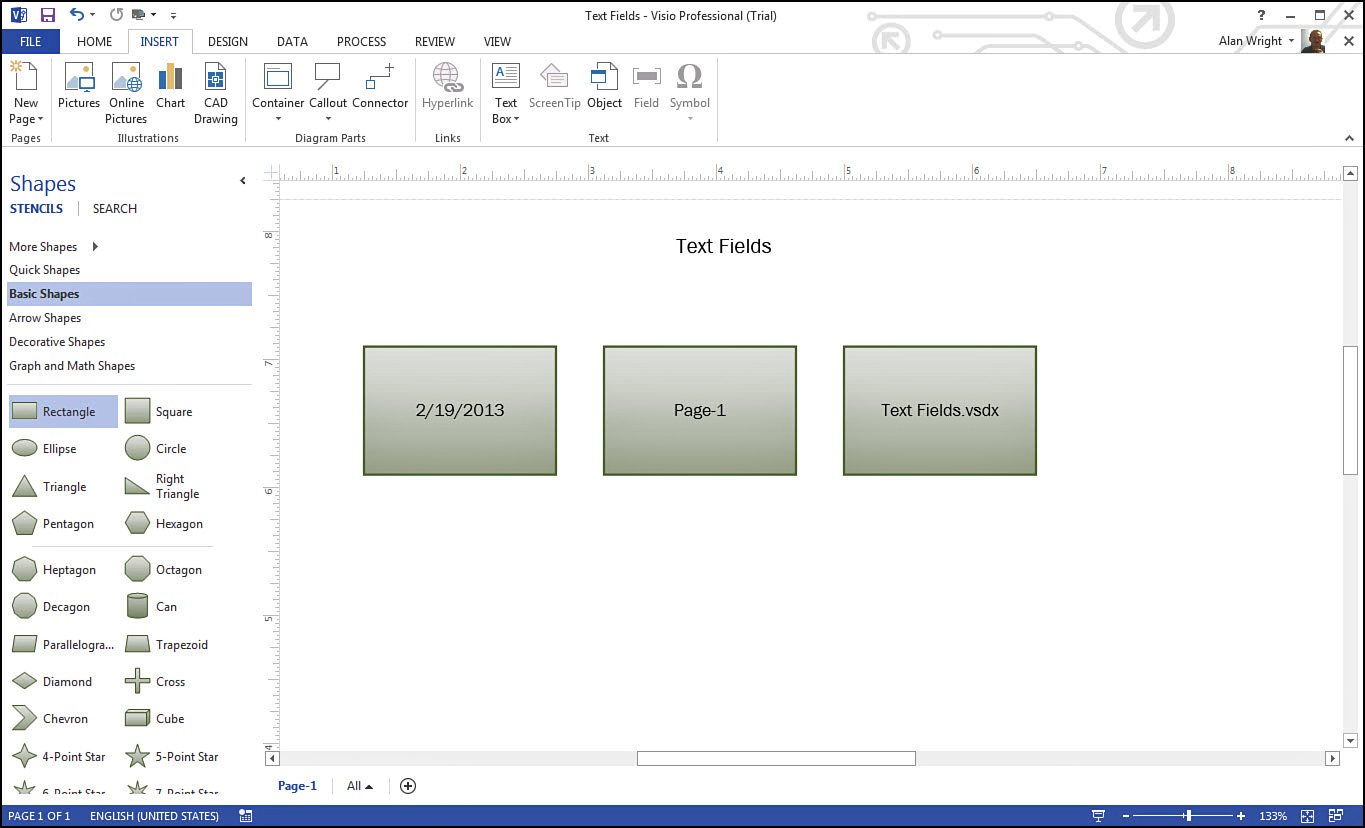
FIGURE 8.21 Field Text can pull text from key properties of your drawing file such as the file name, date, or page number.
Tip
Text fields can even be inserted within regular text. For example, you can have a shape or a text box with normal text, such as “This was created on.” You can insert a text field in this sentence after the word “on” and point to the current date in your category. This sentence automatically shows the current date each time the drawing is opened. This is one example that shows the power of text fields.
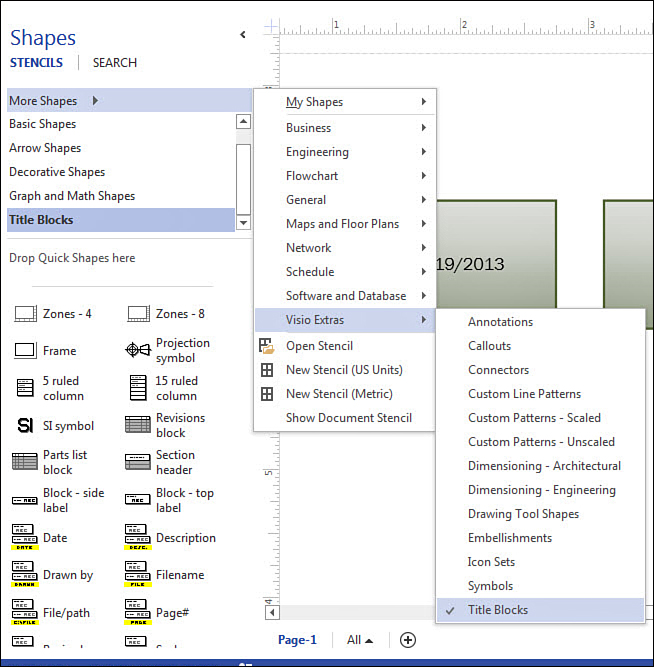
Text fields can be assigned on-the-fly to shapes in the diagram and even to text boxes. Another type of shape in Visio can be found in the Title Blocks stencil, as shown in Figure 8.22. These are essentially standardized text boxes that have predefined text fields where expected. They are often used when working with floor plans, for example. To find this set of shapes, open the Shapes Panel, More Shapes, Visio Extras, and Title Blocks.
Layers
Layers provide another way to manage and organize your diagrams. Most often this feature is used by farsighted creators of complex diagrams as a means to quickly see or select diagram components. Whereas you find that many layers are created automatically, layers can also be created based on any criteria you decide to use: shape, resource, date, color, and so on. They can exist in your diagram without being noticed and can be selectively printed or displayed at your whim.
Tip
Don’t confuse layers in Visio with the way layers might be used in other applications. This is not a feature used for stacking and overlapping images, like transparencies on an overhead projector. They are designed to help you surgically organize and control groups of components without affecting the rest of your diagram.
Creating Layers
Compare Figure 8.23 and Figure 8.24. Two shapes are different, the same page is selected, and the only change is that the Visible setting has been toggled for the layers named Normal Hours and Weekend/afterhours.
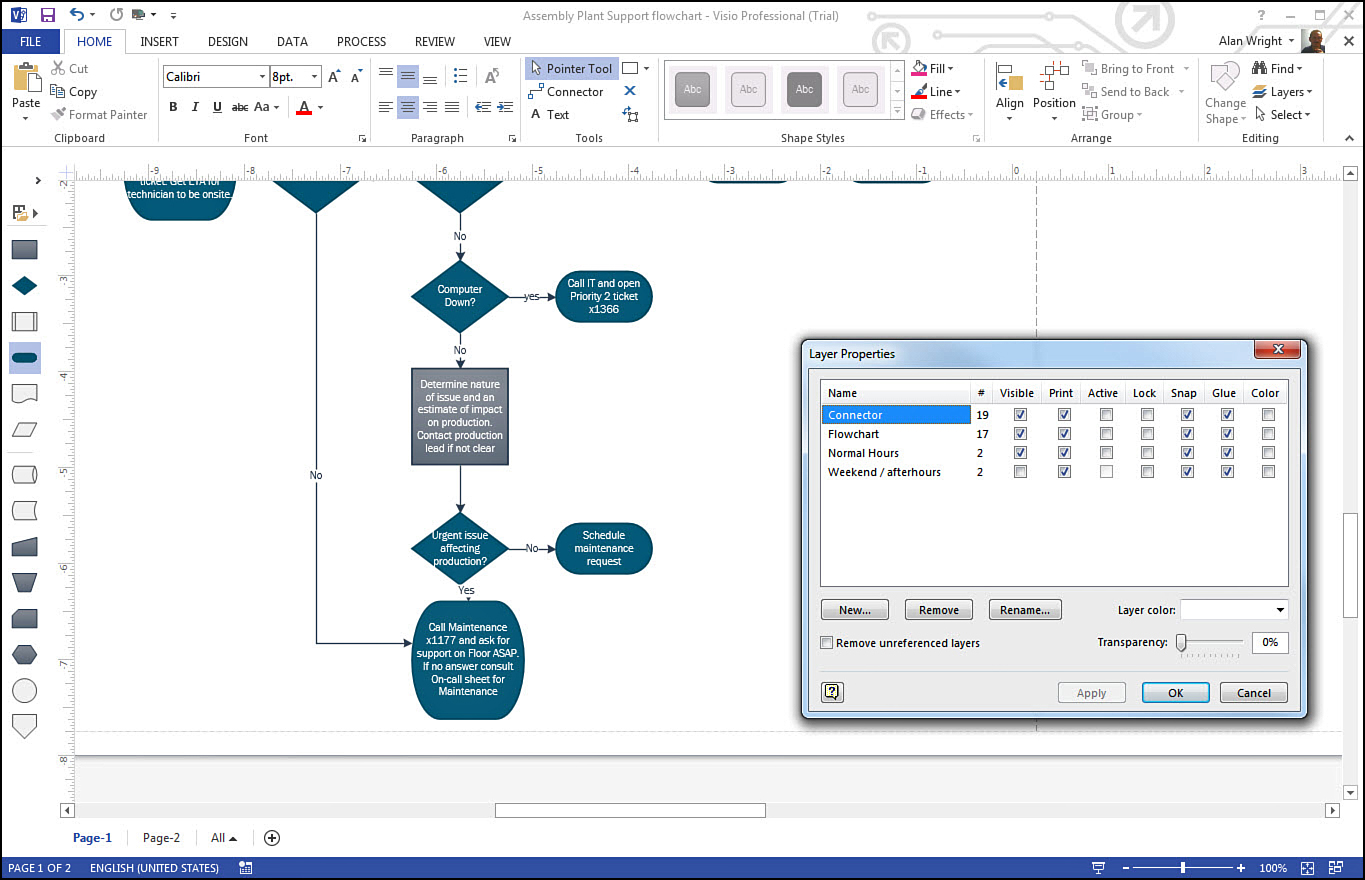
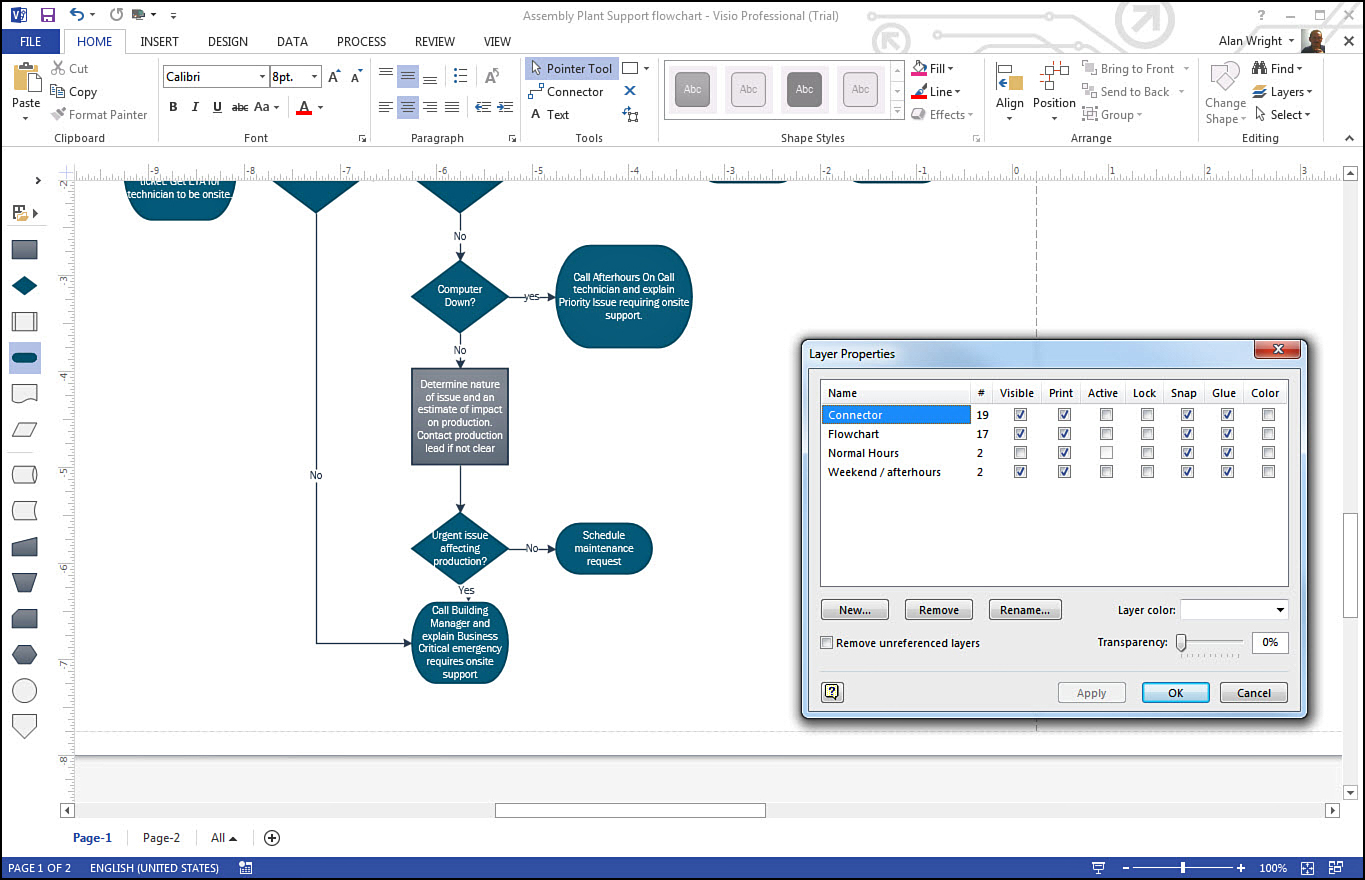
FIGURE 8.24 Layers provide a way to control multiple shapes assigned in one place. The Normal Hours layer has two assigned shapes that are not visible.
So how do you perform this magic?
1. A shape, connector, or multiple components must be selected.
2. Select the Home tab, then select Editing and expand the Layers menu. Select Assign to Layer.
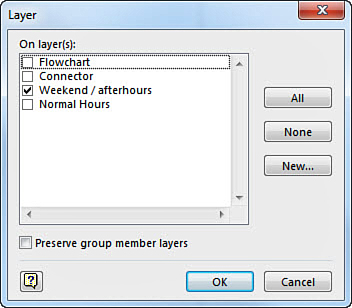
3. In the Layer dialog box, select the layer or layers this item will be assigned to (see Figure 8.25).
4. From the Home tab, select Editing, Layers, and then select Layer Properties.
5. As shown in Figure 8.24, you can modify many properties for a layer, such as visibility or whether it will be included in a printed format.
When to Add Layers
There are many practical reasons to employ layers. By assigning items to a layer you can lock them and prevent modifications or movements while working with content on another layer. The capability to select layers that print allows you to include sensitive or secondary information in a diagram, but not print that layer. Consider several other scenarios:
• Imagine you have a Site Plan diagram that shows the layout of a complex with multiple buildings that are under construction. You can assign structures to layers based on the projected completion dates, and by hiding layers or revealing them you have a handy way to provide snapshots of the project at different points in time.
• In a flowchart you can emphasize the impact of the removal or addition of a resource by your use of layers.
• A floor plan can show or hide furniture or electrical components.
These scenarios might help you imagine ways you would benefit from incorporating layers in your diagrams.