Finding and Fixing Crashing Bugs
Breakpoints are great, but being able to set a breakpoint implies that you have some clue about where a bug is hiding, that you know something in a certain class or method is misbehaving. Problem is, what do you do when that’s not the case?
The most common scenario for not knowing where to begin is crashing bugs. When you crash while running your app from Xcode, the debugger halts the program, but often you’ll find that it’s stopped at the highest level of the app, like in the main function that launched the app, completely removed from whatever caused the crash. In Objective-C—and this was particularly common before Automatic Reference Counting (ARC) simplified memory management—crashes often stop the app in objc_msgsend, mistakenly leading newcomers to the platform that this function is buggy, when in fact it’s just the C function to perform any Obj-C method call.
Whether you land in main or objc_msgsend, the underlying problem is usually that an error or exception has gone unhandled all the way up the call stack. Sometimes the crash is on a different thread than where you stop, or you don’t stop until the next trip through the run loop. In all these cases, you need a technique that gets you into the debugger at the instant the bug occurs, not after it’s crashed everything.
Exception and Error Breakpoints
For some kinds of crashes, Xcode gives us exactly what you need. In Objective-C, many runtime problems throw exceptions which, if they aren’t caught, crash the app. Perhaps the most common of these is making an out-of-bounds access of an NSArray. Consider the following buggy model for a table view:
| | -(instancetype) initWithCoder:(NSCoder *)aDecoder { |
| | self = [super initWithCoder:aDecoder]; |
| | self.members = @[@"Honoka", @"Kotori", @"Umi", @"Hanayo", |
| | @"Rin", @"Maki", @"Nico", @"Nozomi", @"Eli"]; |
| | return self; |
| | } |
| | |
| | - (NSInteger)numberOfSectionsInTableView:(UITableView *)tableView { |
| | return 1; |
| | } |
| | |
| | - (NSInteger) tableView:(UITableView *)tableView |
| | numberOfRowsInSection:(NSInteger)section { |
| | return self.members.count + 1; // bug! |
| | } |
Because [tableView:numberOfRowsInSection:] reports more rows than the members array actually contains, the app will crash when trying to fill a non-existent 10th row of the table.
Problem is, when you run this code, you have no idea this is the problem. The crash stops the app in main.m, which exists only to launch the app in the first place. The console tells us what the exception is, but not where it occurred:
| | *** Terminating app due to uncaught exception 'NSRangeException', |
| | reason: '*** -[__NSArrayI objectAtIndexedSubscript:]: index 9 beyond |
| | bounds [0 .. 8]' |
In a big app, you’d have to start trying to imagine every place in your codebase where there are arrays that might have gone out of bounds. Fortunately, there’s a better alternative: exception breakpoints.
Open the Breakpoint Inspector and notice at the bottom, there’s a plus (+) button. This pop-up menu adds various special kinds of breakpoints. If you choose “Exception Breakpoint…, as shown in the figure, you can add a breakpoint that stops for Objective-C and/or C++ exceptions, either when they’re thrown or caught:

Run the app again and now Xcode will catch the exception when it’s thrown, opening the Editor Area to that point, with the breakpoint indicating the line that is crashing. As you can see in the figure, it’s the call to self.members[indexPath.row], and from there you can investigate the crashing state with the Variables View or by using debugger commands in the Console:

It’s also worth noting that if you look at the Debug navigator, your method will not be the top of the call stack—you’ll instead see that objc_exception_throw is the current call.
What’s interesting about exception breakpoints is that they let the debugger pause the app for a special condition, rather than just breaking on a combination of source filename and line number like normal breakpoints do. The other breakpoints created with the plus (+) button are similar. For example, there’s a Swift error breakpoint that’s more or less equivalent to the Objective-C/C++ exception breakpoint, except that it works when Swift errors are thrown. However, since Apple’s frameworks aren’t written in Swift (yet), this will only be useful for catching Swift errors thrown by your own code, or third-party Swift frameworks.
Symbolic Breakpoints
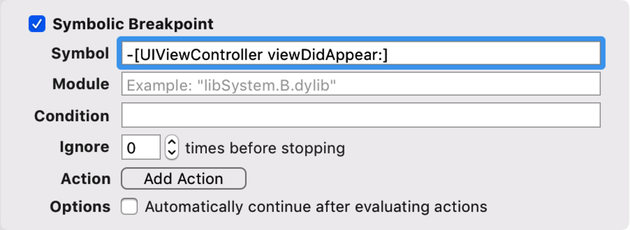
Another of the special breakpoint types, the symbolic breakpoint, is also really useful for investigating hard-to-find bugs. It lets you stop on any method or function call, by name. This gives you a way to set breakpoints in code you don’t own, such as the system frameworks. For example, you can set a breakpoint on viewDidAppear to catch when any UIViewController finishes showing its view.
The challenge with setting symbolic breakpoints is you have to use the language of the symbol you’re calling. For example, UIKit is written in Objective-C, so even if all your classes are in Swift, you still have to use Obj-C syntax to set this breakpoint—such as -[UIViewController viewDidAppear:]—as seen in the following figure:
On the other hand, if you only wanted to stop on a single class’ viewDidAppear, and you knew the class was written in Swift, you’d use the Swift syntax for the breakpoint: SomeOtherViewController.viewDidAppear. For Swift, you only provide the method name, not the inner or outer names of the parameters in its signature, nor the parentheses.
Symbolic breakpoints are really useful for finding out whether certain code is being reached. If you think you’re leaking memory in a navigation-based iOS app, a go-to technique is to set a symbolic breakpoint on -[UIViewController dealloc], drill down in the navigation, and then start going backwards through the navigation stack. Each time you go back, the view controller you backed out of should hit the breakpoint a second or so after the animation finishes, which indicates that the view controller is being freed from memory. If it doesn’t, you’re probably leaking memory. Discovering Memory Leaks introduces more advanced tools for finding and fixing memory leaks.
Main Thread Checker
Another common kind of crash occurs when you access UIKit or AppKit objects from a Grand Central Dispatch queue other than the main queue. For performance reasons, much of the code in these frameworks is thread-unsafe, with the understanding that it will only be called from one thread, and thus, one GCD queue.
Problem is, it’s easy to overlook which queue your code is being executed on. The classic example of this is performing networking, and then updating the UI with data fetched from the net. The completion handlers and callbacks used by Foundation’s URL Loading System always use background queues—this keeps them from slowing down the main thread and its UI tasks. But the obvious upshot is, well, you’re obviously not on the main queue anymore.
Here’s a simple example of code that crashes. It just loads the HTML of the http://apple.com/ website and attempts to convert it to a string and set that string as the text of a UITextView:
| | let url = URL(string: "http://apple.com/")! |
| | let dataTask = urlSession.dataTask(with: url) { dataOrNil, _, _ in |
| | if let data = dataOrNil, |
| | let string = String(data: data, encoding: .utf8) { |
| | self.textView.text = string // bug! |
| | } |
| | } |
| | dataTask.resume() |
The closure will be executed on a non-main queue. Since it attempts to modify a UIKit class by updating textView, it’s doomed to crash. And while it does crash, the Console output is pretty interesting:
| | Main Thread Checker: UI API called on a background thread: |
| | -[UITextView setText:] PID: 77721, TID: 8567832, Thread name: (none), |
| | Queue name: NSOperationQueue 0x61000022fa00 (QOS: UNSPECIFIED), QoS: 0 |
The Main Thread Checker is a tool that only runs at debug time, and checks the thread modifying UIKit or AppKit objects to make sure it’s the main thread (which, as developers, we access by putting work on the main GCD queue). When a violation is caught, it logs the above message and a stack trace which implicates the call.
The stack trace can be hard to read because it uses the machine-generated name of the offending closure, and the error still crashes the Content area into the assembly of a system call, __pthread_kill, so it’s not the prettiest way to catch a bug. Fortunately, Main Thread Checker can be made nicer. Go to the scheme selector, choose “Edit scheme…”, select the “Run” scheme, and then go to the “Diagnostic” tab, shown in the figure:
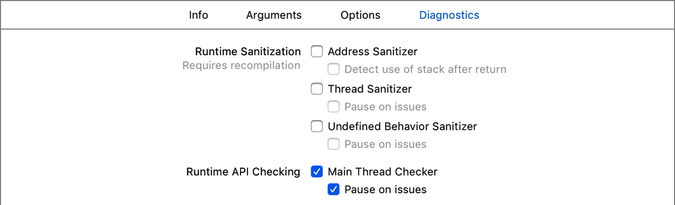
By default, Main Thread Checker is enabled, but its option “Pause on issues” is not. Enable that and run again. This makes the Main Thread Checker work kind of like an Exception Breakpoint, stopping execution at the point where the crash begins, and showing it to you in the Editor area:
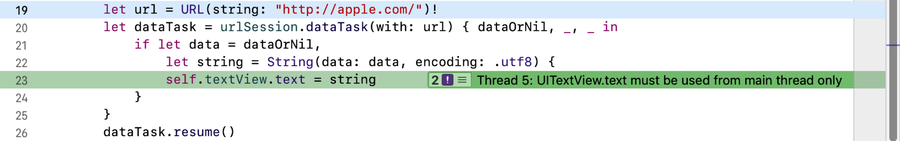
Of course, now that you know where it is, you still need to fix the bug. The simple recipe for problems like this is to just put your UI work on GCD’s main queue with DispatchQueue.async:
| | DispatchQueue.main.async { |
| | self.textView.text = string |
| | } |
Address Sanitizer
Now, throwing an exception out to the main function is all well and good, but experienced developers know that to really create terror and havoc, you need to be working with pointers, preferably in C. Not for nothing does Swift give its pointer types scary names like UnsafeRawPointer.
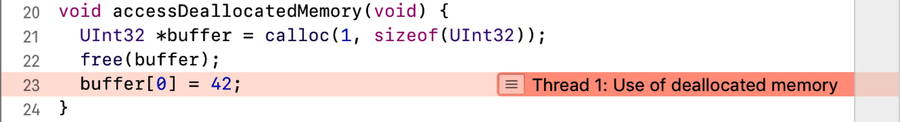
Here’s a C function called accessDeallocatedMemory that is a guaranteed 100% crasher. It’s dirt simple, even if you don’t read C—it allocates some memory (just big enough to hold one UInt32) and stores the pointer as buffer, deallocates the memory, and then tries to set the value of pointed to by buffer:
| | void accessDeallocatedMemory(void) { |
| | UInt32 *buffer = calloc(1, sizeof(UInt32)); |
| | free(buffer); |
| | buffer[0] = 42; |
| | } |
Since the app no longer owns the memory pointed to by buffer, this crashes the app instantly. The app crashes out to main and logs a minimally helpful message:
| | malloc: *** error for object 0x614000000880: Invalid pointer dequeued |
| | from free list |
| | *** set a breakpoint in malloc_error_break to debug |
OK, sure, you could take the advice about setting a breakpoint to debug this, but Xcode 9 provides a much more compelling tool: the Address Sanitizer. This is a tool that marks unallocated and freed memory as “poisoned”, and can catch accesses to poisoned memory at the moment they happen.
This approach is fairly expensive and slows your code down by 2 to 5 times. Because of this, it’s not on by default like the Main Thread Checker. Instead, you have to turn it on, in the same place as before (Scheme Selector > Edit Scheme > Run > Diagnostics), as seen here:
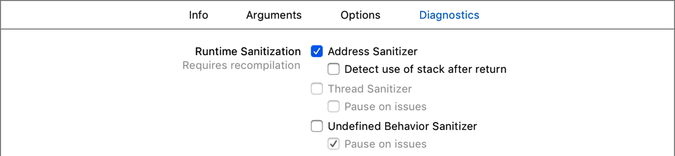
Run the app again, and this time the crash will be caught on the line of code that causes it, as seen in the following figure (you’ll also see the offending call in the stack trace in the Debug Navigator, along with a bunch of log messages from the Address Sanitizer in the Console):
The Address Sanitizer also catches memory mistakes that may not crash your app, but are still bad news. One obvious example of this is a buffer overrun, like the following code:
| | void performBufferOverflow(void) { |
| | UInt32 *buffer = calloc(1, sizeof(UInt32)); |
| | buffer[0] = 42; |
| | buffer[1] = 9999999; |
| | free(buffer); |
| | } |
In this code, buffer is only allocated enough memory to hold one UInt32, so the attempt to set buffer[1] is out of bounds. When run, this may not actually crash, but since it’s writing to an out-of-bounds address, you can’t actually know what’s being overwritten at that address. Fortunately, the Address Sanitizer catches this programming error too:

Even if you’re not crashing, it’s probably a good idea to occasionally run the Address Sanitizer on any C code you’ve written, to catch overflow errors like this one (just don’t forget to switch it off). Overflows are a major source of security problems, since attackers can use overflows to access memory locations they should not have access to. Proper care of your memory allocations and pointers can help put an end to that.