
Managing Memory Mistakes
Performance, as it turns out, isn’t just about writing the most efficient algorithms for important tasks. Everything operates in a context, and in the mobile context, memory is perhaps the most important consideration.
You can, for example, trade memory for better performance. Consider a hypothetical piece of hardware on which trigonometric operations like sine and cosine are really slow—don’t worry, this is not an “asking for a friend” scenario, since iOS devices are pretty good in this department. If you were writing a game that used a lot of math, this slowness could hurt your entire application. One way you might deal with it would be to compute sines and cosines for every degree once, and then just put them in a big 360-member array. Then your trig functions would just be an array lookup: nearly instantaneous. The trade-off is that you’d sacrifice some memory to do this: 2-byte Floats times 360 indexes would cost about half a kilobyte. In this hypothetical example, that’s almost certainly a good deal to take.
But a lot of the times, we developers are not nearly so deliberate in our choices, and nor do we use such small amounts of memory. Our cameras take 20-megapixel pictures, which we happily load into memory. All our views are backed by CALayers that may have 32-bit ARGB representations of their full-size contents, even if we’re viewing them at smaller sizes and thus never seeing the full detail. Throw in some large JSON responses from webservice calls or our own complex data models, and our memory use can add up.
And that’s still fine… if we’re careful about only keeping things in memory for as long as we need them. But when we screw that up, things get bad fast. Memory leaks are perhaps the most common and most destructive programming error on iOS. They’re common because of the inherent challenges of dynamic memory management, and dangerous because these devices don’t have endless memory to spare.
Once memory gets tight, this becomes a performance problem. There’s a good chance you’ve seen your phone slow way down while using an app, particularly some of these bloated social networking apps that make heavy use of embedded webviews. Sometimes what’s really going on is the system desperately trying to free up memory, terminating suspended apps left and right, as the foreground app chows through more memory.
Use a Real Cache | |
|---|---|
|
|
Our hypothetical array-of-sines example is a de facto cache, and there may be times you’d like to cache some data in memory, rather than re-generating or re-downloading it. You might be tempted to use a simple Array or Dictionary, but you should really consider using a genuine NSCache instead. The NSCache class, from the Foundation framework, has a lot of nice memory-management features. Objects are evicted from the cache automatically when memory gets tight, and you can specify a maximum number of objects or a maximum “cost” (in terms you decide) for the entire cache before old contents are removed. |
Discovering Memory Leaks
When you have a memory leak, it can be hard to tell that you even have a problem. Let’s start with a scenario that will make it obvious, and hone your techniques from there.
The download sample code includes an app called MemoryLeakDemo that makes a memory leak really obvious. It’s a navigation app whose first scene just has a button that says “Show Picture”, and a second that loads and displays a picture. The second scene consists of a PictureViewModel and PictureViewController.
The PictureViewModel is designed to retain a gaudy, absurd amount of memory. It uses Bundle.main.url(forResource:extension:) to find an image in the app bundle, loads the raw Data from that location, makes a UIImage from that, and then holds on to both the image and the raw data as properties. Don’t ever write code like this:
| | import UIKit |
| | |
| | protocol PictureViewModelDelegate { |
| | func modelDidLoadPicture(_ model: PictureViewModel) |
| | } |
| | |
| | class PictureViewModel { |
| | |
| | private (set) var image: UIImage? |
| | private var imageData: Data? |
| | var delegate: PictureViewModelDelegate? |
| | |
| | func loadImage() { |
| | guard let imageURL = |
| | Bundle.main.url(forResource: "bundle-image", |
| | withExtension: "jpg") else { return } |
| | do { |
| | let imageData = try Data(contentsOf: imageURL) |
| | if let image = UIImage(data: imageData) { |
| | self.imageData = imageData |
| | self.image = image |
| | self.delegate?.modelDidLoadPicture(self) |
| | } |
| | } catch { |
| | print ("couldn't load image data: (error)") |
| | } |
| | } |
| | } |
It would obviously be simpler and more responsible to put the image in the asset library, and load it with UIImage(named:). But the point here is not to be responsible. The idea is to waste enough memory that you can create a problem bad enough to be detectable.
Now let’s take a quick look at the PictureViewController. Notice that the view model declared a PictureViewModelDelegate. That’s used to tell a delegate that the image has been loaded successfully. The view controller implements that delegate protocol, using the modelDidLoadPicture(:) callback to load the picture into the UI:
| | import UIKit |
| | |
| | class PictureViewController: UIViewController { |
| | |
| | @IBOutlet var imageView: UIImageView! |
| | var model: PictureViewModel? |
| | |
| | override func viewDidLoad() { |
| | super.viewDidLoad() |
| | model = PictureViewModel() |
| | model?.delegate = self |
| | model?.loadImage() |
| | } |
| | } |
| | |
| | extension PictureViewController: PictureViewModelDelegate { |
| | func modelDidLoadPicture(_ model: PictureViewModel) { |
| | print ("modelDidLoadPicture") |
| | imageView.image = model.image |
| | } |
| | |
| | } |
When the view loads, the view controller creates a model, sets itself as the model’s delegate, and tells the model to load its picture. In the delegate callback, it updates the UI. This looks perfectly reasonable, so go ahead and run the app.
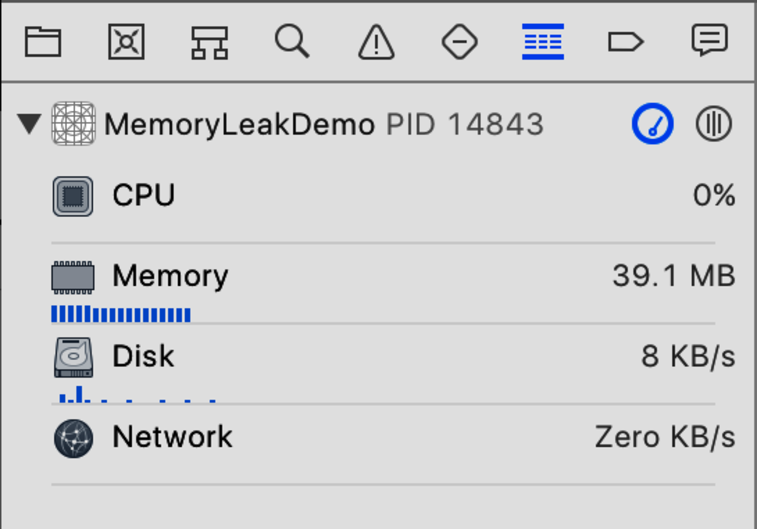
Once the app is running, switch back to Xcode and take a look at the window. Unless you’ve changed Xcode’s “Behavior” preferences, the left pane will automatically switch to the Debug Navigator (⌘7). As seen in the figure, this gives a bare-bones sense of the app’s CPU, memory, disk, and network usage as the app runs. At launch, the app may take up somewhere around 30--40 MB; the actual amount can vary depending on the device, since the larger screens of iPads and “Plus”-size iPhones will use more RAM for their views.
Click the “Show Picture” button and notice as the new view slides in and the picture appears, the app’s memory usage goes up by about 40 MB. That’s to be expected, because you do have that model class holding on to both the raw data and the UIImage, plus there’s a whole new view hierarchy to account for.
Now click “Back”. The memory doesn’t go down. Uh oh. Since you don’t need that scene anymore, you would hope that the view controller, its model, and the image and data being held by the model would be freed. Try clicking “Show Picture” again. The memory goes up again. Go back and forth a few times and you can waste quite a bit of memory:

Houston, we have a problem. Some iOS 11-capable devices only have 1 GB of memory, and that’s supposed to hold the system and all running apps—you could easily blow through that in less than a minute at this rate. Well, not really, since once you’ve used too much memory, the system will terminate the app to protect the rest of system. And this is the extreme example of how memory problems are performance problems: nothing performs worse than an app that’s been killed.
Now that you know you have a problem, the next step is tooling up to find the problem.
Isolating Memory Leaks with Instruments
For finding all sorts of performance problems, Xcode’s go-to tool is Instruments. This is a separate Mac application, built into Xcode itself. Instruments is designed to profile your app as it runs, measuring how it uses resources like memory, CPU time, threads, network, and more.
Stop the app if it’s still running, and then launch Instruments with menu item Product > Profile (the key command is ⌘I, which you can remember as “Instruments”). When Instruments launches, it shows a window offering icons for the various services it offers, as seen in the following figure (these are profiling templates, each of which combines one or more of the actual profiling instruments):

On this screen, choose the “Leaks” template, whose icon shows a droplet of water leaking from a pipe. This opens up a new Instruments window, as shown in the following figure:

The Instruments window is laid out somewhat like Xcode itself: a toolbar at the top with record/stop buttons and a scheme selector on the left, an iTunes-like status box in the middle, and show/hide buttons on the right. Below this is a timeline with two tracks, one for each instrument we’re using. Since you chose the Leaks template, you get both the Allocations instrument (which tracks all memory allocations) and the Leaks (which specifically calls out memory leaks). Finally, at the bottom, there’s a large empty table that will be filled in shortly.
Click the red “Record” button on the left end of the toolbar to launch and run the app. Once the app starts, the playhead on the timeline will start advancing and each track will fill in with a visualization of what the app was doing at that time. For example, the Allocations track will show a bar graph of overall memory use, while the Leaks track will show a green checkmark when no leaks have been detected, and a red x when leaks are found.
While Instruments is recording, switch to the Simulator or your device and interact with the app again, going forward and back, to the picture view and back. After a few times, click the Record button again to kill the app and stop recording. Your Instruments window will look like the figure.
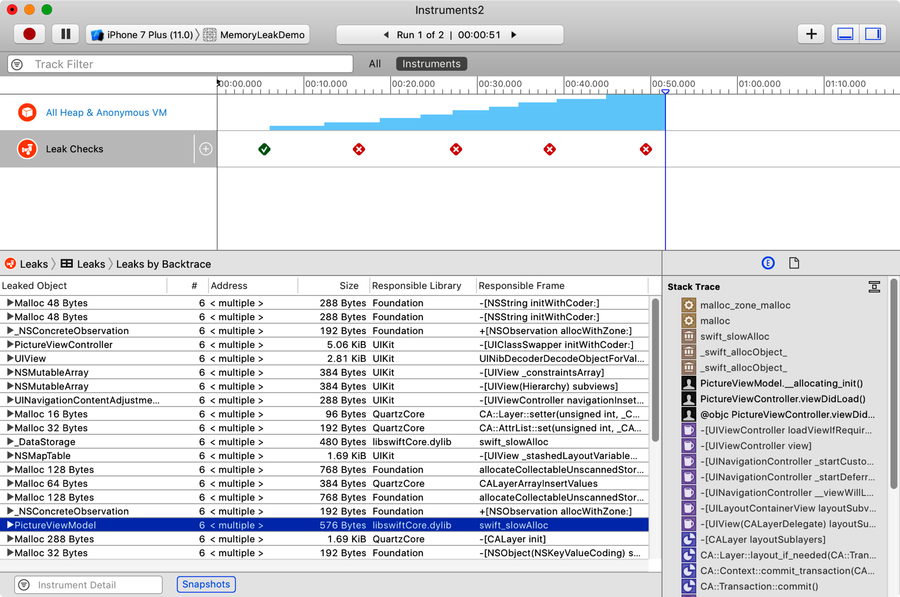
In the Allocations track, you see the dreaded “Staircase of Doom”, a memory use graph that only goes up and never down, clearly showing you have a bad memory leak. In the Leaks track, several red x’s show that you have leaks; mouse over them and a tooltip will appear showing you have dozens or even hundreds of leaks.
You can click either track to populate the bottom pane of the screen with details of that instrument. This area has a hierarchical pop-up controller at its top that works kind of like the scheme selector. Click the Leaks track, and the control will show as “Leaks > Leaks > Leaks by Backtrace”, while the table fills in with a list of every type that has leaked, how many instances have leaked, and other details.
Most of the types that have leaked are built in Foundation and UIKit classes. But you shouldn’t take that as evidence of memory leaks in iOS itself; it’s more likely these are caused by this app leaking memory, and holding on to instances of these types. So the essential strategy is: search for your own classes, because those are probably what’s leaking. You can scroll up and down in the table, or use Edit > Find (⌘F) to search for one of your classes by name. Search for “Picture” and sure enough, you’ll find PictureViewController and PictureViewModel. Click either and a detail pane at the bottom right shows a call-by-call stack trace of when the leaked object was created.
It can also be helpful to search for your types in the Allocations instrument. Click the Allocations track and then do a find for “Picture” in its Statistics table. This table shows the number of “Persistent” instances of the type, meaning those that are still in memory, versus “Transient” instances, which were present at one time but have since been freed.

From the looks of this figure, no instance of PictureViewController or PictureViewModel has ever been freed; they’re all persistent in memory. These classes are clearly leaking.
So the next question is: why? Fortunately, Xcode and Instruments can help you figure that out too.
Fixing Memory Leaks
Instruments has implicated your classes as leaking memory. Now you need to figure out why. And that means thinking about what causes a memory leak in the first place.
Automatic Reference Counting (ARC) should take care of this for Swift and Objective-C reference types (i.e., classes) by keeping track of how many valid references there are to any object. Once the count of incoming references drops to 0, the object gets freed. Somehow, one or both of these objects are failing to ever get down to 0.
What should be happening is that there is one reference to the view controller: the navigation controller will have a reference to it in its stack. But that means when the user goes back in the UI, the view controller is popped off the navigation stack, and its count should then go to zero. Obviously, this isn’t happening. As for the model, the only object that knows it exists is the view controller (which has the model as a property), so it’s a good bet the model leak is a side effect of the controller leak.
Instruments can help with this. Select the Leaks instrument in the timeline, and then atop the detail area, change the second member of the Leaks > Leaks > Leaks By Backtrace control to “Cycles & Roots”. This display shows cases where there are cycles of object references, rather than one-directional hierarchies. The table shows both PictureViewController and PictureViewModel. Click one, and it shows a graph of the objects’ relationship, as in the following figure:

Now you have a good lead on what the problem is. Reference cycles are almost always a mistake, and here you can see what is almost certainly the problem: the PictureViewController’s model property is a reference to the PictureViewModel, but the model’s delegate property refers back to the view controller.
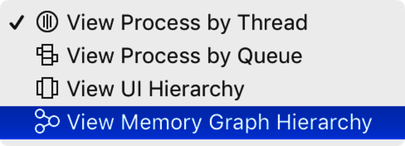
You can get an even better view of the problem back in Xcode. Run the app in Xcode, and go back and forth a few times to leak some memory. Then, in the left pane’s Debug Navigator, next to where it says “MemoryLeakDemo” and a PID (process ID), notice that the icon on the far right of this line is actually a pop-up button. It starts as “View Process By Thread”, but select “View Memory Graph Hierarchy” instead.

This stops the app, as if on a breakpoint (in fact, it can be resumed with the breakpoint controls in the debug area, as usual). The empty space in the Debug Navigator fills in with a hierarchical list of objects, grouped by framework or module. The first of these groups is the current app. Expand the group to see types defined by the app, such as your PictureViewController and PictureViewModel.
Each instance of an object is shown by its address in memory, and some of them have a purple exclamation point icon next to them. These indicate your leaks. Click one of them to bring up an object graph in Xcode’s content pane, as seen in the following figure:

This graph shows the reference cycle between the model and the view controller, with a “2” in the line to indicate there are two references here. Click the “2”, which will reveal a pop-up that names both model and delegate as the offending parties in a reference cycle, reaffirming what Instruments already tipped you off to.
So how do you fix it? The problem with a reference cycle is that the controller holds a reference to the model (keeping its reference count from ever reaching 0), and the model holds a reference back to the controller (which keeps its count above 0). One of these references has to be eliminated for the cycle to break. The way you do that is with a weak reference, one that refers to the other object but doesn’t count toward its total reference count.
This happens a lot with delegates, and the common practice in both Swift and Objective-C is for the reference back to the delegate to be the weak one. So, in PictureViewModel.swift, you need to change the declaration of delegate as follows:
| | weak var delegate: PictureViewModelDelegate? |
This will force you to make one other change: you can’t declare an instance of the PictureViewModelDelegate to be weak if it’s not necessarily a reference type (the protocol could, in theory, be implemented by extensions on an enum or struct), so you need to change the protocol declaration to say any implementation must be a class:
| | protocol PictureViewModelDelegate: class { |
Apply these fixes and run again. Now the Debug Navigator should show the memory dropping back down when you go back to the first scene. For an even better view, try it out again in Instruments:

As seen in the preceding figure, the Allocator instrument shows memory use going up and then back down, rather than the Staircase of Doom you saw before, and the Leaks instrument is all green checkmarks. Problem solved!