Chapter Eleven
Visualization with Java, Classes, Packages
We have already seen in Maple how helpful visualizations are in understanding results and debugging the computation, and in adding some fun to your work. Fortunately, there is an excellent Java plotting package called PtPlot that is both free and easy to use, and in §11.1 we will show you how to use it.1 In order to use PtPlot, you will need to import a package and work with multiple classes. This is no worse than what we did in Maple. Not only will this use of PtPlot give you some beautiful graphs, it will also give you some experience with objects.
Truly understanding Java’s packages, classes, and naming conventions is rather advanced for beginners, and so we will first just give you a sample program to modify, and then tell you about packages and such. We recommend that all users read §11.1, but maybe scan the other sections and treat them as reference materials for the present. In particular, §11.4 on gnuplot will be needed to create 3-D surfaces from data.
11.1 2-D GRAPHS WITHIN JAVA: PTPLOT
One of the exceptional things about Java is that it contains commands that permit you to draw graphs on your computer screen—regardless of your operating system. Yet these commands are rather low level, as we shall see in Chapter 21, and you must attend to a number of details if you want to use them. To avoid all that fuss, we recommend the use of PtPlot [PtPlot] as a basic plotting package for 2-D graphs.2 PtPlot is free, supported by the University of California, written in Java (and thus runs under Unix, Linux, Mac OS, and MS Windows), is easy to use for 2-D data plotting, and produces attractive graphs.3 It may be incorporated right into your programs or applets (applets are discussed in Chapter 21), or used as a stand-alone application or applet. We include on the disk the PtPlot Java library; alternatively, you may download the most recent version over the Web.

Figure 11.1 Sample output from advanced use of PtPlot in which two plots are placed side by side (see TwoPlotExample.java).
11.1.1 EasyPtPlot.java
Listing 11.1 EasyPtPlot.java

Figure 11.2 is an example of an advanced PtPlot graph. Listing 11.1, containing the program EasyPtPlot.java, is an example of a how to construct a simple graph of cos(x) versus x with PtPlot. Before you try running this program, you need to have PtPlot installed on your computer (see your system administrator or §11.1 to do it yourself). Though we encourage you to use this program as a template, there are several parts of it you will need to understand.
On line 2 we see the statement import ptolemy.plot.*;. This statement copies in or includes the plotting package programs (class files) with your program.4 In a general sense, PtPlot deals with an object that represents your plot.5 We call this object myPlot and create it on line 7. There it is created as a variable type that PtPlot has defined as Plot. Here we get some practical experience with them, which will help when we need to understand them. We then add various features, step by step, to myPlot to make it just the plot we want. On line 8 we give it a title, and on lines 9 and 10 we label the x and y axes. As is standard with objects in Java, we first give the name of the object and then modify it with “dot modifiers.” (These modifiers are like the arguments to Maple’s plot command, only here the arguments get attached to the objects.)
At this point we could also tell PtPlot what range of x and y values are to be plotted, but we do not! Instead we let PtPlot set the x and y ranges based on the extents of the data it is given. Line 13 begins a for loop that repeats itself for a number of increasing x values. (for loops are discussed in Chapter 12, “Flow Control via Logic; Projectiles.”) During each repetition, line 14 calculates a new value of y = cos(x) and then line 15 adds a point (x, y) to your plot object. By having true as the fourth argument in myPlot.addPoint(0, x, y, true), we are telling PtPlot to connect the previous point to the new one.
You will need to place your own function, or data to be plotted, on line 14 where we call cos(x). If you have written a method or function whose output you wish to plot, it may be called on line 14. So far, your plot object myPlot exists only in the computer’s memory. For you to have that plot appear on the computer screen in front of you, you need line 16 to create a PlotApplication with your plot as its input.
11.1.2 Running the Sample Program
We have tried to make EasyPtPlot.java simple. However, we encourage you to make it fancier by including more options as commands, or by using the pulldown menus in the PtPlot window in which your plot is displayed. We discuss the options below, but before that, we recommend that you run the sample program and see what we are talking about:
1. Compile and execute EasyPtPlot.java in the usual way:
2. You should get a pretty window on your screen just like Figure 11.1. You may move it anywhere on your screen by grabbing the bar on top, and resize it by grabbing a corner and pulling. Try that!

Figure 11.2 Sample output from PtPlot in which three data sets are placed on one plot. Observe the error bars on two sets.
3. By grabbing a corner and pulling, make the window fill about one quarter of your screen.
4. Examine the Edit pull-down menu. Select Edit and pull it down. (Alternatively, the E indicates that this is possible with keystrokes alone. In this case, Alt + E also pulls down the menu.)
5. From the Edit pull-down menu select Format. You should get a window like that in Figure 11.3 that lets you control most of the options in your graph.
6. Experiment with the Format menu. In particular, change the graph so that only points are plotted, with the points being pixels and black, and so that your name is in the title.
7. Select a central portion of your plot and zoom in on it by drawing a box (with mouse button depressed) starting from the upper left corner and then moving down before you release the mouse button. You zoom out by drawing a box from the lower right corner and moving up. You may also resize your graph by selecting Special/Reset Axes or by resetting the x and y ranges. And of course, you always have the option of starting over by closing the Java window and running the java command again.
8. Scrutinize how you are able to print your graphs under the File menu, as well as write them to file in postscript (.ps format). You may also export plots in various formats.

Figure 11.3 The Format submenu located under the Edit menu in a PtPlot application. This submenu controls the plot’s basic features.
11.1.3 PtPlot Options

The program TwoPlotExample.java and its data file data.plt, taken from the PtPlot Web site, shows how to place two plots side by side, and how to read in a data file containing error bars and various symbols for the points. Here we list some of the options available. More are to be found in the description of the commands (methods) on the PtPlot Web site [PtPlot].
At various times you may have your data in a file, possibly because it came from another application or because you wanted to get it all computed or measured before you started looking at it. If you write your data in a format that PtPlot recognizes, then you will be able to plot it and replot at your pleasure. This may sound like a lot of work, yet most reasonable formats will work. However, you have the option of including some PtPlot formatting commands in the data file.
In the simplest form, a PtPlot Data Format is just a text file with a single x, y point per line. For example, Figure 11.2 was produced from a data file with the x and y values separated by spaces, tabs, or commas:
Sample PtPlot Data file PtPlotdat.plt

To plot up your data files, enter
![]()
This causes the standard PtPlot window to open and display your data. If this does not work, then your CLASSPATH variable may not be defined properly, or PtPlot may not be installed. See “Installing PtPlot” in §C.5.
Reading in your data from the PtPlot window is an alternative. Either use a window that is already open, or issue Java’s run command without a file name:
![]()
To look at your data from the PtPlot window, choose File → Open → YourDataFile. By default, PtPlot will look for files with .plt or .xml suffixes. However, you may enter any name you want, or pull down the Filter menu and select * to see all of your files. The same holds for the File → SaveAs option. In addition, you may Export your plot as an Encapsulated PostScript (.eps) file, a format useful for inserting in documents.
As with any good plot, you should label your axes, add a title, and customize other parts of your plots to make them informative and clear. To do these things, include PtPlot commands with your data, or work with the pull-down menus under Edit and Special in the PtPlot window. The options are essentially the same as ones you would call from your program. Here is a useful list:
TitleText: f(x) vs. x |
Add title to plot |
XLabel: x |
Label x axis |
YLabel: y |
Label y axis |
XRange: 0, 12 |
Set x range (default: fit to data) |
YRange: -3, 62 |
Set y range (default: fit to data) |
Marks: none |
(Default) No marks at points, lines connects points |
Marks: points |
or: dots, various, pixels |
Lines: on/off |
Do not connect points with lines; default: on |
Impulses: on/off |
Lines down from points to x axis; default: off |
Bars: on/off |
Bar graph (turn off lines) default: off |
Bars: width (, offset) |
Bar graph; bars of width and (optional) offset |
DataSet: string |
Specify data set to plot; string appears in legend |
x, y |
Specify a data point; comma, space, tab separators |
move: x, y |
Do not connect this point to previous |
x, y, yLo, yHi |
Plot (x, y – yLo), (x, y + yHi) with error bars |
If commands appear before DataSet directives, then the command will apply to all data sets. If commands appear after DataSet directives, then it will apply to that data set only.
11.2 INSTALLING PTPLOT: SEE APPENDIX C*
11.3 CLASSES AND PACKAGES*
Up until this point your programs have contained a single class contained in a file with a .java or .class extension. That class contained a main method and possibly some other methods as well. Just as we encourage you to modify old programs rather than writing all programs from scratch, so we encourage you to include methods you and others have already written and debugged into your new programs. Java contains a large number of libraries consisting of collections of methods for various purposes, and you should think of these libraries as toolboxes from which you extract individual tools needed for your programs. In fact, the object-oriented approach of Java is specifically designed to make reuse of components easier and safer.
Table 11.1 Some of Java’s packages and the classes they contain.
Java Package |
Classes for |
java.lang |
Basic elements of Java language |
java.util |
Utilities; random-number generators, date, time, etc. |
java.awt |
Abstract Windowing Toolkit; creates graphical interfaces |
java.applet |
Creates applets and interacts with browsers |
java.beans |
Creates reusable software components |
java.io |
Data input and output |
11.3.1 Including Packages*
We have already referred to a collection of related methods as a class and, for a broader collection, as a library (like the Math library). In strict Java naming convention, each method would be in a class file, and the libraries would be called packages. In general, there are two types of packages: the standard Java packages that constitute the Java language, and user-defined packages that extend standard Java. The PtPlot package is an example of a user-defined package. Some of the standard Java packages are given in Table 11.1.
Because these Java packages contain hundreds or thousands of classes, some organization is necessary to keep track of what each method does. Java does this with a hierarchical directory structure in which there are parent packages containing subpackages, with the subpackages containing more subpackages or various classes. To make the name of each class unique, one precedes it with the names of the package and subpackages that contain this class. As an example, consider the command
System.out.println
that we have been using to print a line of output on the screen. Here System is the name of the class (classes begin with capital letters) containing many of Java’s methods. When we give the combination System.out, we are referring to an object representing the standard output stream. The final println that gets affixed to System.out is the name of the method that prints lines.
To summarize, by convention, the names of classes are capitalized, while the names of packages and methods are lowercase. This is relevant here because the System.out.println command is in the java.lang package, and so the proper full name of the command is actually
java.lang.System.out.println
which contains the package name as well. Because java.lang is the most basic package, the java compiler automatically looks there to find the methods we invoke. This means we can, fortunately, leave off the java.lang prefix. Technically, java is the main package and lang is a subpackage, but it is easier to just say java.lang is the package. We must admit that we sometimes find Java’s naming conventions overwhelming. Nevertheless, we will use them when importing packages and in using methods from other classes, so some familiarity is helpful.
You include the classes from a package with the Import command. It may be given in one of two forms:
![]()
The import command tells the Java compiler to look in the package packageName for methods that it might not find otherwise. However, for the importation to work the compiler must know where the package of classes and their methods are stored on your particular computer. In other words, the compiler needs to know the path to follow through the local disk memory to get to the directory or folder where the classes are stored. For this purpose each computer system, be it Windows, Unix, or Mac OS, has an environmental variable named CLASSPATH that contains the explicit path to where the classes are stored on that particular computer. As we show in §C.5 on installing PtPlot, you will need to modify this variable before a package is imported.
Even though what follows is more advanced programming than we do in this book, for completeness we indicate how you could create your own packages. This is done by placing several classes in the same .java file and then including a package command at the beginning of the file:

Your package may be a collection of methods without any main method, for example, mathematical subroutines that are called from all the programs you write. However, there must be one main method someplace if the program is to run, since execution always begins in a main method. Likewise, the main method must be a public class (other classes are read only the public classes).
11.4 GNUPLOT BASICS
Gnuplot is a versatile 2-D and 3-D graphing package that makes Cartesian, polar, surface, and contour plots. In spite of PtPlot being fine for 2-D plotting with Java, we still have a need for gnuplot’s surface plots of numerical data. Gnuplot is open software, available for free on the Web, and produces many output formats.
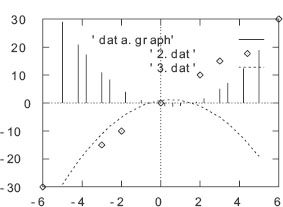
Figure 11.4 A gnuplot graph for three data sets with impulses and lines.
You begin gnuplot with a file of (x y) data points, say, graph.dat. You then issue the gnuplot command from a shell or from the Start menu. You then get a new window with the gnuplot prompt gnuplot>.You construct your graph by entering gnuplot commands at the gnuplot prompt or by using the pull-down menus in the gnuplot window:
In Figure 11.4 we plot a number of graphs on the same plot using several data files and the command:
gnuplot> plot ’graph.dat’ with impulses, ’2.dat’, ’3.dat’ with lines
The general form of the 2-D plotting command is:
plot{ranges}function{title}{style} {, function …}
with points |
Default. Plot symbol at each point |
with lines |
Plot lines connecting the points |
with linespoint |
Plot lines and symbols |
with impulses |
Plot vertical lines from x axis to points |
with dots |
Plot small dot at each point (scatter plots) |
It is necessary to place all file or directory names in single or double quotes and to separate file names with a comma. Explicit values for the x and y ranges are set with the plot options:

Figure 11.5 Gnuplot’s surface plot of a scattering amplitude ImT as a function of complex energy E.
![]()
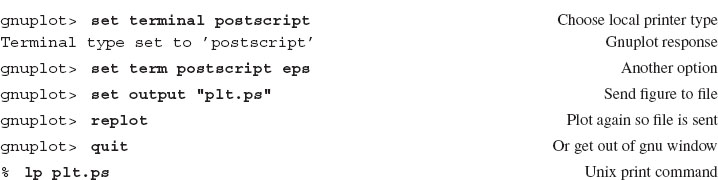
11.4.1 Printing Plots
Gnuplot supports a number of printers including PostScript ones. The basic method of printing plots is:
1. Set “terminal type” for your printer.
2. Send the plot output to a file.
3. Replot figure for new output device.
4. Quit gnuplot (or get out of gnuplot window).
5. Print file.
You could also import the file into a word processor to have it appear in a document or into a drawing program to fix it up just right. To see what type of printers and other output devices are supported by gnuplot, enter the set terminal command without any options into a gnu window for a listing of available terminal types. Here is an example of creating a PostScript figure and printing it:
11.4.2 Gnuplot Surface (3-D) Plots
The surface (3-D) plot command is splot, and it is used in the same manner as plot—with the obvious extension from (x, y) to (x, y, z). As discussed in Chapter 4, a surface, such as that in Figure 11.5, is specified by giving just the z values for successive rows, with different rows separated by blank lines:

Because there are no explicit x and y values given, gnuplot labels the x and y axes with the row and column number. At present gnuplot does not have the capability to rotate 3-D plots interactively. Instead, you adjust your plot with the command:
gnuplot> set view rotx, rotz, scale, scalez
where 0 ≤ rotx ≤ 180° and 0 ≤ rotz ≤ 360° are angles in degrees, and the scale factors control the size. Any changes made to a plot are made when you redraw the plot using the replot command.
To see how this all works, here we give a sample gnuplot session that we will use in Chapter 20 to plot a 3-D surface from numerical data. Listing 20.1 contains the actual code used to output data in the form for a gnuplot surface plot.
![]()
Then, a special gnuplot shell starts up with the prompt gnuplot>, and you are ready to give gnuplot your subcommands.6


For this sample session, the default output for your graph is your terminal screen. To print a paper copy of your graph, we recommend first saving it to a file as a PostScript document (suffix .ps), and then printing out that file to a PostScript printer. You create the PostScript file by changing the terminal type to Postscript, setting the name of the file, and then issuing the subcommand splot again. This plots the result out to a file. If you want to see plots on your screen again, you need to set the terminal type to x11 again (for Unix’s X Windows System), and then plot it again.
11.5 JAVA ARCHIVES: JAR*
The standard Java Development Kit provides an archive tool jar that permits you to compress and decompress files using the zip file format. Even if you do not feel the urge at this moment to save disk space by using it, jar also lets you create an archive of all your work saved in the directory structure you have already created, and then unpack the archive into a directory with the same structure. This permits you to efficiently and safely save and transfer entire directory structures from one place on the computer to another, or from one computer to another, without worrying about leaving out some important files. What is more, since it is Java, it will work on all computers.
The basics operations with jar, made from the command line, are [SunJ]:

Here the options to the jar command follow it directly, with several options concatenated (placed end to end). The c option indicates that you want to create a jar file. The f option indicates that you want to use the file that follows the f (rather than the standard input or output). The t option indicates that you want a table of contents. The x option indicates that you want to extract some files. The v option may also be included with any of these commands to obtain a verbose version of the action in which jar tells you what it is doing as it does it (we recommend that). Check too that we have followed the convention of using a .jar extender to jar file names, though this is not required.
We have indicated the input files (those to be archived) explicitly as file1 and file2. You are also permitted to use the wild-card symbol * to archive all the files and subdirectories in the current directory. A particularly valuable feature of jar is that if any of the indicated files are directories, then the entire contents of those directories are added to the archive recursively. In turn, when archived directories are extracted, the entire directory and subdirectory structures are extracted.
Here we give an example in which we issue the jar command from a directory containing the files EasyPtPlot.class and OOPlanet.java, and the directory Plot, that itself contains a whole bunch of files. We create the archive All.jar:
![]()
Whereas there is no indication that this was successful, we check what is in All.jar by looking at its table of contents:

If we ask for a verbose form of creation, we would see a list of the file names as they are added to the archive:

We see that we also get an indication of how much compression is made for the archived files. The source code is deflated by roughly 2/3, the compiled code by roughly 1/3. Extraction of a single file or of the entire archive is simple:


1PtPlot is actually part of Ptolemy, an entire computing environment that is powerful, free, and Java-based.
2Parts of this chapter were prepared with the help of Connelly Barnes.
3For our research publications we use AceGr/Xmgr for 2-D plotting and gnuplot for 3-D surfaces.
4More specifically, you are copying a subdirectory ptolemy, which, in turn, contains the subdirectory plot. The * is a wild-card character, and its use here means to copy all the files (class files) in that subdirectory.
5Objects are discussed in Chapters 16 and 18.
6Under Windows, there is a graphical interface that is friendlier than the gnuplot subcommands. The subcommand approach we indicate here is reliable and universal.