CHAPTER EIGHT
ALIGNING EXTERNAL PARTNERS
THE FINAL COMPONENT in an organization alignment program is for the enterprise to build scorecards with strategic external partners, such as key suppliers, customers, and alliances. When an enterprise builds a Balanced Scorecard with a strategic external partner, it enables the senior managers from the two entities to reach a consensus about the objectives for the relationship. The process creates understanding and trust across organizational boundaries, reduces transaction costs, and minimizes misalignment between the two parties.
The scorecard also provides an explicit contract by which interorganizational performance can be measured. Without a Balanced Scorecard, contracting with an external partner focuses only on financial measures, such as price and cost. A Balanced Scorecard provides a much more general contractual mechanism that allows service, timeliness, innovation, quality, and flexibility to be incorporated into the relationship.
SUPPLIER SCORECARDS
Supply-chain management is both interfunctional and interorganizational. It is interfunctional because the effective production and supply of goods require close coordination among marketing, operations, procurement, sales, and logistics. It is interorganizational because the systems and processes among all the supply-chain participants—raw materials provider, manufacturer, distributor, and retailer—must be integrated and coordinated for optimal performance along the entire chain. The Balanced Scorecard, the ideal alignment mechanism, should provide great benefits for supply-chain management.
In the 1980s, many companies adopted total quality management and just-in-time practices. A natural consequence of these Japanese management tools was that manufacturing companies built stronger relationships with their suppliers so that defect-free components and products could be reliably delivered, just-in-time to plants’ production processes. Supplier selection, formerly based on price, now had to incorporate a potential supplier’s capability for on-time delivery of zero-defect products.
Metalcraft Supplier Scorecard
Metalcraft Corporation (disguised name) is one of the largest Tier-1 automotive suppliers in the world.1 It operates an extensive system of its own suppliers and evaluates their performance with an extensive supplier scorecard system. The Metalcraft supplier scorecard classifies performance in three categories: quality, timing, and delivery. Each supplier plant receives a monthly rating from each Metalcraft plant to which it ships. Metalcraft calculates an overall supplier rating by aggregating the scores from all of a supplier’s plants.
Quality
The supplier scorecard uses three measures of quality: an overall measure based on the status of the supplier plant’s implementation of specific ISO and quality standards, launch quality rejects (QRs), and parts-per-million (PPM) defect rates.
Metalcraft stresses the ability to ramp up production quickly for new products. It therefore highlights a supplier’s ability to achieve high-quality production quickly during a new product launch phase. The QR (launch quality reject) score measures the number of problems reported in the production start-up phase of a new component. QRs are tracked from the date that a first prototype was built until fifteen days after the start of full production.
Once high-volume production is under way, Metalcraft measures PPM defect rates by dividing the number of defective parts (returned, scrapped, or reworked) that it receives from a supplier by the total number of parts received, multiplied by one million.
Timing
The timing section of the scorecard tracks the supplier’s ability to meet promised dates for certification of new components for production. Metalcraft uses a detailed certification process to verify that components made using the final production process adhere to engineering specifications. Like the QR metric, this measure assesses a supplier’s ability to bring new components into high-volume production quickly and reliably.
Delivery
Metalcraft operates just-in-time production processes. Any delay in supplier delivery leads to rescheduling costs, overtime production, and expedited delivery costs. Metalcraft scores delivery performance on several dimensions, including under- and overshipment to schedule, communication and record maintenance, and problem resolution and prevention.
Metalcraft’s supplier scorecard aggregates a plant’s quality, timing, and delivery performance into an aggregate green, yellow, or red score. A green plant qualifies for unrestricted sourcing. A yellow plant can continue to be used for sourcing but only after a “nonpreferred sourcing approval request” has been approved by a senior supplier development engineer. A red plant, considered a “nonpreferred” supplier, requires even higher-level approval to remain as a supplier; if it remains red for three consecutive months, its products may be sourced from an alternative facility.
Other Supplier Scorecards
Dana Corporation, another automotive OEM supplier, operates a Supplier Balanced Scorecard (SBS) system that tracks supplier performance on four dimensions:
- Quality (25 percent)
- PPM (0.8)
- Number of reject occurrences (0.2)
- On-time delivery (25 percent)
- Support (25 percent)
- Supplier’s commitment to supporting Dana’s goals of minority sourcing and QS-9000/ISO-14000 implementation (criteria reestablished each year based on Dana’s priorities for that year)
- Commercial (25 percent)
- Supplier’s commitment to meeting Dana’s productivity (cost-reduction) goals
Like Metalcraft, Dana provides each supplier with Web-based access to its SBS score and uses the score to motivate continuous improvement from its supplier base.
Rolls Royce’s supplier scorecard also uses traditional quality and delivery metrics. In November 2003, the company added a cost metric—the cost of nonquality—to measure its prevention, appraisal, and failure costs associated with a supplier’s products. Federal Mogul includes, in addition to delivery and quality metrics, a measure of supplier cost-saving suggestions. The full score (100 points) is awarded for suggestions that enable a 5 percent savings in projected annual spending. Zero points are awarded for suggestions that aggregate less than 0.9 percent of annual spending.
These examples indicate that supplier scorecards are being used by many manufacturing companies. But these are not truly Balanced Scorecards. The supplier scorecards are actually key performance indicator (KPI) scorecards, where the company uses nonfinancial measures to motivate suppliers to deliver products better (zero defects), faster (short lead times and just-in-time), and cheaper. At best, one can interpret these supplier scorecards as consistent with a company following a low-total-cost strategy. The scorecards do not stress supplier innovation—helping the company develop entirely new product platforms—nor do they measure how suppliers help provide more complete solutions to customers.
Even with a low-total-cost strategy, a more complete supplier Balanced Scorecard would include objectives for development of human capital and information capital by the supplier that would enhance the relationship, as well as metrics relating to how well the supplier was innovating and partnering with the company to provide value even beyond delivering existing or already designed products with zero defects, on time.
Of course, for companies like Metalcraft, Dana, or Rolls Royce, developing such a customized supplier Balanced Scorecard for each of its thousands of suppliers is unrealistic. Such an effort should be made only for strategic suppliers—those with which the company wants a long-term relationship and those to which it looks as a continuing source of new ideas and new processes for revenue growth and cost improvement.
Collaborative Planning, Forecasting, and Replenishment Scorecards
Somewhat more highly developed supply-chain scorecards are being created in the consumer packaged-goods supply and retailing industry. Manufacturers, such as Procter & Gamble, Nestlé, and Kellogg, are working with large retailers, such as Wal-Mart, Sainsbury, and Tesco, to optimize the supply chain from manufacturer to consumer.
The Collaborative Planning, Forecasting, and Replenishment (CPFR) initiative (see www.cpfr.org) strives to link best sales and marketing practices in category management with supply-chain planning and execution; the aim is to increase availability of products while reducing inventory, transportation, and logistics costs. For example, Procter & Gamble’s CPFR goal is to achieve 100 percent product availability on retail shore shelves while simultaneously reducing inventory requirements in retail stores, customer distribution centers, and P&G plants. P&G wants to produce and ship in response to a consumer demand signal from a retail point-of-sale terminal.
CPFR involves extensive coordination of processes between supplier and retailer. Creating a scorecard for performance is one of the central features of the initiative. For example, early adopters of CPFR initiatives hope for the following benefits:
- Improved forecast accuracy
- Improved internal communications
- Increased sales
- Improved relationships with channel partners
- Improved service levels
- Reduced out-of-stock conditions
- Decreased inventory
- Better asset utilization
- Better deployment of organization resources
Each of these is measurable and could serve as a component in a comprehensive CPFR scorecard for a manufacturer-retailer trading relationship.
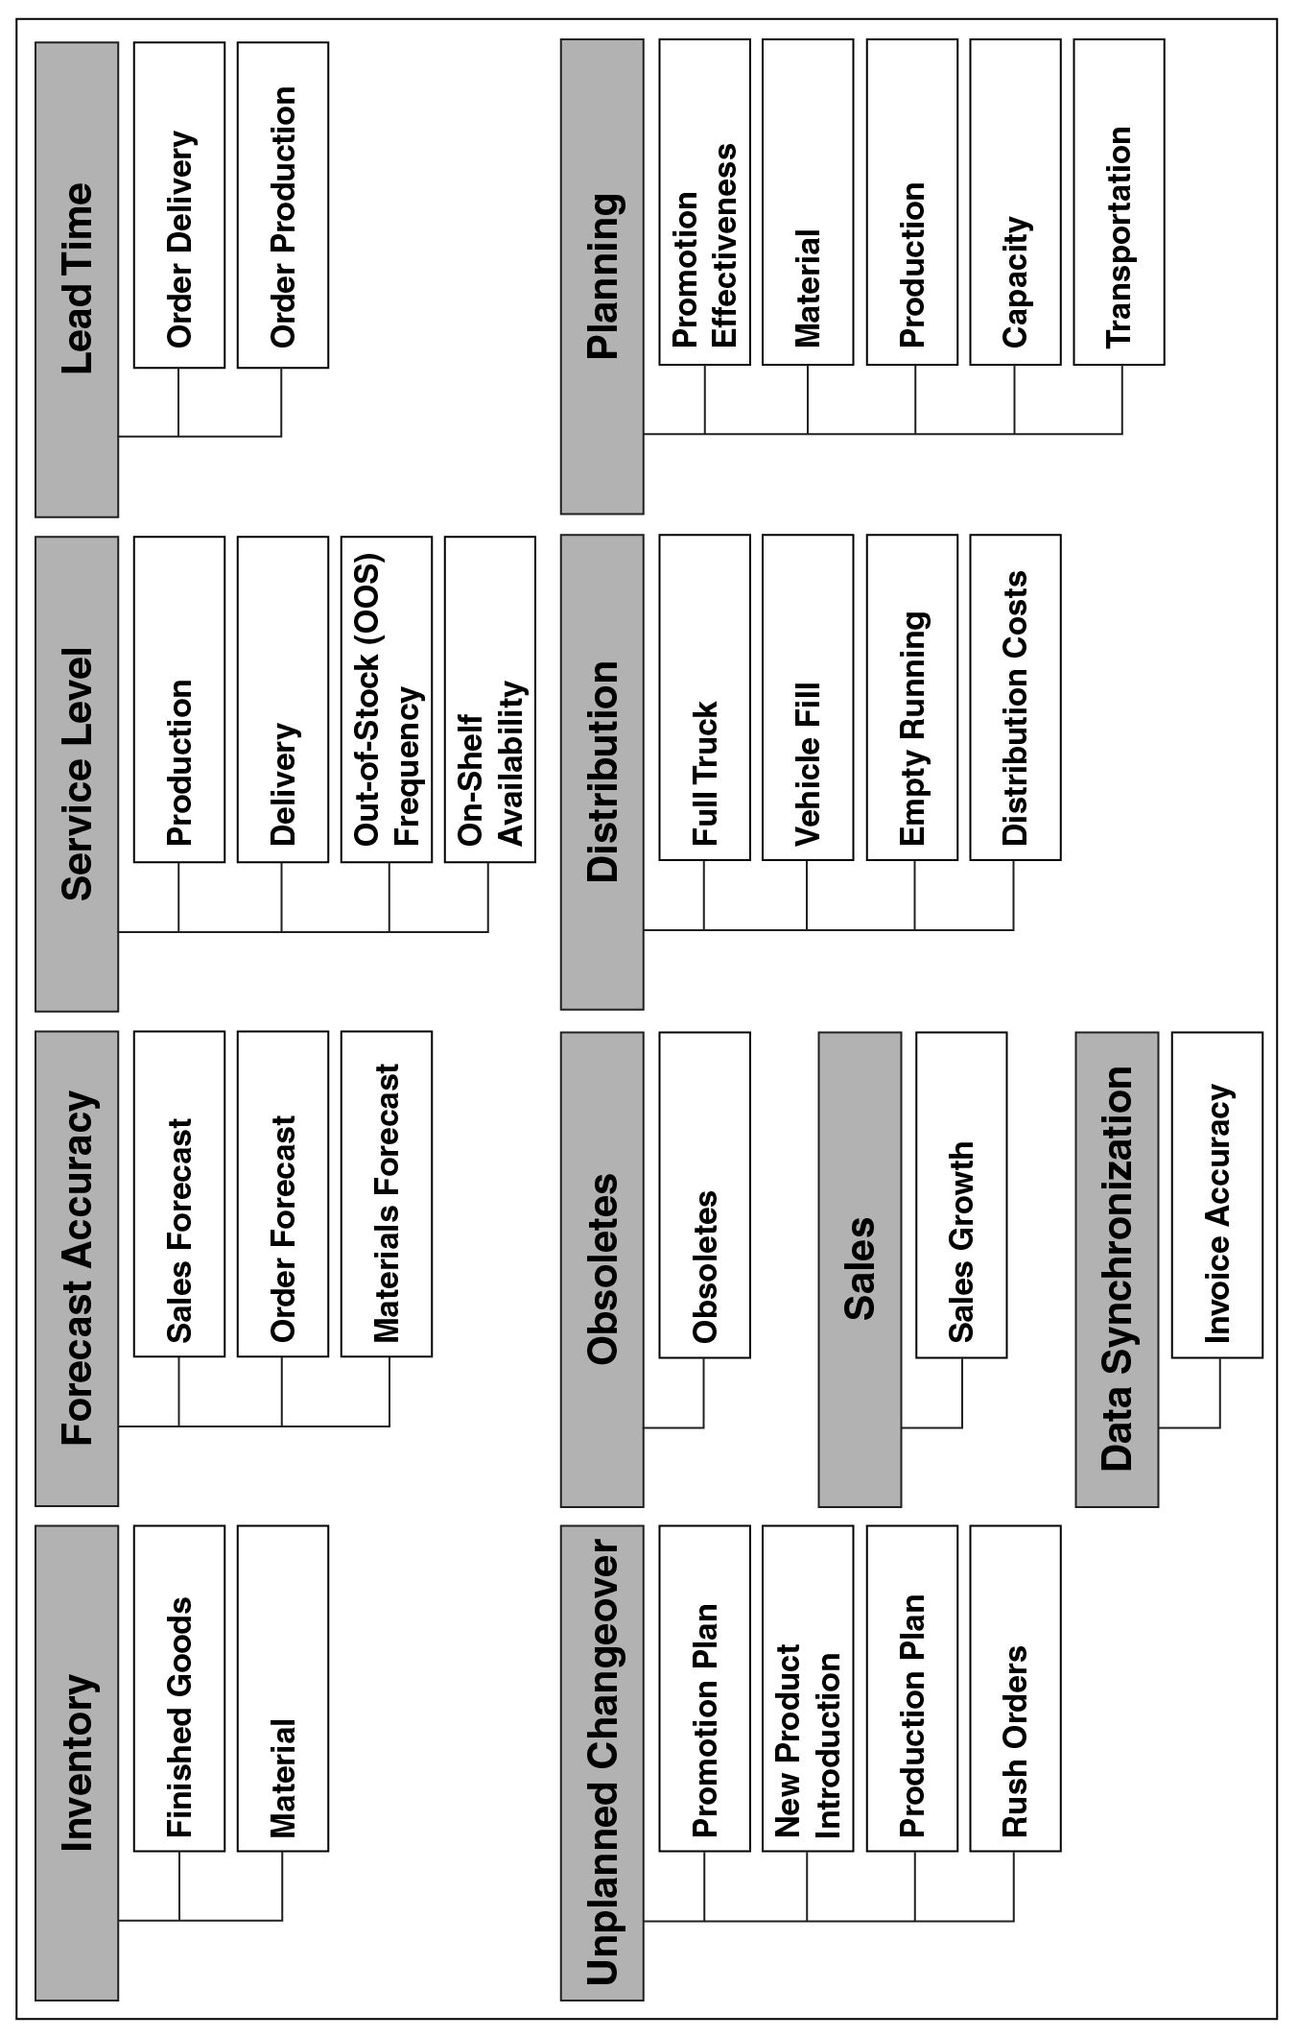
The CPFR effort is perhaps farthest along in Europe, where the program office prepared the template in Figure 8-1 to identify a menu of key performance indicators to describe a particular CPFR relationship.2
Procter & Gamble in its CPFR pilots has introduced metrics for nine elements in its supply-chain relationships:
- Forecast accuracy versus actual orders
- Distribution center service level and inventory
- Retail in-stock service level and inventory
- Manufacturer order fill rate versus original order
- Manufacturer order fill rate versus advance ship notice (ASN)
- Delivery punctuality
- Transportation efficiency
Figure 8-1 Key Performance Indications foc CPFR
- Shipment variability by SKU (stock-keeping unit)
- Profitability or cost reduction
Sainsbury, a U.K. retailer, has been a major force in the Global Commerce Initiative to make the CPFR principles operational.3 Sainsbury’s relationship with a manufacturer starts with an entry-level global scorecard that measures performance on fifty-two self-reported questions in three sections: readiness, consumer focus, and operations.
The readiness section includes questions about the supplier’s ability to share insights, to make business decisions, to work in collaborative, multifunctional teams, and to provide and receive feedback with the retailer. The consumer focus section includes questions about the supplier’s capacity to support retailer promotions, to introduce new products based on consumer research, and to have a clear understanding of the targeted consumer of the supplier’s products. Questions in the operations section explore the manufacturer’s capacity to develop a joint supply-chain strategy; its processes for order generation and receipt and electronic ordering and funds transfer; and its replenishment and surge capability. The responses to these entry-level scorecard questions let both parties identify opportunities for reduction in delivery lead times, improved forecast accuracy, mutual reduction in inventory levels, and faster new product launches.
For advanced suppliers, Sainsbury uses an intermediate-level scorecard that measures performance through responses to ninety-five questions organized into three major sections:
- Demand
- Demand strategy and capabilities
- Assortment
- Promotions
- New product introductions
- Consumer value creation
- Supply management
- Supply strategy and capabilities
- Responsive replenishment
- Operational excellence
- Integrated demand-driven supply
- Enablers
- Common data and communication standards
- Cost, profit, and value measurements
- Product safety and quality processes
Here are examples of the questions:
• Is there a detailed analysis of the costs in the total supply chain?
• Is in-store implementation of new product launches actively monitored?
• Are there agreed procedures in place to rectify delivery issues?
Manufacturer responses are chosen from among the following:
- No/never
- Limited
- Progressing
- Yes/always
The supply-chain scorecards being developed through the CPFR and ECR initiatives are more general than the ones we described being used in the automotive transportation equipment industry. They record a supplier’s ability to introduce new products rapidly and its capacity for enhanced coordination, such as joint promotions, with the retailer. They also include a learning and growth component that identifies employees having specific responsibilities and capabilities to work in joint project teams; the alignment of information systems for ordering, invoicing, and payment between the two companies; and the sharing of end-use consumer data. Building scorecards to enhance the evolving collaborative relationships in the food and packaged-goods supply chain is a leading example of what is possible in many other supply-chain situations.
A SUPPLY-CHAIN BALANCED SCORECARD
Brewer and Speh propose a more general framework for supply-chain scorecards.4 They emphasize that one size should not fit all. The supply chain that’s designed to reduce the cost of production, delivery, and merchandising of standard commodity products with predictable demand has very different objectives than the supply chain for companies in the unpredictable marketplace of fashion apparel. One stresses low cost and rapid inventory turns; the other requires flexibility, quick response, forecast accuracy, and innovation.
When a supply-chain Balanced Scorecard is constructed, then, the process starts with clearly articulating the supply-chain strategy. This should be a multifunctional, multiorganizational project and, as with any effective scorecard project, should provide an opportunity for individuals in diverse functions and organizations to collaborate to define common, shared objectives. Once the team members agree to the strategy, they can start building the scorecard for the strategy.
The Financial Perspective
The financial measures for a supply-chain scorecard are traditional and generic. A well-functioning supply chain should lead to higher profit margins, reduced unit costs, increased cash flow, growth of revenues, and high return on invested capital for all supply-chain participants. The scorecard can feature specific supply-chain measures, such as the costs of transportation, order processing, order receipt, warehousing, merchandising, obsolescence, and markdowns.
The emphasis placed on specific financial measures depends on the strategy. For the production and distribution of mature products, the dominant measures will be cash flow, unit costs, and return on assets. For differentiation strategies, the measures of revenue growth, increased margins, and reduced obsolescence and markdowns will play a more important role.
The Customer Perspective
The customer perspective should reflect customers within the supply chain as well as the end-use consumer. Benefits to all these customers should include improved quality of products and services, shorter lead times, improved availability (including reduced stock-outs and late deliveries), greater flexibility, and higher value.
The Internal Process Perspective
Improved processes throughout the supply chain should result in the following benefits:
- Reduced waste: This includes elimination or reduction of duplicative processes; harmonization of systems and processes; reduced defects, rejects, returns, and rework; and lower inventory levels.
- Reduced order-to-delivery cycle times and shorter cash-to-cash cycles for all supply-chain participants.
- Flexible response: This means the ability to meet a customer’s unique requirements for product variety, volume, packaging, shipping arrangement, and delivery.
- Reduced unit costs relative to the degree of customization and flexibility expected by the customer: Suppliers attempt to drive out non-value-added costs by eliminating duplication of inventories, multiple handling of product, unconsolidated shipments, and uncoordinated promotions and deals.
- Innovation: Participants monitor new developments in technology, competition, and consumer preferences so as to jointly design and develop new offerings that will continually earn the loyalty of targeted customers.
The Learning and Growth Perspective
Human capital objectives include employees in procurement, operations, marketing, sales, logistics, and finance having the skills and knowledge to collaborate intra- and interorganizationally to enhance supply-chain performance and deliver more value to customers and end-use consumers. Information capital objectives relate to harmonization and linkages of systems across organizational boundaries, standardization of data protocols, sharing and analysis of customer and supplier information, and provision of information that is relevant, accurate, timely, and accessible. The organization culture should support best-practice sharing, continuous improvement, openness and transparency across all supply-chain partners, and a deep commitment to eliminating waste and delay throughout the system while delivering maximum value to end-use consumers.
As a specific application, consider the supply-chain Balanced Scorecard developed for a joint project between a large international producer of chemicals and a strategic partner, ChemTrade, one of its leading distributors. 5 The strategic partnership consisted of a long-term contract with exclusivity for both parties in several national regions. Each company participated in a project to improve all processes, from raw materials acquisition through delivery to the final consumer.
The project team decided to build a Balanced Scorecard to measure the success of the collaboration, to clarify the strategic objectives of the supply-chain partners, to provide a focus on critical performance measures in both organizations, and to identify opportunities for future improvement. We show its Strategy Map (see Figure 8-2) and Balanced Scorecard (see Figure 8-3) of objectives and measures. (At the time of the report, measures for the development [learning and growth] perspective had not yet been determined.)
Figure 8-2 Strategy Map, Chemicals Supply Chain
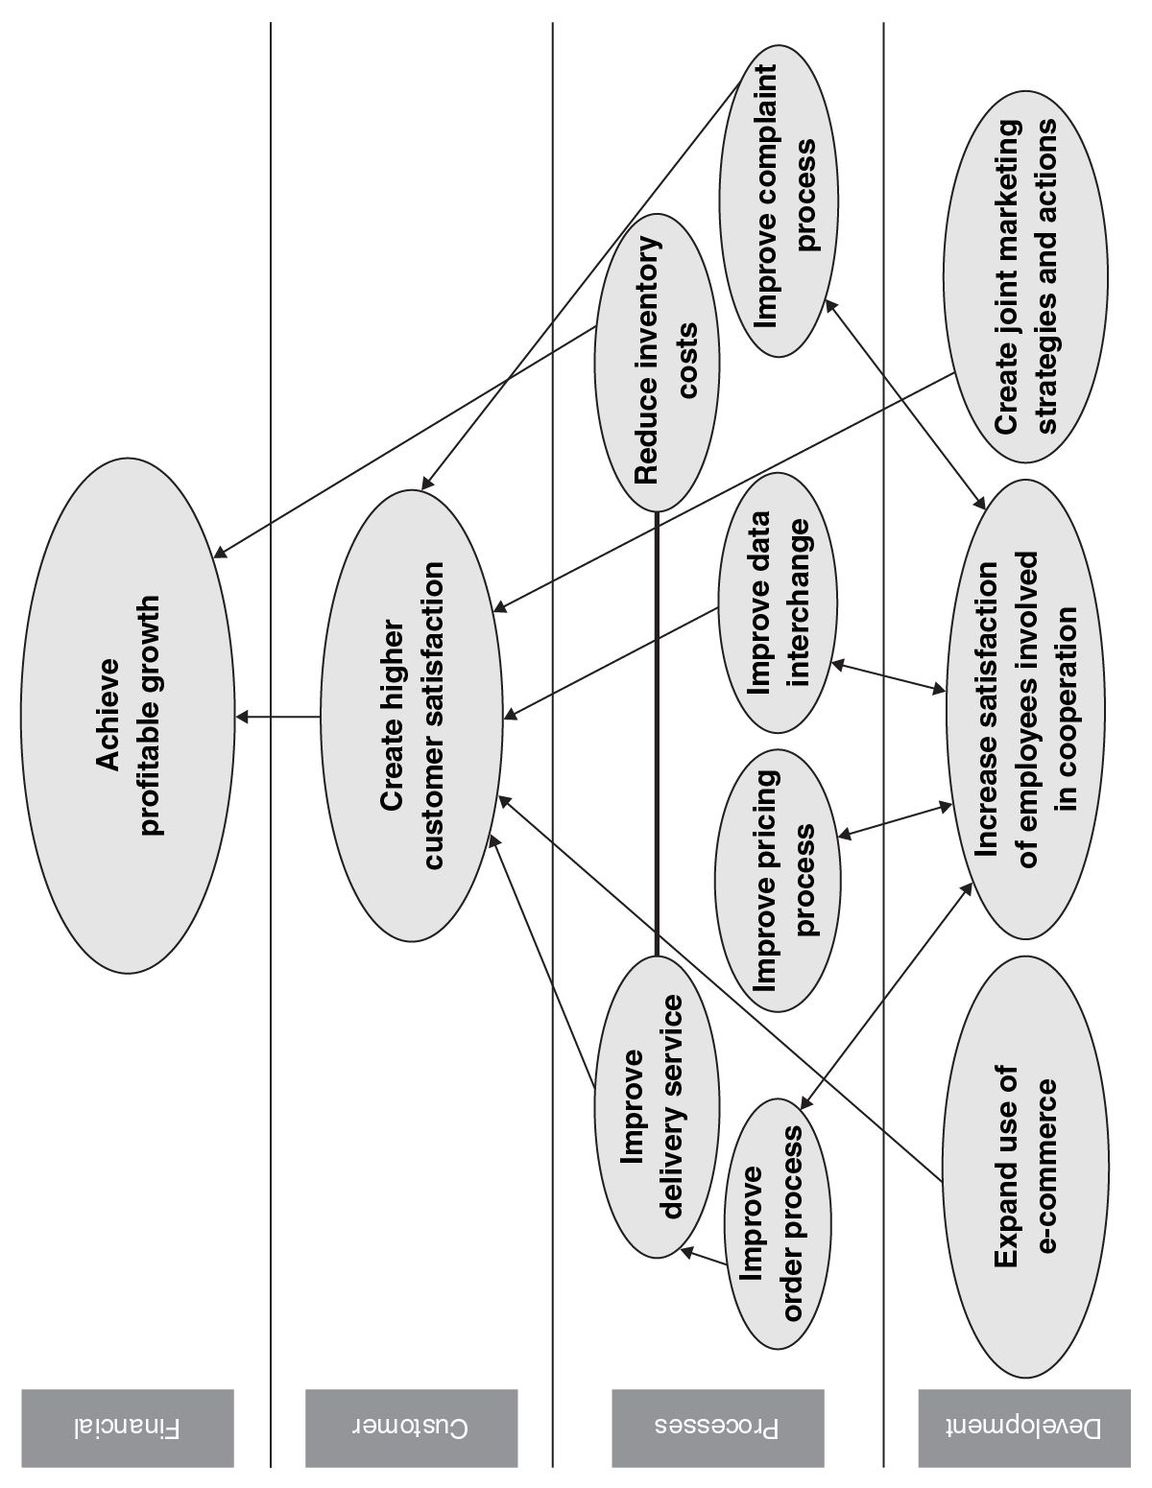
Source : K. Zimmenrman, "Using the balanced Scorecard for Interorganizational Performance Management of Supply Chains. a case Study," in Cost Management in Supply Chains (Heidelberg) : Physica-Verlag, 2002).
Figure 8-3 Supply-Chain Balanced Scorecard

In summary, supplier scorecards are common in manufacturing and retailing industries. Most of the existing supplier scorecards feature metrics for a low-total-cost strategy of cost reduction, on-time delivery, and consistent, zero-defect quality. These are fine if that is the end customer’s strategy, but even for this strategy, KPI scorecards miss opportunities to align suppliers’ processes and their human and information capital to enhance supply-chain performance. Additional opportunities exist for constructing more strategy-specific supplier Balanced Scorecards when a company looks to its supplier base for product innovation and to help it provide more complete solutions to its customers.
CUSTOMER SCORECARDS
Supplier and supply-chain scorecards generally look upstream from the company to its most important suppliers. As the company faces the other way, forward and downstream, it sees its strategic customers. The Rockwater Company, the undersea installation division of Brown & Root, provided us with an early example of constructing a scorecard with strategic customers.
Rockwater’s new strategy was to nurture long-term, value-adding relationships with its key customers. This strategy was a radical departure from the construction industry norm, where business was almost always awarded to the lowest bidder. Rockwater had identified several of its leading customers that were looking to partner with their suppliers to find innovative ways to lower the total cost of constructing, installing, and operating oil and gas production facilities.
For each customer that expressed an interest in such long-term partnering relationships, Rockwater discussed a list of sixteen attributes that would characterize the working relationship on a project:
| Functionality | Safety |
| Engineering services | |
| Quality | Minimum revision of submitted procedures |
| Quality and awareness of performance | |
| Standard equipment provided | |
| Quality of personnel supplied | |
| Production quality | |
| Price | Hours worked |
| Value for money | |
| Innovation to reduce cost | |
| Timeliness | Meeting schedule |
| Timely submission of procedures | |
| Relationship | Transparency of contracting relationship |
| Flexibility | |
| Responsiveness | |
| Team rapport and spirit |
Rockwater asked each customer to select which of these attributes would be most important on the project and then to apply a relative weighting scheme for the most important attributes. Rockwater shared this information with every member of its project team so that all of them knew the factors most important to the customer on this project.
Monthly, each key customer scored Rockwater’s performance on the selected attributes. These customer performance scores provided the basis for the monthly meeting between contractor and customer to discuss project performance. Rockwater also aggregated these individual project scores into an overall customer satisfaction index for its own scorecard. This mechanism of constructing a customer- and project-specific index enabled Rockwater to customize its offering to individual customer preferences, to align its project team to deliver the customer’s specific value proposition, and to receive feedback on how well it was meeting its customers’ expectations.
Tiger Textiles (a disguised name) is the production intermediary between U.S. and European retail apparel chains (such as Gap and The Limited) and low-cost textile factories. Tiger does research to learn about its customers’ future apparel manufacturing needs, advises them on fashion trends and new product opportunities, and contracts with factories in low-cost developing nations, such as Sri Lanka, Thailand, and Malaysia, to produce and deliver the desired volume, mix, and quality of clothing in a timely manner.
Tiger, like Rockwater, wanted to be more than a low-cost, reliable supplier of standard products. It wanted to differentiate itself by leveraging its knowledge and capabilities to offer customers more complete solutions. Tiger’s strategy incorporated an important “business planning with customer” theme (see Figures 8-4 and 8-5): “Tiger Textiles must have a clear understanding of customers’ long- and short-term needs and values in order to jointly develop business plans. Customer-focused planning requires including the customer in our global teams.”
Tiger, in its customer perspective, set an objective to deliver high customer intimacy and service and to be recognized by its customers as a source of creativity and fashion ideas. To deliver on this objective, Tiger established an internal process objective: “develop relationships with key customers.” It measured performance for this objective by the following:
- The number of (Tiger’s) overseas associates that the customer knew.
- Associate turnover. (Tiger wanted associates that could develop long-term relationships with its key customers.)
- Achievement of goals in business plans developed with customers.
Figure 8-4 Tiger Textiles: "Business Planning with Customer" Theme (Strategy Map)
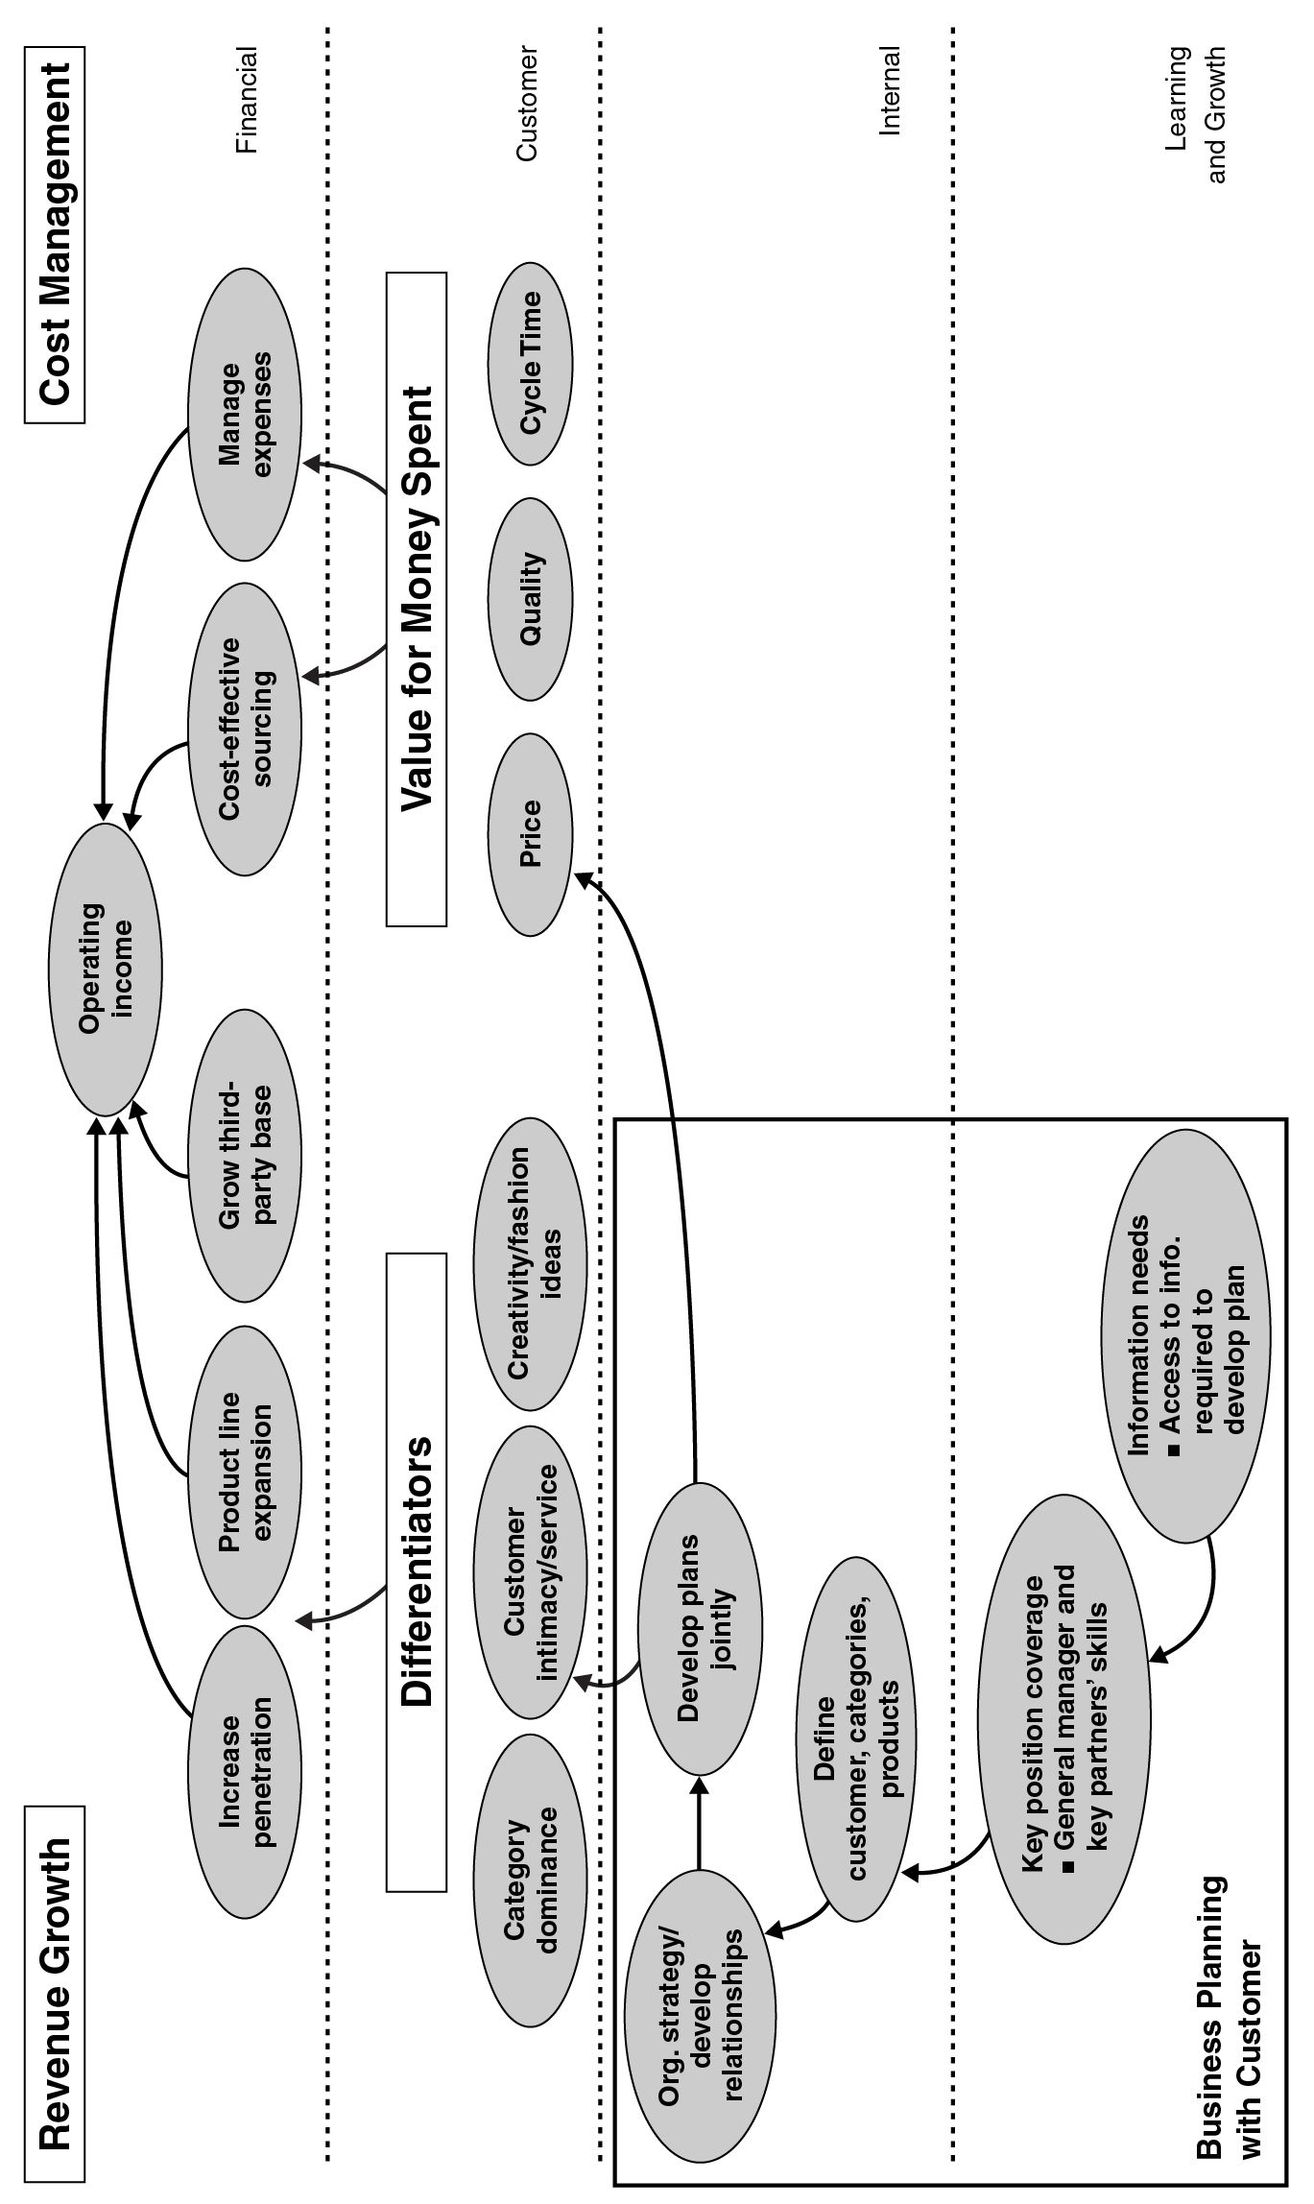
Figure 8-5 Tiger: Textiles: "Business Planning with Customer" Theme (Balaced Scorecard)
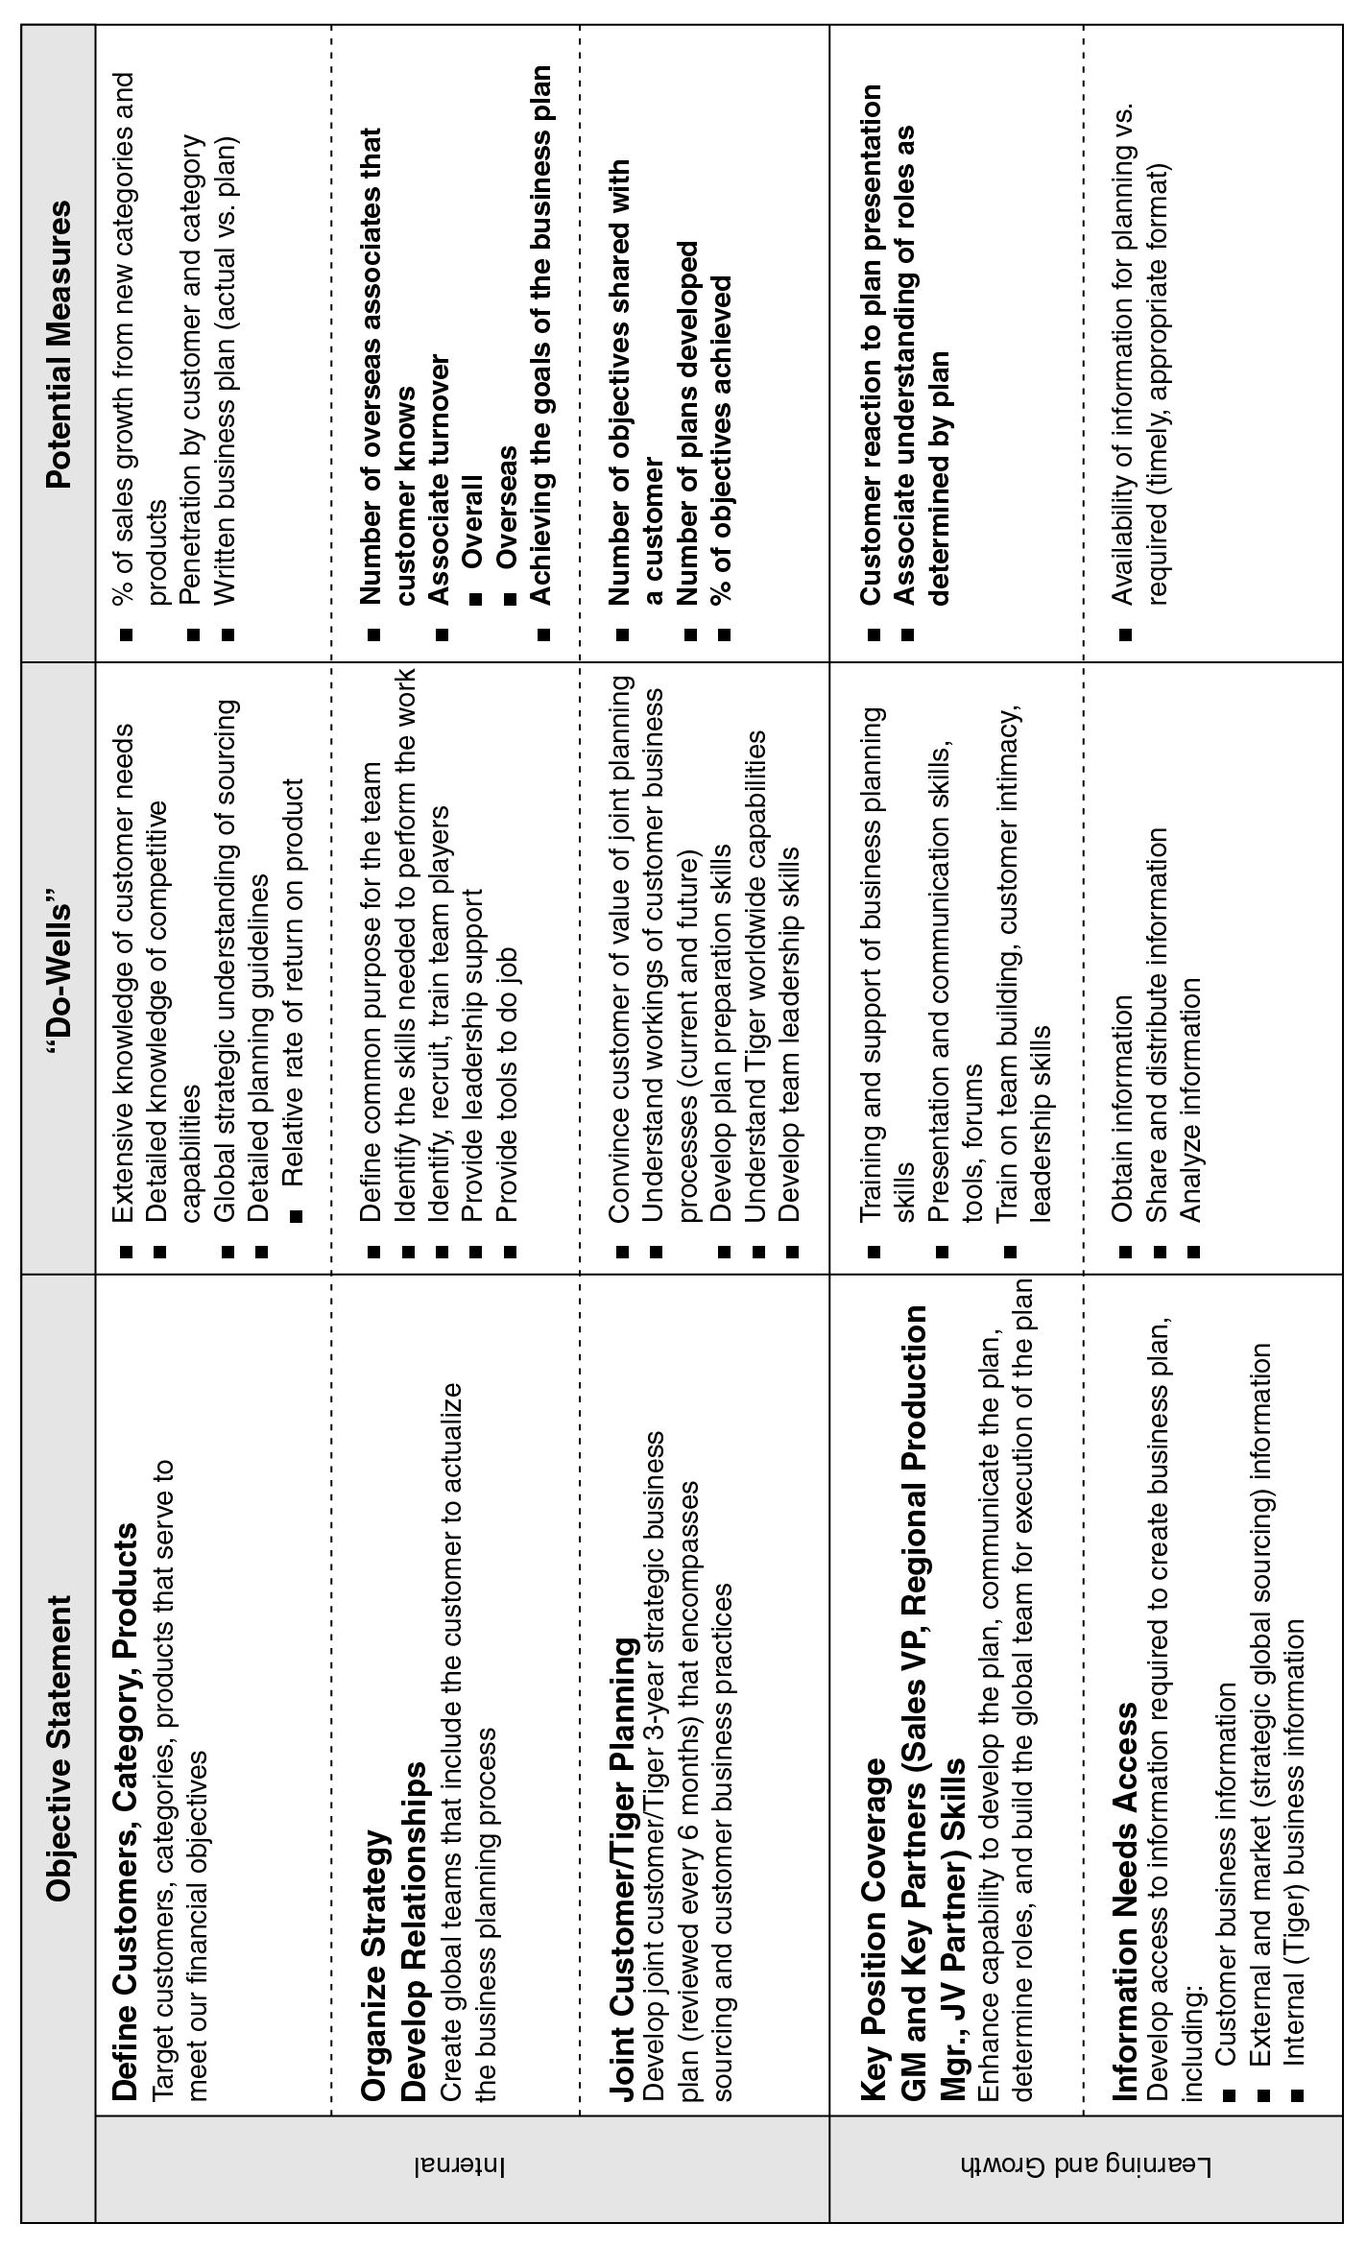
Another key internal process was “joint customer/Tiger planning,” with an objective to “develop joint customer/Tiger three-year strategic business plans, reviewed every six months, that encompass sourcing and customer business practices.” Tiger measured this objective by the following:
- The number of objectives shared with a customer
- The number of joint business plans developed
- The percentage of objectives achieved
For these two critical internal processes to be implemented effectively, Tiger needed to enhance the skills and capabilities of its associates (employees) who dealt directly with customers. It set a learning and growth objective of strategic job coverage: general managers, sales vice presidents, regional production managers, and joint venture relationship managers had to have the skills to work collaboratively with key customers, including developing the joint business plan, communicating the plan, and building the global team for executing the plan. Tiger measured this objective by the following:
- Customer reaction to presentation of joint business plan
- Associates’ understanding of their roles in the joint business plan
In this way, Tiger Textile’s scorecard highlighted the objectives in the customer, internal, and learning and growth perspectives that would enable it to grow its business at higher margins by forging long-term, value-adding relationships with its key customers. These customers would supply many of the measures, within this customer intimacy theme, to Tiger.
ALLIANCE SCORECARDS
Increasingly, companies are using alliances to fill gaps in their own capabilities and to grow in new markets and regions. Coordination with alliance partners is not easy; many alliance ventures end in disappointment and failure.
Having a common set of measures from alliance partners is not a natural act. Each party has its own reporting process and measures, and each brings its own perspective of what it wants to contribute to the alliance (probably as little as possible) and what it hopes to gain from the alliance (as much as it can). Transcending these informational and motivational asymmetries, as economists would phrase it, requires an open, transparent process in which both sides clearly articulate their expected contributions and their desired outcomes, resulting in a document that summarizes the theory of the strategic case for the alliance.
Developing an alliance Balanced Scorecard can mitigate the natural conflict between alliance partners. The process of building the alliance Strategy Map and scorecard brings together senior decision makers from both partners to articulate clearly the objectives of the alliance and the strategy for achieving those objectives.
For example, a sales and marketing alliance might highlight the reduced cost of acquiring new customers, the reduced lead time to bring new products to market, and the sales increases resulting from acquiring new customers and leveraging existing customer relationships. A research and development alliance might focus on the quantity and innovativeness of newly developed products, lead times of the alliance’s complete “ideato-product development” cycle, and the incidence and impact of technology transfer to the parent companies. A manufacturing alliance might feature achievements in reducing production costs, improving quality, shortening the time from customer order until delivery, and increasing the reliability of delivery times.6
The finished product—a Strategy Map, a Balanced Scorecard of measures and targets, and agreed-upon, funded initiatives—provides a clear road map for the CEO of the alliance, as well as an excellent basis for governance of the venture by the two parent organizations. Yet a McKinsey study reported that fewer than one-fourth of alliances have adequate performance metrics, and this is by McKinsey’s definition of “adequate,” which may fall quite a bit short of a comprehensive Balanced Scorecard of measures derived from a Strategy Map of linked strategic objectives.7
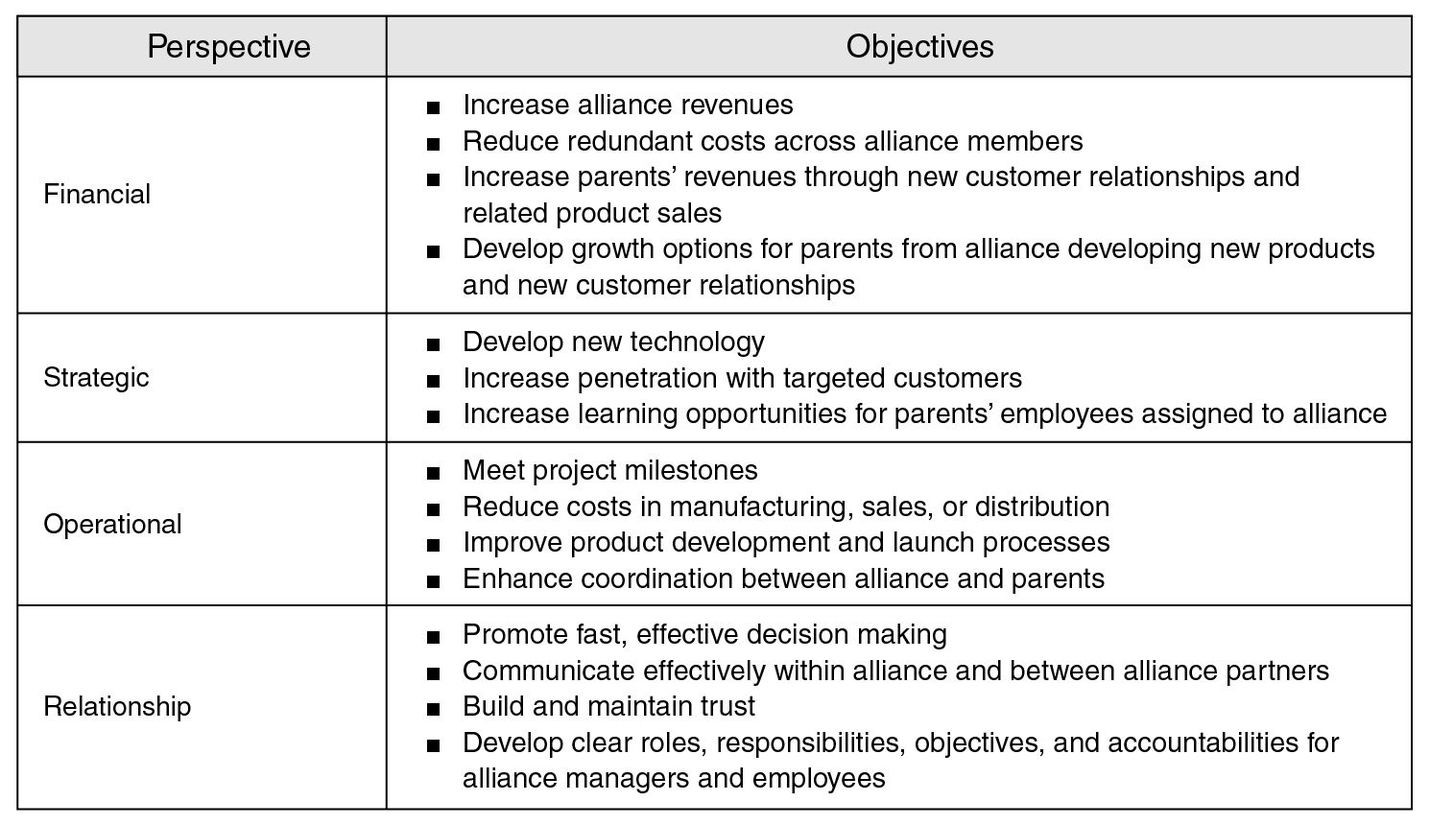
The McKinsey study proposed an alliance Balanced Scorecard with four perspectives: financial, strategic (instead of “customer”), operational, and relationship (instead of “learning and growth”). Figure 8-6 illustrates some key objectives that might be included in such an alliance scorecard.
MERGER INTEGRATION
Of course, the closest integration between two external parties occurs when they merge to become a single entity. Many mergers fail, however, because the new company cannot integrate two management teams, two cultures, two strategies, two information systems, and two distinct sets of management processes into a single operating entity that can reap the hoped-for synergy benefits. But we have seen several mergers succeed when managers created a Balanced Scorecard to integrate the two companies.
Figure 8-6 Prototype Alliance Strategic Objectives
Using the scorecard in this way produces two important benefits. First, developing a Strategy Map and Balanced Scorecard for the new company provides a mechanism by which managers from the two previously independent entities have an opportunity to work together toward a common objective. The intense dialogue and debates about strategy, strategic objectives, and measurements enable managers to learn how their counterparts think, whose opinions they value, and whom they can trust. The opportunities for new friendships and collaborative working relationships emerge organically from the executives’ participation in the intensive process to build a Strategy Map and BSC.
The second benefit is that the finished Strategy Map and Balanced Scorecard provide a language executives can use to describe how to capture the intended synergies from the merger. Extensive research shows that most mergers are unsuccessful; the acquiring companies do not earn a competitive return on the amount they spent for the merger. Although some cost savings are realized from consolidation of facilities and administrative staff, in practice it has proven difficult to generate new growth opportunities from the combined organizations. For example, a McKinsey study revealed the following gloomy statistics about mergers in the 1990s:8
- Only 11 percent of 193 mergers during 1990–1997 experienced positive earnings growth three quarters after the merger; the typical merger experienced a 12 percent decline in earnings.
- Only 12 percent of acquisitions, 1995–1996, had accelerated earnings growth in the next three years; 42 percent of these had an earnings decline. The median among these mergers was a growth rate four percentage points lower than that of industry peers.
- The primary reasons for the earnings declines were dissatisfied customers and distracted employees.
The principal reason for the poor post-merger performance was an excessive concentration on achieving cost savings and insufficient attention to growing revenues. The few merged companies that succeeded focused on leveraging existing customer relationships for increased revenue, especially by retaining key revenue-generating employees.
These findings provide the rationale for a merged company to develop a Strategy Map and Balanced Scorecard as part of the merger integration process. Managers from the two previously independent companies formulate a specific strategy for leveraging the strengths of each company to create new revenue opportunities beyond what either company could have achieved operating independently. The process also produces a road map for implementing the revenue growth, as well as cost reduction; strategic themes through investment in key processes, employees, and information technology; and a unified corporate culture.
A good example of this process occurred with the merger of two oil companies: Alpha and Beta (disguised names). This merger formed one of the largest marketing and refining companies in the United States. The initial integration of the executive team occurred when the managers built a Balanced Scorecard for the new entity; the first meeting occurred even before the official closure of the deal. Each company had an equal number of representatives on the BSC executive team.
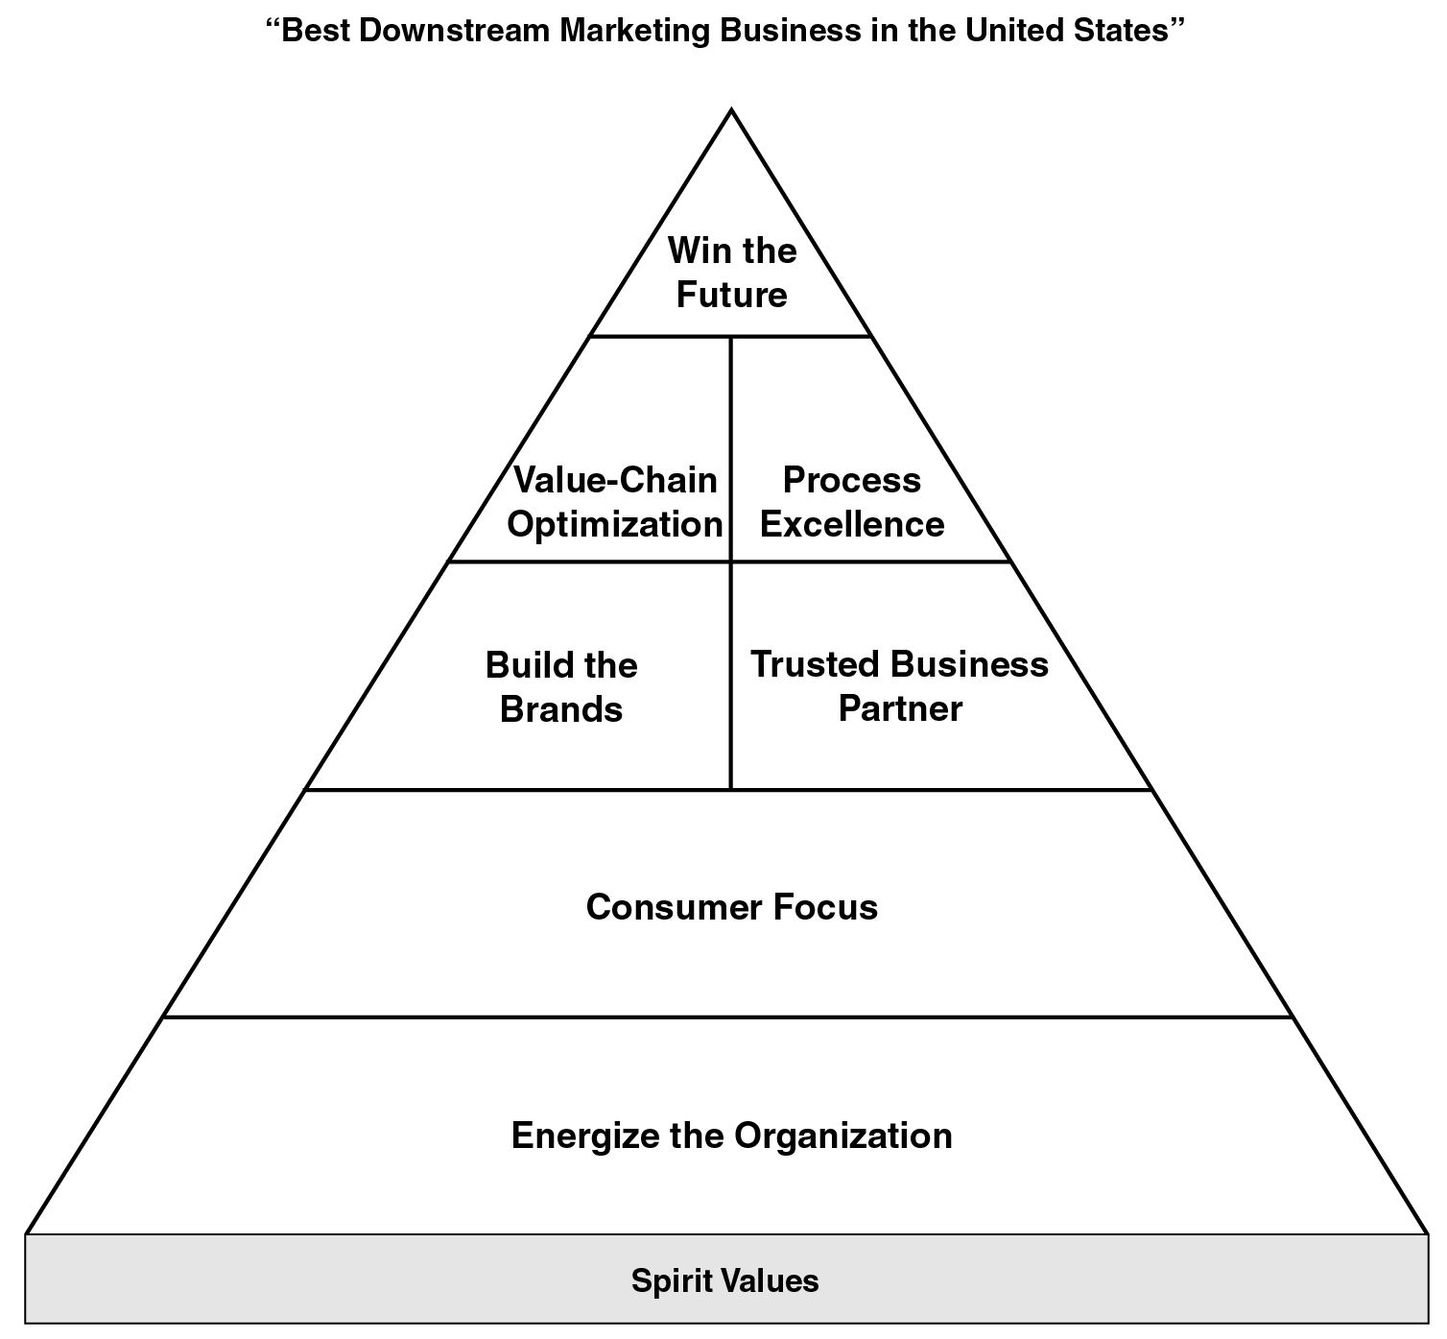
The BSC team built its scorecard on a pyramid (see Figure 8-7) to represent how Alpha-Beta Petroleum would become the best downstream marketing business in the United States. Its scorecard was built on six themes (similar to the DuPont Engineering Polymers theme-based scorecard described in Chapter 4):
- Consumer focus
- Build the brand(s)
- Trusted business partner
- Value-chain optimization
- Operational excellence
- Energize the organization
Figure 8-7 Alpha-Beta Integration Strategy
The BSC team selected one Alpha and one Beta executive as coowners of each theme. Each pair oversaw the targets, initiatives, communication, and implementation of its theme.
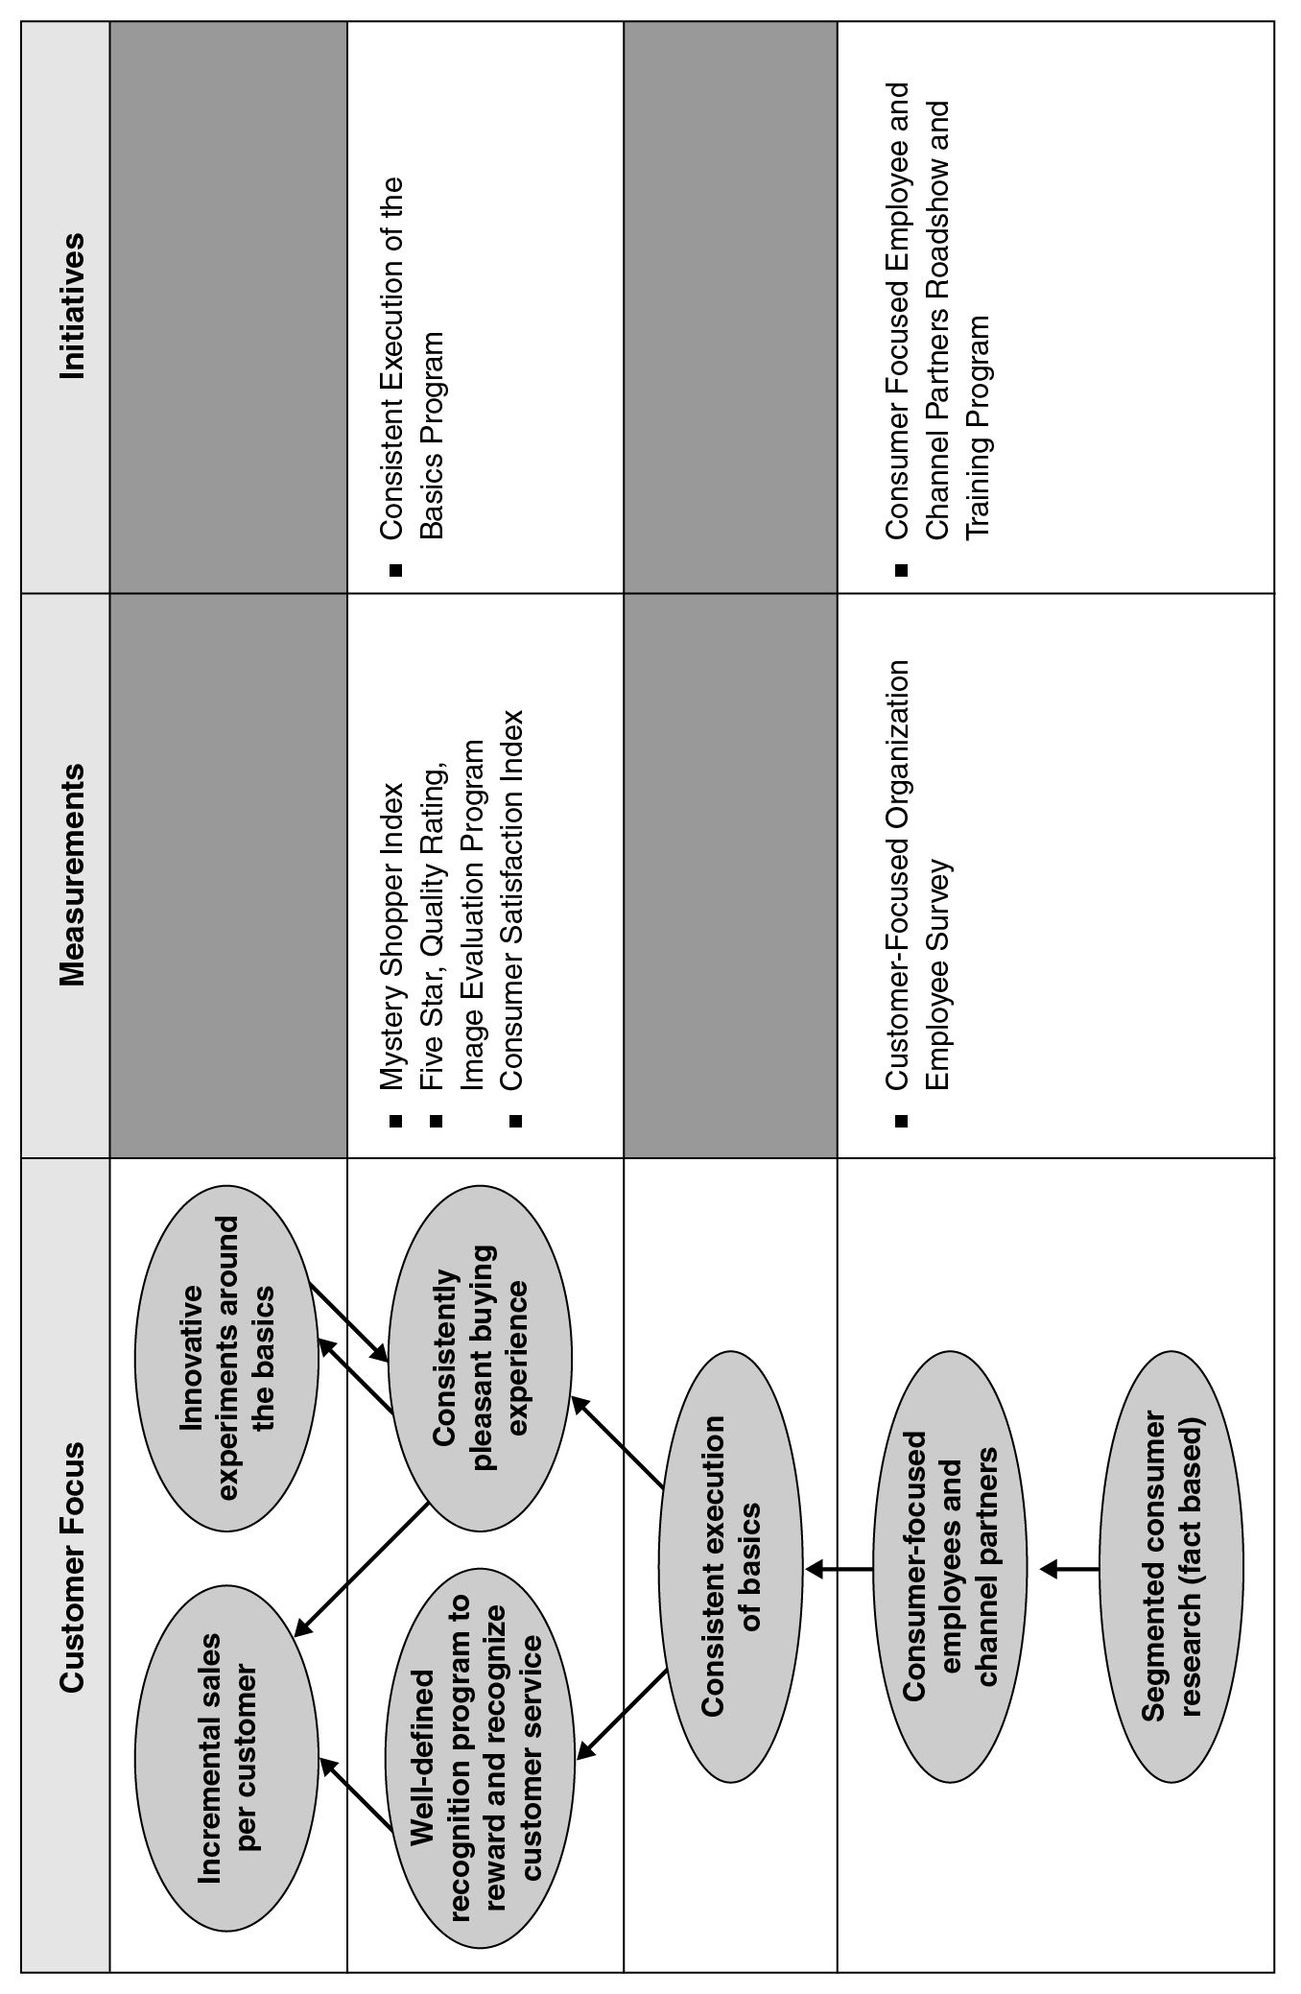
For each of the six themes, the BSC team selected four to eight strategic key issues and then developed objectives, a Strategy Map, measures, and targets for the theme. For example, Figure 8-8 illustrates a summary of theme 1, consumer focus; Figure 8-9 shows the Strategy Map, scorecard measures, and initiatives developed for this theme.
Alpha-Beta Petroleum used the strategic themes and measures as key elements of its Day One communication, both internally and externally, upon official consummation of the merger. During the next five months it cascaded the scorecard throughout the organization so that local scorecards could be used to set departmental and personal objectives in the new company’s performance management system. The process enabled Alpha-Beta to operate as one company, with a coherent, integrated strategy, right from its beginning as a new legal entity.
SUMMARY
Once organizations have aligned internal business and support groups, they can extend their strategic alignment by creating Strategy Maps and Balanced Scorecards with key external partners, including suppliers, customers, and alliances. At present, most supplier, customer, and alliance scorecards tend to be collections of key performance indicators intended to drive improvement in the operational performance metrics of cost, quality, and timeliness.
Figure 8-8 Summary of “Consumer Focus” Theme at Alpha-Beta
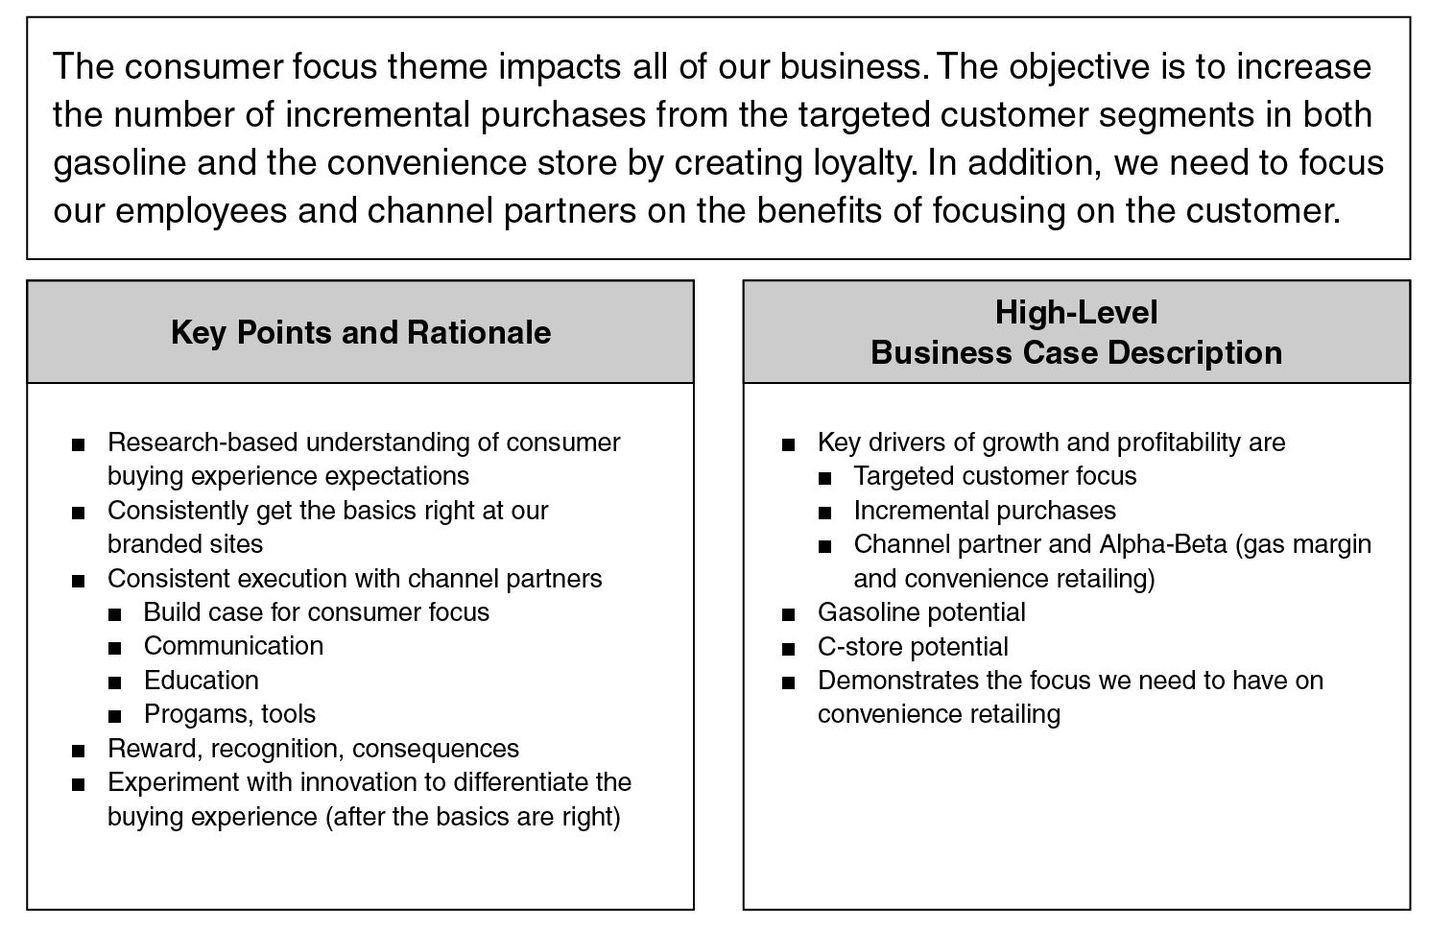
Figure 8-9 Partial Strategy Map for "Consumer Focus" Theme at Alpha-Beta
The opportunity remains for companies to forge deeper and more effective relationships with their external partners through an intense collaborative process focused on producing a Strategy Map and Balanced Scorecard that describes the objectives and strategy of the interorganizational relationship. Such a process builds great consensus and motivation for the relationship, and the jointly developed scorecard serves as the accountability contract for relationship performance.
NOTES
S. Kulp and V. G. Narayanan, “Metalcraft Supplier Scorecard,” Case 9-102-047 (Boston: Harvard Business School Publishing, 2005).
The detailed definitions of each of the measurements, along with a numerical example of a calculation and the respective responsibilities of suppliers, manufacturers, and retailers, can be found at http://www.cpfr.org/documents/pdf/CPFR_Tab_6.pdf.
P. C. Brewer and T. W. Speh, “Using the Balanced Scorecard to Measure Supply Chain Performance,” Journal of Business Logistics (2000): 75–93; and “Adapting the Balanced Scorecard to Supply Chain Management,” Supply Chain Management Review (March–April 2001).
K. Zimmerman, “Using the Balanced Scorecard for Interorganizational Performance Management of Supply Chains: A Case Study,” in Cost Management in Supply Chains, eds. S. Seuring and M. Goldbach (Heidelberg: Physica-Verlag, 2002), 399–415.
See L. Segil, Measuring the Value of Partnering (New York: AMACOM, 2004), 19.
J. Bamford and D. Ernst, “Managing an Alliance Portfolio,” McKinsey Quarterly (Autumn 2002): 6–10.
“Why Mergers Fail,” McKinsey Quarterly (2001): 64–73.