CHAPTER SIX
CASCADING THE PROCESS
PREVIOUS CHAPTERS ARTICULATE theory and discuss examples of how to align business and support units with a corporate strategy. Corporations follow different paths to achieve enterprise-wide alignment. Some start at the top, at the corporate level, and then cascade sequentially down the organizational hierarchy. Others start in the middle, at the business unit level, before building a corporate scorecard and map. Some launch an enterprise-wide initiative right at the start, and others conduct a pilot test at one or two business units before extending the scope to other enterprise units.
In our experience, there is not a single correct answer. We have seen multiple approaches used, each of which ended up with a successful implementation. In this chapter we describe the principles we have learned about the cascading process and illustrate it with examples from successful adopters.
We start with two simple and polar examples: franchise operations, for which the decentralized units deliver a common value proposition; and holding companies, in which the individual operating companies are autonomous, each having its own strategy and value proposition. We then consider the more complex situation in which decentralized operating units have strategies that simultaneously reflect corporate priorities and local situations.
We close the chapter with an extended example from Bank of Tokyo-Mitsubishi. This implementation seemingly breaks the rules but was still highly successful. This case study illustrates that the cascading process, although informed by general principles, can and should be customized to each organization’s culture and situation.
FRANCHISE OPERATIONS: TOP-DOWN COMMON VALUE PROPOSITIONS
Consider first the scorecard development in corporations consisting of homogeneous retail or geographic units, such as quick service restaurant outlets, hotels and motels, branch banks, and regional distribution centers (as discussed in Chapter 3). For these enterprises, a corporate-level project team develops the scorecard that will be used at each decentralized unit. The common scorecard reflects the financial metrics for each outlet, including the mix between revenue growth and cost improvement; the customer measures of satisfaction, retention, and unit sales growth; the customer value proposition; the metrics for critical internal processes and for employee satisfaction, retention, and capabilities; information systems deployment; and organization culture. Once determined, the common scorecard is communicated to all units and embedded in their reporting and incentive systems.
The benefits of deploying a common value proposition and scorecard across homogeneous units are apparent. First, the process is simple. Once the corporate project team has determined the Strategy Map and associated Balanced Scorecard of measures and targets, these can be quickly deployed throughout the organization. No further analysis or work at local, decentralized levels is required.
Second, the company can easily communicate the common message through speeches, newsletters, Web sites, and postings on bulletin boards. Every employee in every location receives the same, consistent message.
Third, the common measures foster a spirit of internal competition. They facilitate internal benchmarking and best-practice sharing. With every unit following the same strategy and using the same metrics to measure the success of the strategy, the company can identify the leaders and the laggards in any particular measure and then share the information from the best to raise the performance of everyone else.
But there are some downsides in deploying a common corporate value proposition across the organization. Inevitably, the process will feel top-down and authoritarian because little discretion is left to local units. The initial response from many units, long suffering from having to react to short-lived corporate improvement initiatives, will be denial: “This too will pass; let’s wait it out.” The units will be skeptical that the corporate headquarters is truly committed to its new Balanced Scorecard initiative.
Assuming, however, that the corporate executives sustain the initiative, many units will move from the denial stage to the “medicinal” stage: when forced to consume bad-tasting medicine that our parents and doctor insist is good for us, let’s do it quickly and get it over with. At this stage, the units are in compliance mode. They do the reporting mechanically, at the end of each period, to satisfy the corporate desire for more performance measures. The units see this as a no-win initiative. If their performance is viewed as acceptable, then they will be left alone for another period, but they will still have incurred the cost to produce data about the new performance measures. If, however, their performance is viewed as substandard, then they will be found out, asked to supply explanations, and forced to take corrective actions.
In both the denial and the medicinal stage, the decentralized units are not using the Strategy Map and Balanced Scorecard to generate benefits within their local organizations. They are not mobilizing their employees to achieve the corporate goals, not aligning their departments and functions with the common strategy, not educating and motivating their employees to support the strategy, and not embedding strategic focus on the recurring management processes of planning, budgeting, allocating resources, reporting, evaluating, and adapting.
Corporate executives face the challenge of getting the managers of all the decentralized units to appreciate how they can use the common Strategy Map and Balanced Scorecard to align their processes, departments, and people to deliver the common value proposition. Corporate leaders need to persuade local managers about the benefits of having each unit reinforce the value being created at every other unit in the corporation.
At Ann Taylor, a women’s fashion apparel retail chain, each unit had employees create and perform skits relating to the strategic objectives and measures on the common scorecard. Some employees wrote poems, others staged miniplays that portrayed the targeted customer and her buying experience, and still others composed and performed rap songs in ensemble groups. In this way, each employee studied the strategy, internalized it in his or her own way, and had fun performing and watching the creative talents of other employees and supervisors. Even though the common value proposition had been determined at the corporate level, the local performances and games mobilized supervisors and employees and created energy for contributing to the common value proposition.
HOLDING COMPANIES: BOTTOM-UP
In contrast to the top-down cascading process used by corporations with homogeneous retail outlets, scorecard projects in diversified corporations typically start at the operating company level, at least one level below corporate. For example, at the diversified FMC Corporation, senior corporate executives initiated the project by identifying six of FMC’s operating companies to “volunteer” to be the pilots. Corporate provided resources for consultants, but each company developed its own independent scorecard.
Several months later, at a corporate meeting attended by executives from all the FMC companies, the presidents of the pilot companies reported on what they had learned from their projects, generating enthusiasm among all the other operating companies for implementing the new management system. By the end of the year, each operating company had its own scorecard that had been approved by senior corporate management.
Once developed, the FMC operating company scorecards became the accountability contract between corporate headquarters and the operating companies. BSCs provide the agenda and content for discussions at the quarterly meetings of headquarters executives and management of each operating company.
Before the scorecard was introduced, discussions between FMC corporate and operating company executives were about financial measures only, such as return on capital employed (ROCE) and its components. If operating company executives were hitting their ROCE targets, discussions were pleasant and relatively short. If executives fell short on ROCE targets, discussions were longer and more difficult. With the scorecard, in contrast, executives still discussed financial performance, but they also discussed nonfinancial measures that predicted future profitability and growth.
Each operating company scorecard was different. The different scorecards could not be aggregated together into a corporate scorecard, except for the financial measures, which tended to be common across the operating companies. Despite the variety in scorecards, corporate executives found it easy to prepare for a meeting with each operating company. They reviewed the unit’s approved strategy and scorecard and then assessed its current performance against approved targets.
Also, the corporate executives now felt they “owned” the strategy at each operating company. If the company CEO left, voluntarily or involuntarily, the replacement CEO did not have free rein to introduce an entirely new strategy for the unit. The baseline case was for the new CEO to continue to execute the strategy that had been previously proposed by and approved for the unit. New business unit CEOs who wanted to modify the strategy or introduce an entirely new one would first develop a new Strategy Map and BSC with their organizational units and then take these to corporate for approval. This process provided a more systematic way throughout the organization for the autonomous units to have the initiative and responsibility for their strategies while still giving the corporate parent a tool to control and assess operating company performance in formulating and implementing their strategies.
FMC operated for several years in this manner before finally producing a corporate-level scorecard that, not surprisingly, contained mostly financial and employee (learning and growth) measures. It also included several internal process measures, primarily related to safety, that each organizational unit would include in its local Balanced Scorecard.
In summary, scorecards in highly diversified corporations rarely start at the corporate level because no corporate-level strategy typically exists. Each operating company develops its own strategy and accompanying scorecard, which corporate executives approve and subsequently use to monitor operating company performance. At some point, the corporate parent develops a corporate-level scorecard to aggregate the financial and employee measures of the autonomous units, and also to articulate corporate-level themes—such as excelling at safety, quality, or the environment—that are then incorporated into scorecard measures at each operating company.
HYBRID CASCADING PROCESSES
Most organizations, operating between the two polar cases of identical decentralized units and highly diversified corporations, can choose from two implementation paths. One is a classic top-down process in which the initial Strategy Map and Balanced Scorecard are done at the corporate level, followed by scorecards at each business and support unit that implements the corporate-level strategy and scorecard measures.
The second approach is more bottom-up, with pilot projects performed at the business unit level to develop local Strategy Maps and BSCs. These projects build knowledge and confidence about the management tool, and only subsequently is the project taken up to the corporate level for an explicit articulation of the corporate value proposition.
TOP-DOWN CASE STUDY: U.S. ARMY
The prime example of an effective top-down cascading process, not surprisingly, was done at a large, hierarchical, and highly integrated organization : the U.S. Army. The Army Balanced Scorecard, which it called the Strategic Readiness System, was launched in early 2002, after approval at the highest organizational level: the chief of staff of the Army (CSA) and the secretary of the Army (SA).
The first scorecard, referred to as the level 0 scorecard, reflected the global Army strategy (see Figure 6-1). The scorecard defined the mission in terms of two core competencies: “train and equip soldiers and grow leaders” and “provide relevant and ready land power capability to the combatant [field] commanders and the joint team.” Instead of customers, the U.S. Army had stakeholders—U.S. citizens, Congress, and the executive branch—for which it identified six key capabilities: shape the security environment, execute prompt response, mobilize the army, conduct forcible entry, sustain land dominance, and support civil authorities.
The internal process perspective was organized by four strategic themes:
- Adjust the global footprint.
- Develop a joint interdependent logistics structure.
- Build the future force.
- Optimize reserve component contributions.
The learning and growth perspective emphasized objectives for people that would sustain a capable, all-volunteer force. And, instead of a financial perspective, the Army used a resources perspective to reflect its ability to obtain the people, funds, infrastructure, installation, and institutions, within a reasonable time period, to carry out its mission.
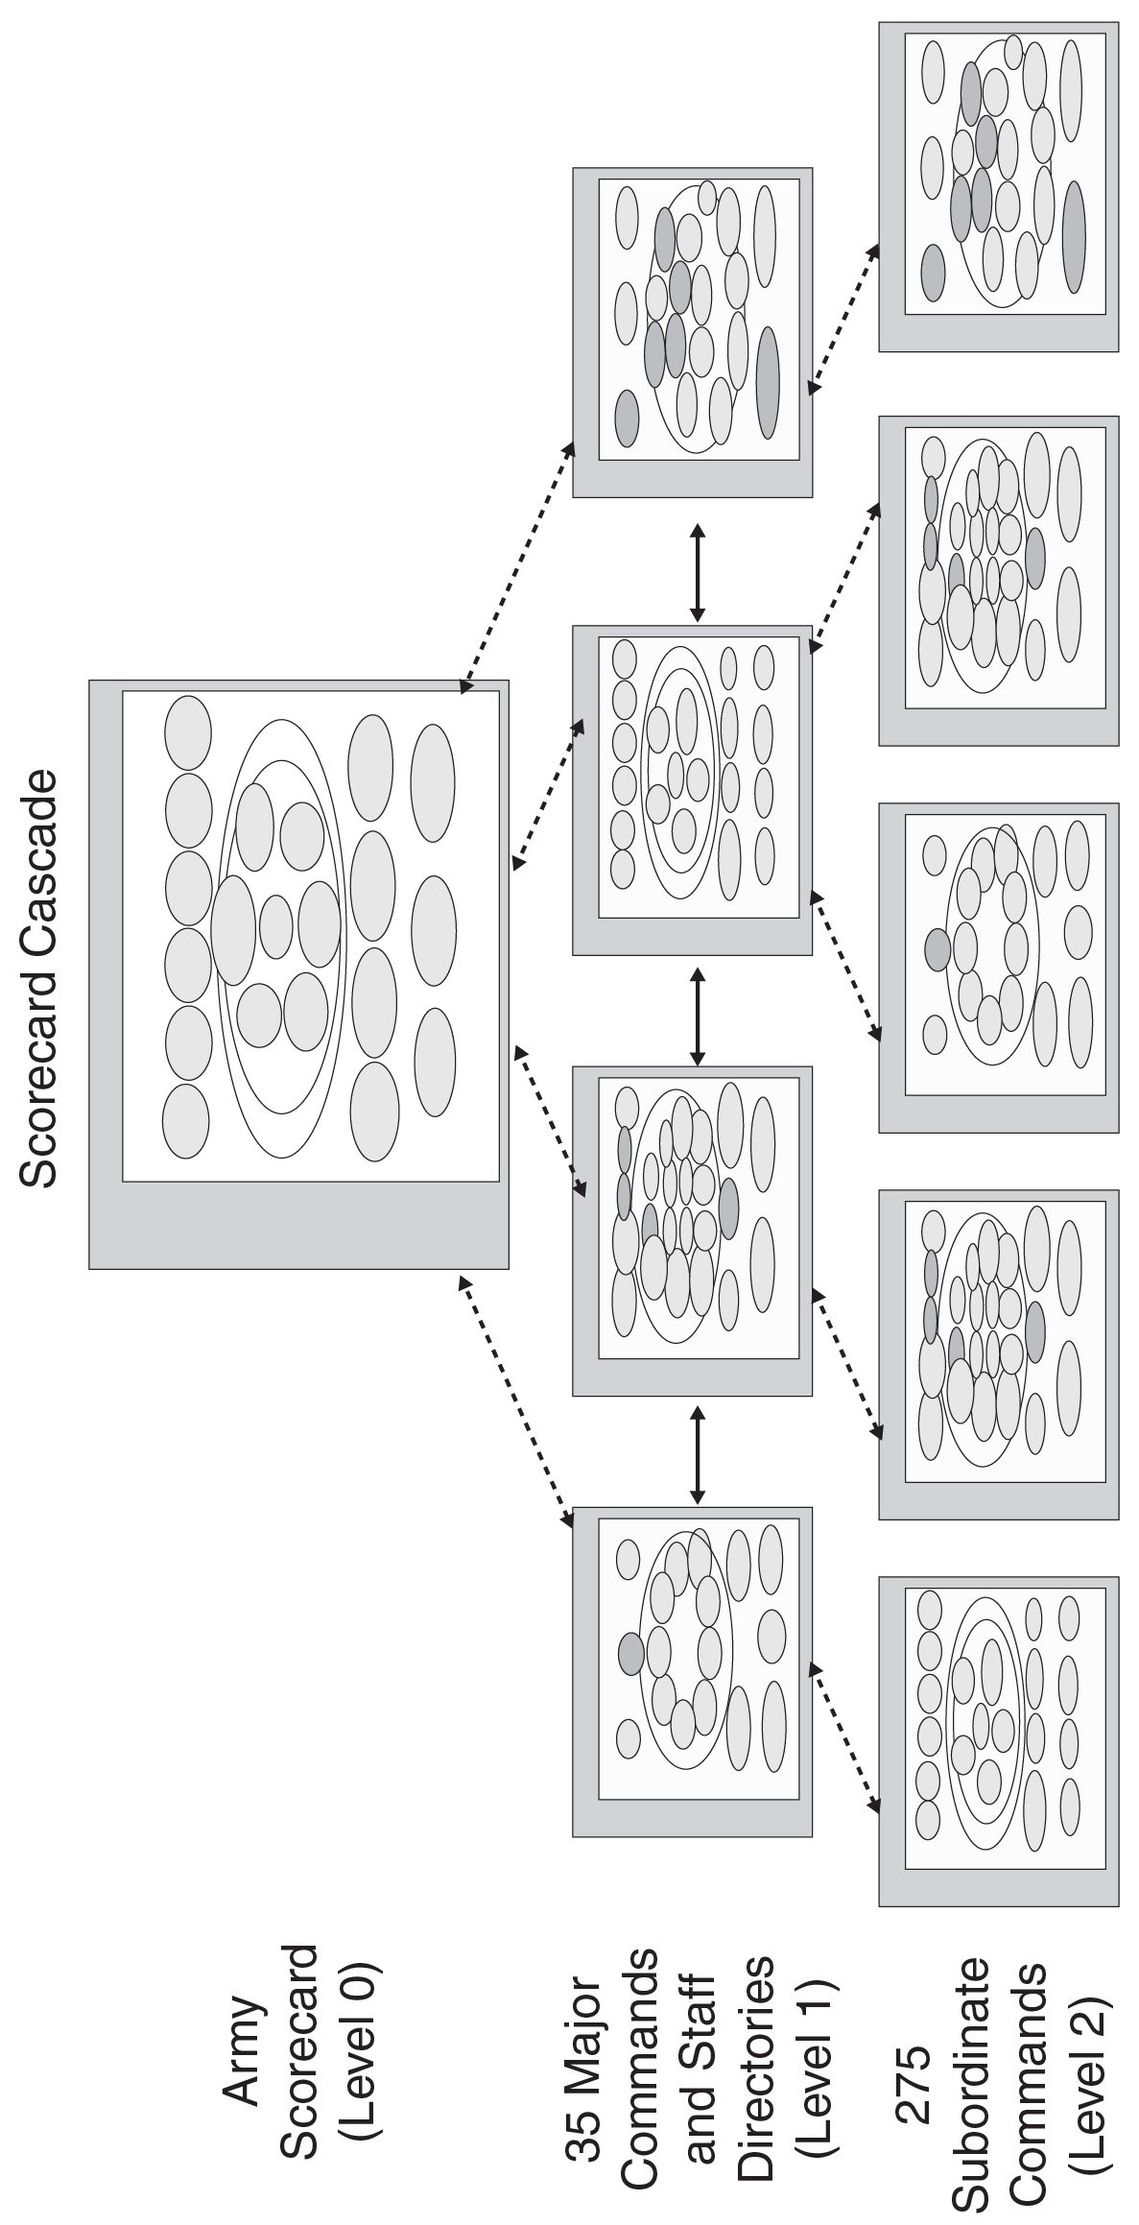
The Army project team completed the level 0 scorecard within three months, and the CSA and SA approved it in April 2002. In the next step (see Figure 6-2), the level 0 scorecard was cascaded out to level 1 units that reported directly up to the CSA. Level 1 units consisted of thirty-five major Army commands and staff directorates, such as medical, personnel, and logistics. The level 0 scorecard provided the strategic framework and guidance to these thirty-five units. Each command and directorate defined its strategic priorities in support of the Army as well as those that fulfilled its local mission.
A new headquarters unit, the SRS Operations Center (SRSOC), led the cascading process and served as a centralized consulting unit for the project. Consisting of a core team of Balanced Scorecard experts, the SRSOC provided guidance, expertise, training, technology support, and quality control for the BSC rollout throughout the Army. The SRSOC led a two-day training class, which eventually reached four hundred BSC project leaders, on the basics of BSC methodology and the Army level 0 scorecard.
Figure 6-1 U.S. Army Strategy Map-
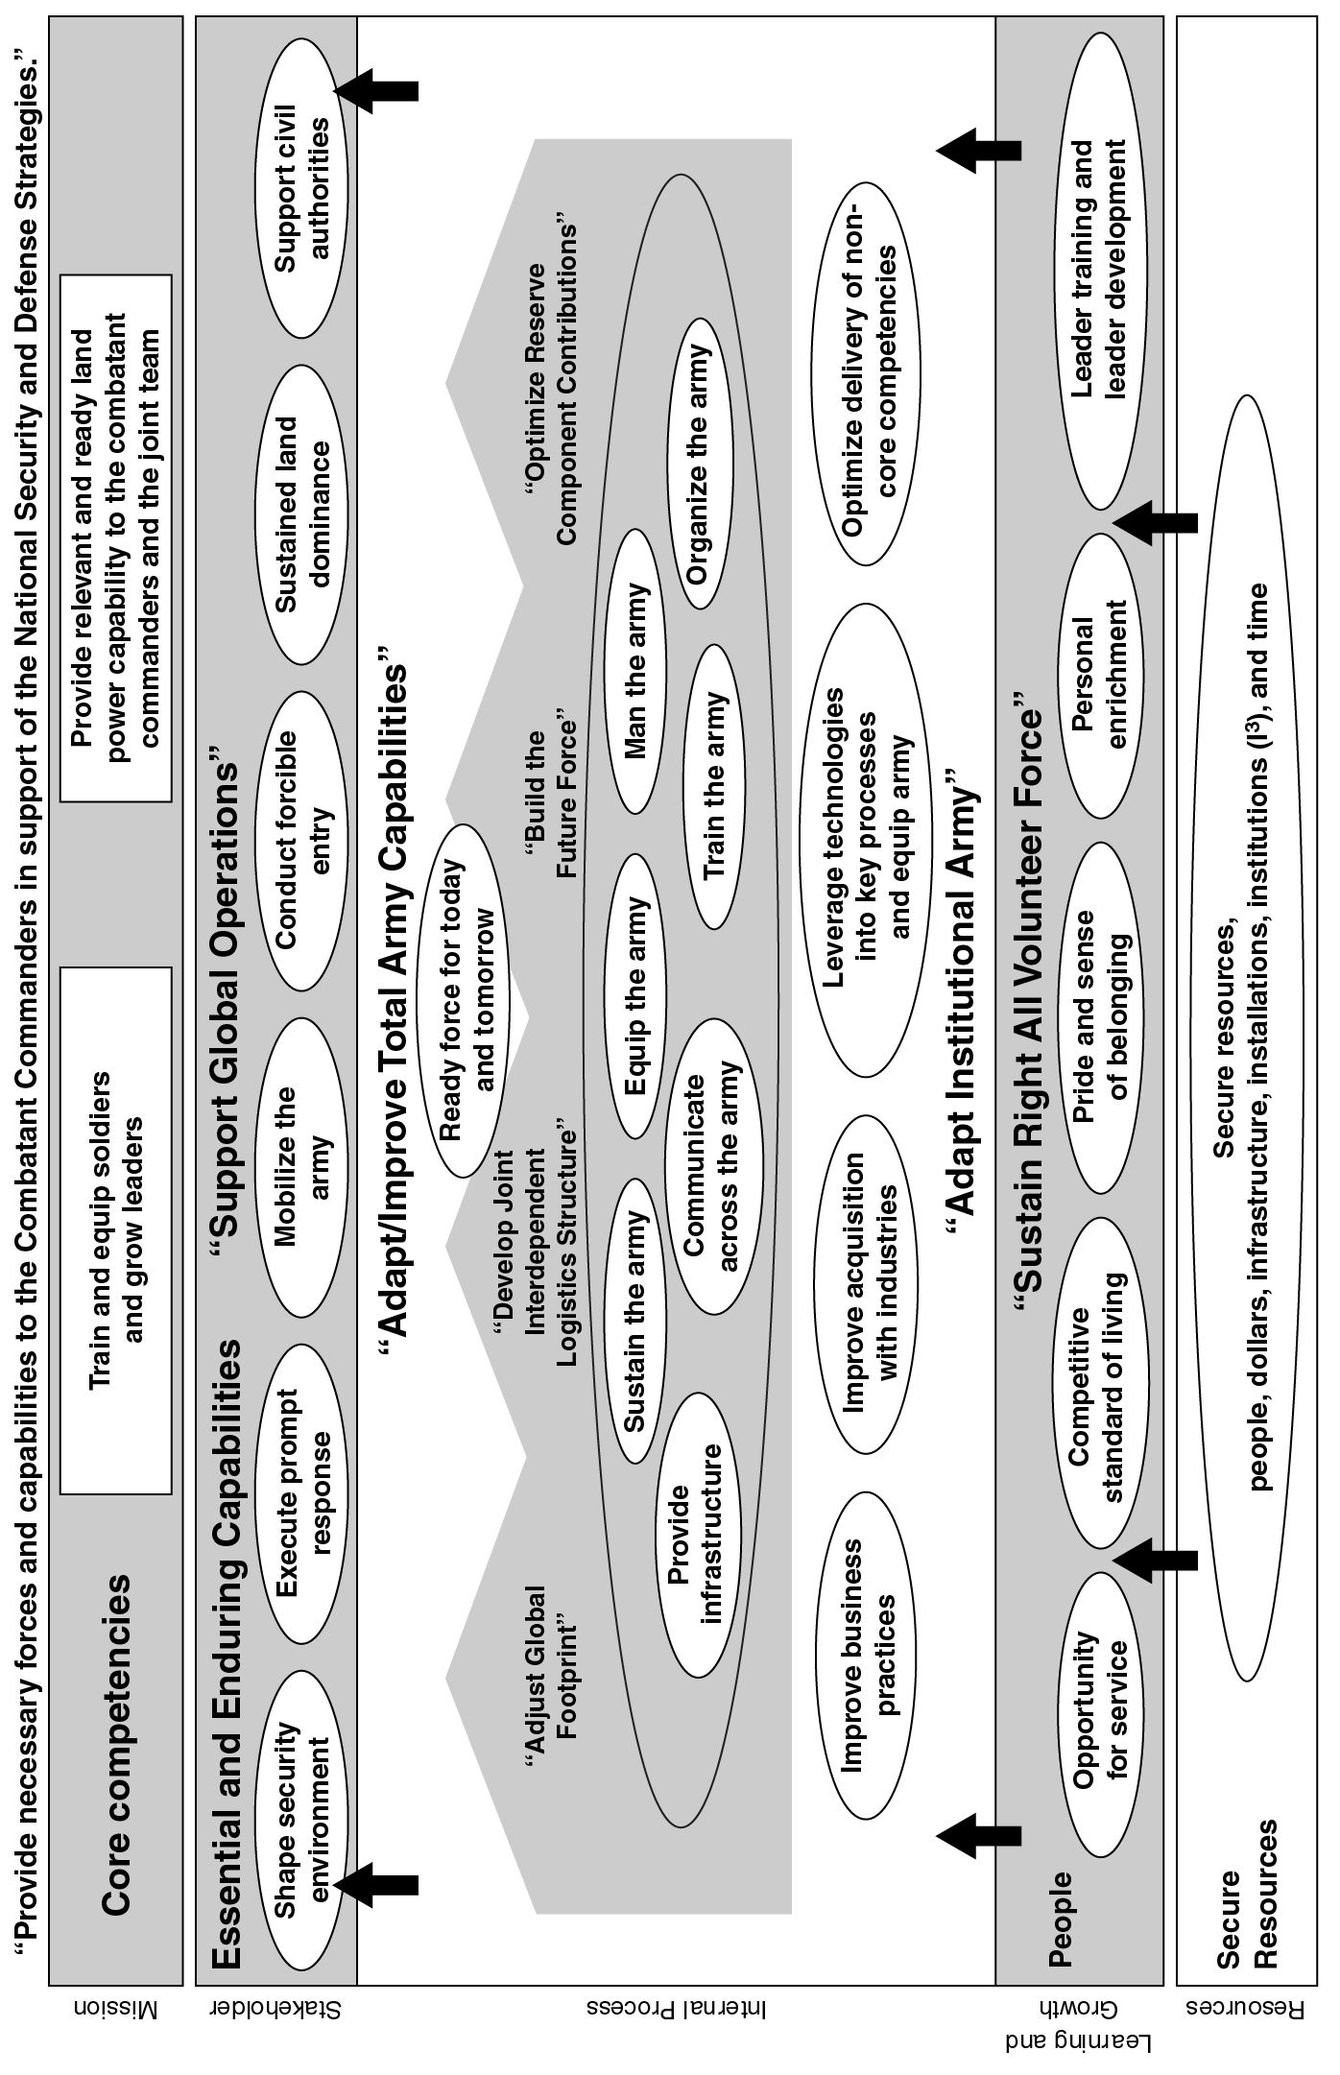
Figure 6-2 Cascading the Balanced Scorecard Throughout the Army
Each major command BSC team worked with its leadership to capture strategic priorities and built the Balanced Scorecard using an online tool, the SRS Design Center Express. This design support tool provided multimedia instruction, templates, and alignment with Army objectives and measures. Status reports generated by the Design Center enabled the SRSOC to keep level 1 teams working within specified time frames. The SRSOC held weekly conference calls that included question-and-answer sessions, and it established two checkpoints at which each unit had to submit its Strategy Map and Balanced Scorecard measures for peer review.
The senior officers in each major operating command and staff directorate approved their unit’s Balanced Scorecard and then submitted it to the CSA for review. The CSA used this as an opportunity to discuss strategic direction with commanders undergoing organizational change.
The next cascade, down to the 275 level 2 organizations, was executed in a similar manner as with the level 1 organizations. The key difference was that level 2 organizations received their support from operations centers established at each level 1 organization. The level 1 operations centers were responsible for quality control, questions and answers, Design Center support, time-line monitoring, and general program oversight. The headquarters (level 0) SRSOC provided support when a level 1 operations center required assistance. By establishing individual level 1 operations centers, the project accelerated knowledge transfer and generated buy in at the field level. The training and online SRS Design Center Express enabled all 275 level 2 organizations to develop their Balanced Scorecards in parallel. One further cascading level still remained. Eventually, individual divisions and separate brigades, consisting of around ten thousand soldiers, would have their own scorecards.
Army officers now use the Balanced Scorecard to conduct regular strategic resourcing review meetings with their general officers, senior civilian leaders, and other team members. The SRS BSC enabled each team to evaluate recent unit performance in a way that cut across organizational silos (e.g., logistics, operations, medical, training, and other staff areas). People from different organizations within the Army had easy access to scorecard data and aligned quickly around issues that connected the various organizations. Put simply, the scorecard enabled the Army to “get the right people in the room” when issues cropped up.
The Army Balanced Scorecard gives the leadership accurate, objective, predictive, and actionable readiness information to dramatically enhance strategic resource management. For the first time in its history the Army has an enterprise management system that integrates readiness information from active and reserve field and staff, thereby enabling the Army to improve support to combatant commanders, to invest in soldiers and their families, to identify and adopt sound business practices, and to transform the Army. By gathering timely information with precision and expanding the scope of the data considered, this reporting system markedly improves how the Army measures readiness. The Army is further developing this system to leverage leading indicators and predict trends, avoiding issues that affect readiness before they become problems.
In addition to the benefits realized at the top level of leadership, individual commands have extracted tremendous value from the BSC. The individual units have been able to more effectively meet their mission-essential task lists and simultaneously focus on readiness and overall transformation toward the objective force of the future.
TOP-TO-MIDDLE AND MIDDLE-TO-TOP CASE STUDY: MDS CORPORATION
A slightly different process was followed by MDS Corporation, a diversified enterprise. MDS also followed an initial top-down process but because its operating units were autonomous, the corporate-level strategy was not fully developed in the first formulation of the corporate Balanced Scorecard. Once operating units developed their maps and scorecards, the corporate team updated its scorecard and selected measures that then became common throughout all units.
MDS Corporation, headquartered in Toronto, is an international health and life sciences company that provides products and services for the prevention, diagnosis, and treatment of disease. With locations in twenty-three countries, MDS employs more than ten thousand people and had fiscal 2004 revenues of $1.8 billion. MDS is a diversified company operating through four major business sectors: MDS Isotopes supplies imaging agents for nuclear medicine, material for sterilization systems, and therapy systems for planning and delivery of cancer treatment; MDS Diagnostics provides laboratory information and services to prevent, diagnose, and treat illness; MDS Sciex supplies advanced analytic instruments, such as mass spectrometers; and MDS Pharma Services provides contract research and drug development services to the pharmaceutical industry, along with pioneering the development of functional proteomics in finding completely new ways to discover drugs.
From 1973 to 2002, sales increased at a 20 percent cumulative annual growth rate, and earnings increased at a 16 percent CAGR. Clearly, MDS was not a company in crisis; it did not have a burning platform. MDS launched a Balanced Scorecard project to transform itself from “good to great” by focusing on the most important value-creating activities and achieving more alignment throughout its diverse business units. The MDS corporate team started by asserting what it would not change. It would retain its core values—“integrity, commitment to excellence, mutual trust and a genuine concern and respect for people”—and referenced the importance of embedding the core values in all aspects of corporate life as the foundation of its Strategy Map.
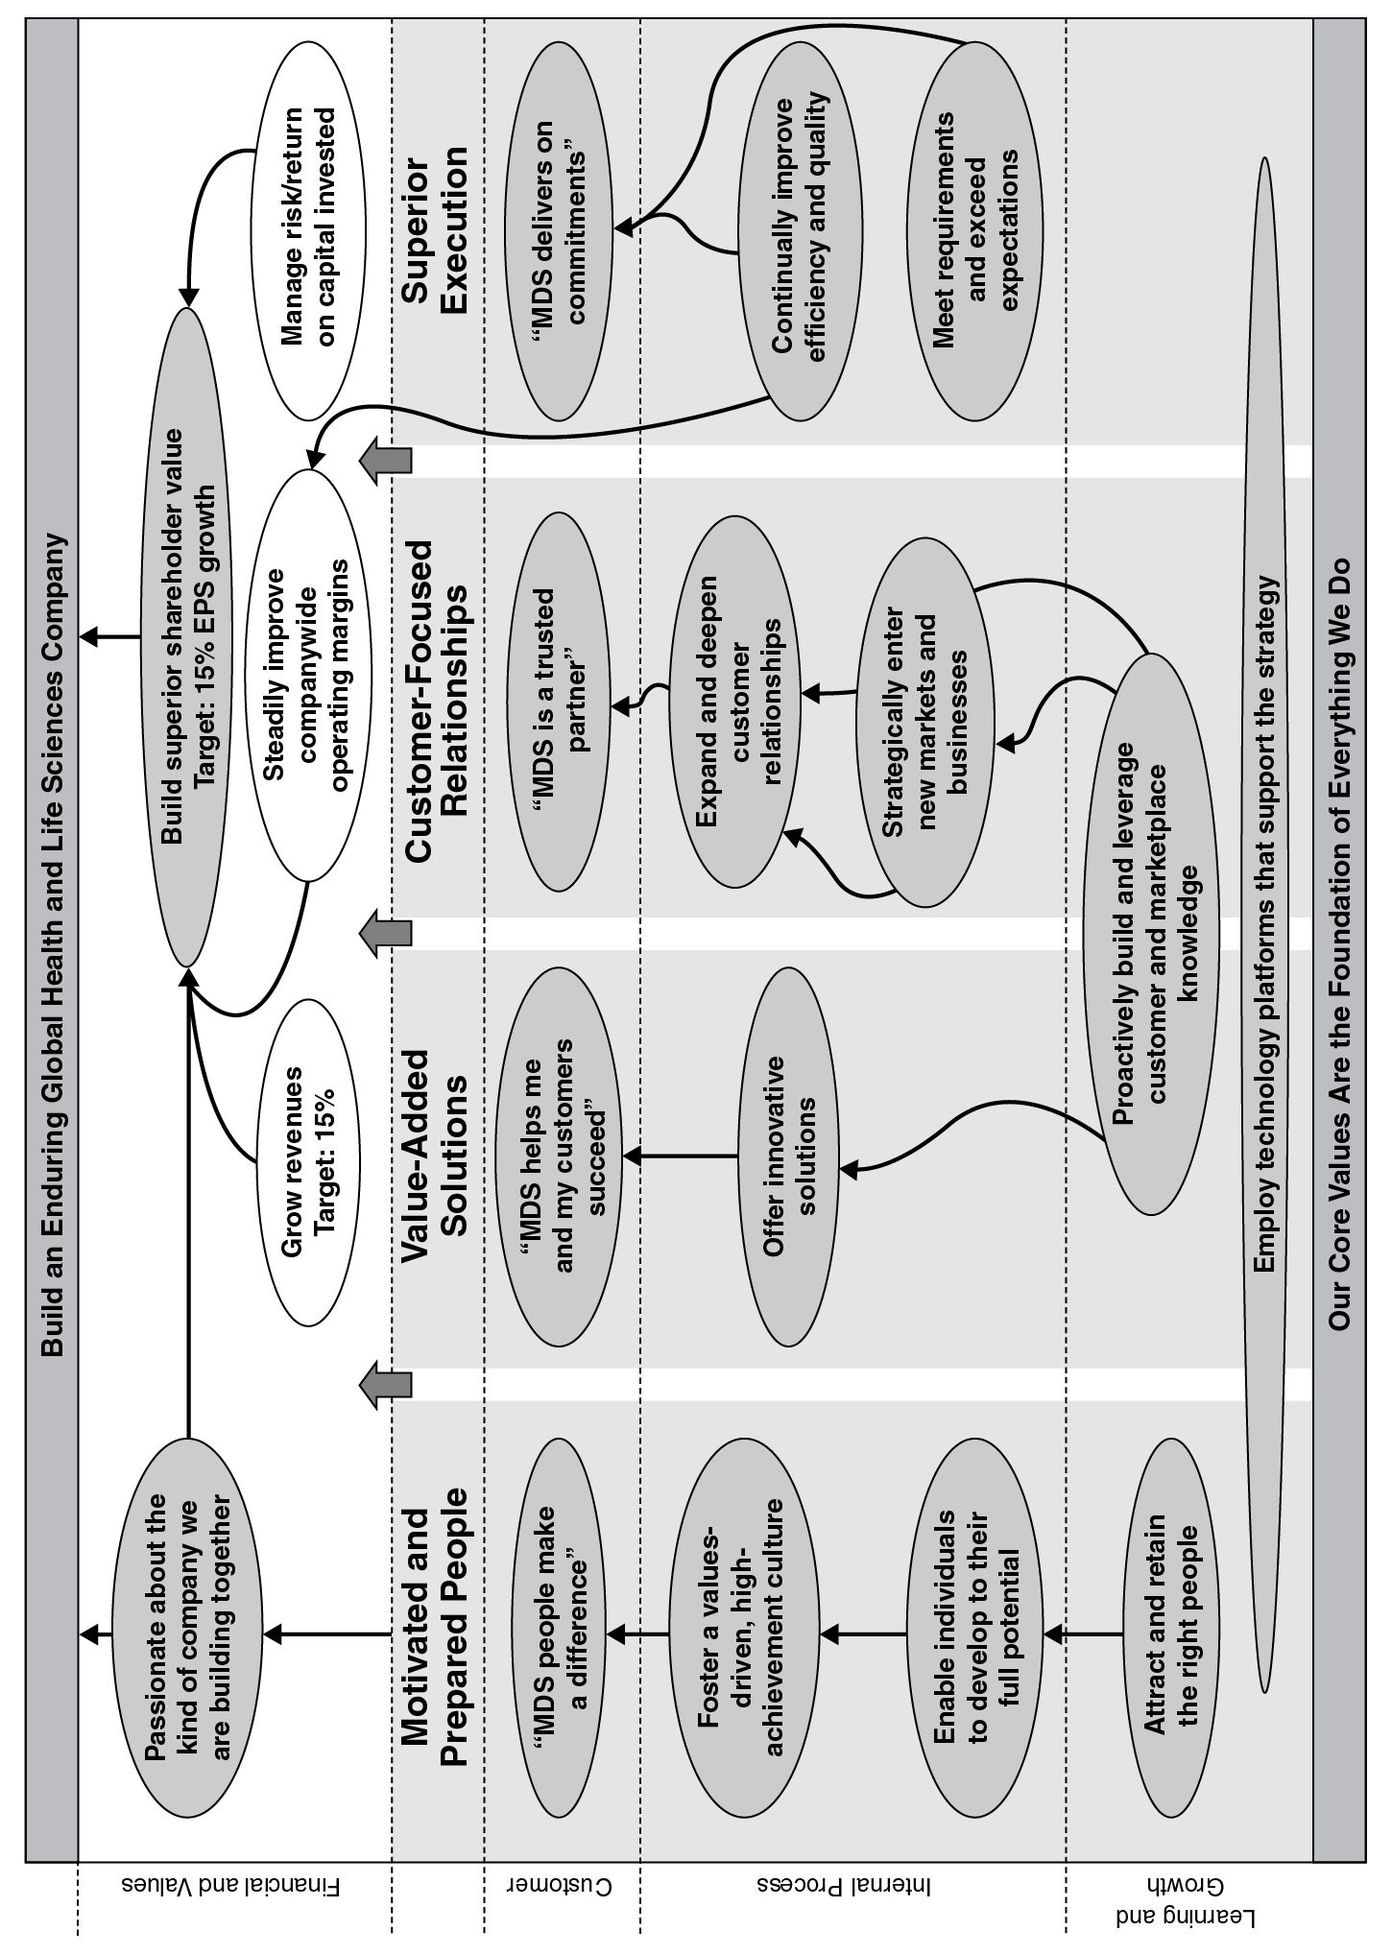
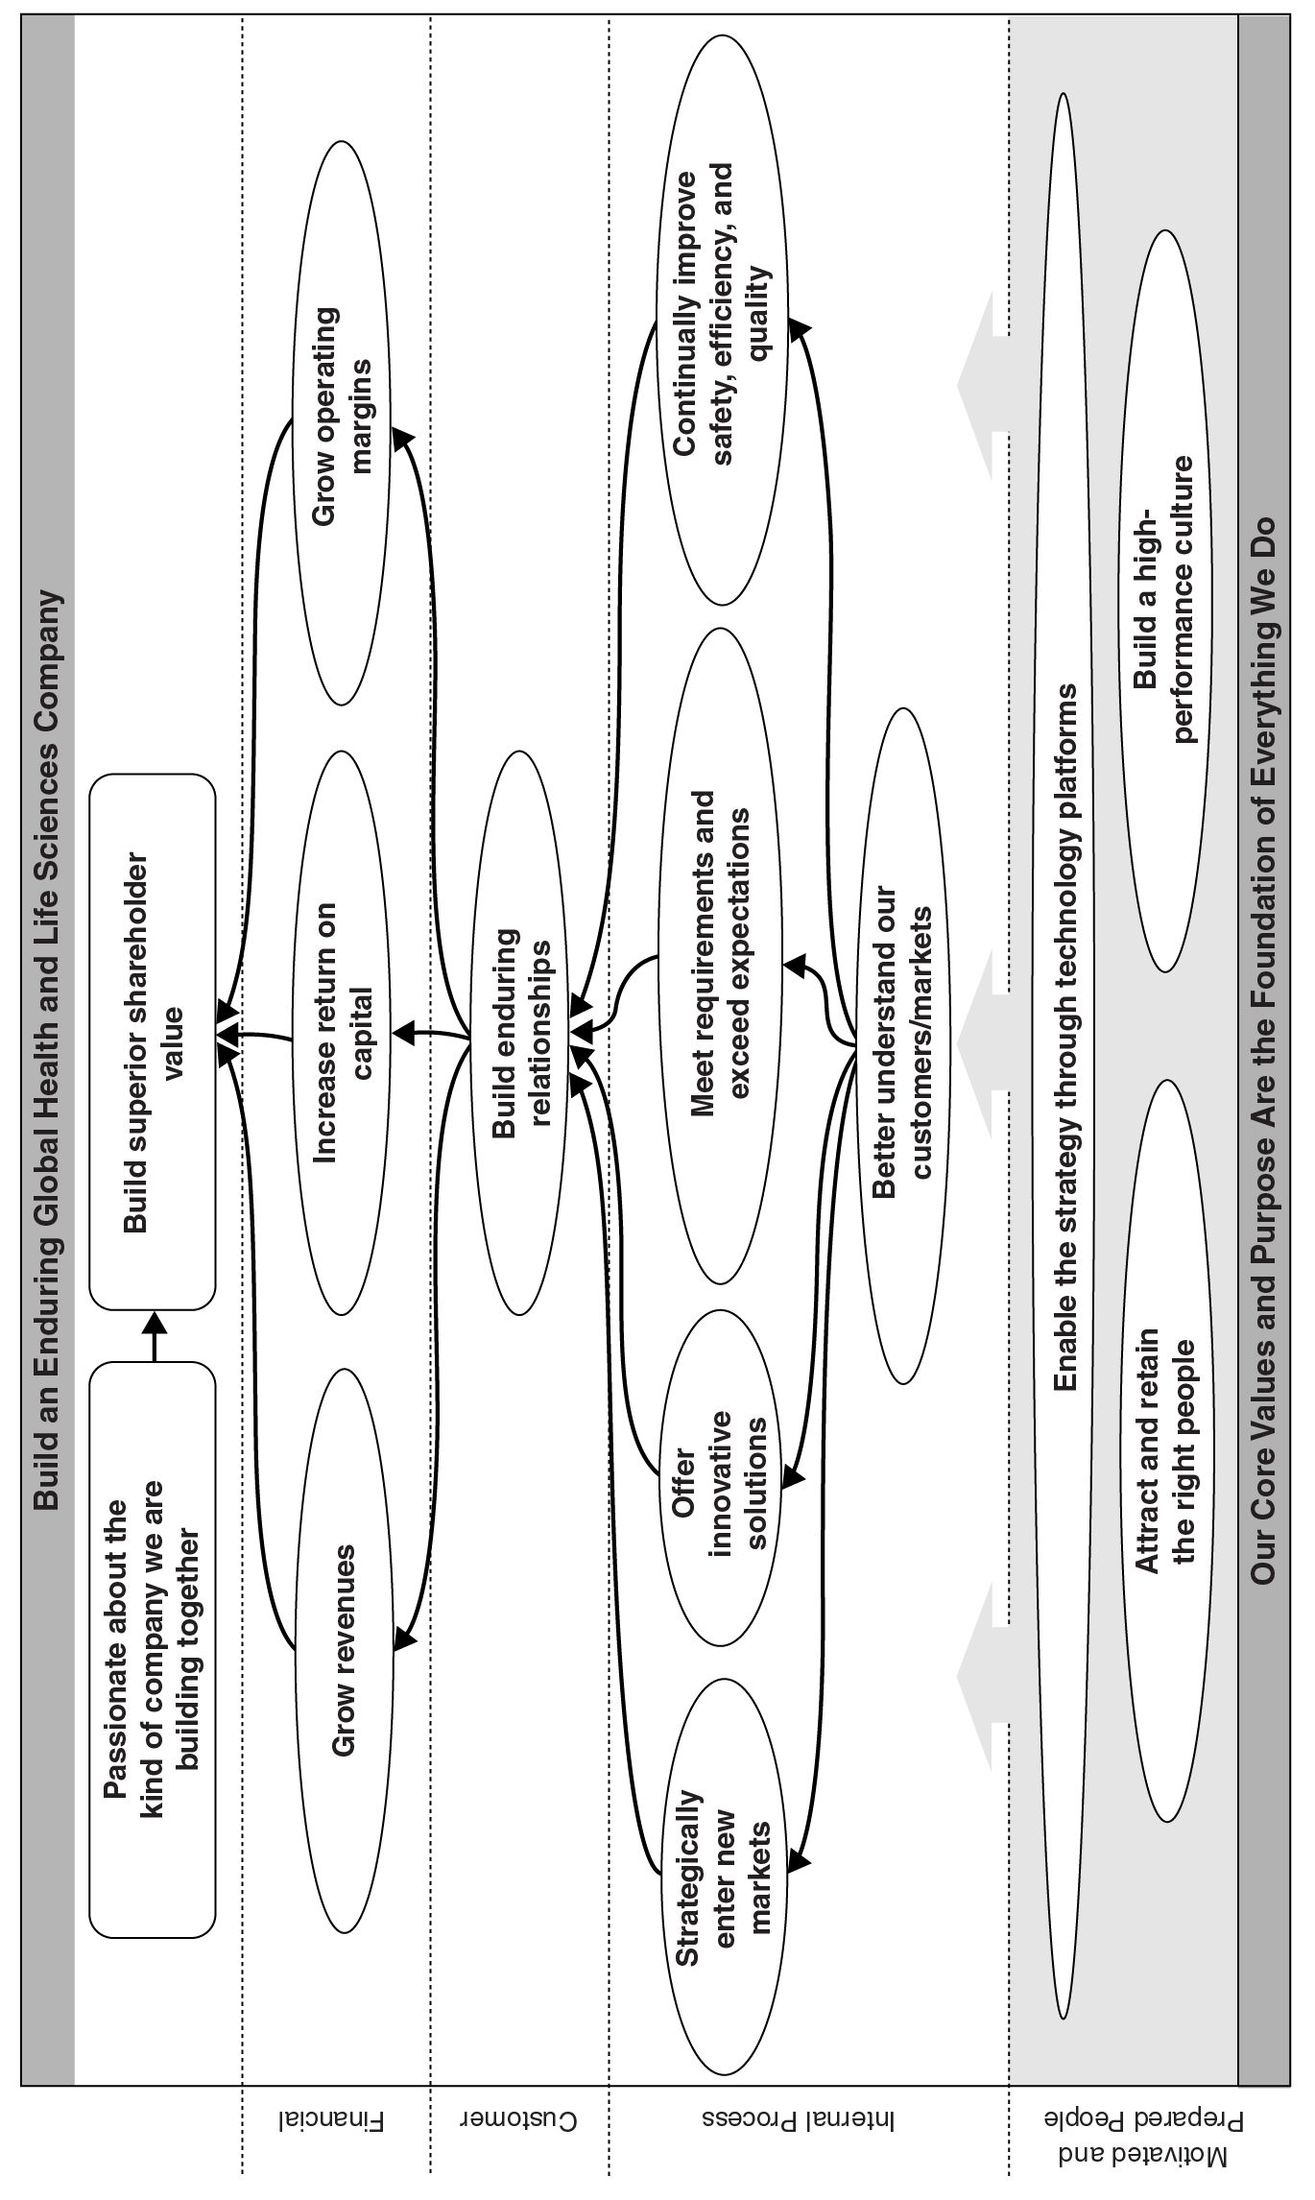
MDS placed its vision—“to build an enduring global health and life science company”—at the pinnacle of its corporate Strategy Map. MDS’s goal of going global required expanding well beyond its historic Canadian and North American base. MDS also included a statement of its values—“passionate about the kind of company we are building together”—within its financial perspective (see Figure 6-3). These statements of vision, values, and purpose would endure even with the new strategy MDS wanted to define to stimulate organizational growth and change.
The enterprise Strategy Map incorporated explicit financial measures and targets to maintain MDS as a profitable, high-growth company. The learning and growth objectives also reflected corporate-wide priorities about people and systems. MDS corporate selected four general customer themes, each supported by several customer and internal process objectives. To allow its diverse business units the freedom and initiative to individually define how they created value, MDS deferred selecting measures for customer and internal process objectives. This by itself was a corporate revelation because it was the first time that the corporate management process recognized that business units, and not the corporate headquarters, created most of the value.
In cascading the enterprise Strategy Map, MDS identified eleven business units as its most strategic. These units had direct contact with customers and clients. Corporate asked those business units to develop Strategy Maps and Balanced Scorecards and to cascade these down to their departments and people. Corporate BSC coordinator Bob Harris selected a BSC process owner in each business unit and worked with these process owners to maintain consistency in format and terminology and to share learning throughout projects. Each business unit developed its own customer value proposition, choosing between low cost, customer intimacy, and product leadership.
Figure 6-3 Original MDS Corporate Strategy Map
The corporate headquarters initially struggled to define how it and the rest of the organization added value beyond that created by the eleven strategic business units. Eventually it concluded that the headquarters added value by top-down leadership and direction using its structure of four operating divisions (isotopes, diagnostics, late and early stage pharmaceutical services), by direct corporate support of basic R&D, and by an infrastructure of shared services.
With the basic alignment structure now in place (see Figure 6-4), the corporate project team revisited the corporate Strategy Map. During this revision, corporate reduced the number of objectives on its map from eighteen to twelve (see Figure 6-5).
The first corporate map was too specific, and several of the business units had adopted the four high-level corporate customer objectives without defining the specific customer value proposition that created differentiation for their unit. The new corporate map reflected the understanding that corporate headquarters did not have customers; only business units had customers. Corporate therefore selected only one highly generic customer objective for its map, “build enduring relationships,” making it clear that each business unit had to select the specific customer value proposition that would enable it to build enduring customer relationships.
The corporate leadership also now selected measures for each corporate objective and assigned a corporate executive to be responsible and accountable for achieving targeted performance for that measure. The corporate measures and targets provided clear guidance for common measures and associated targets for each business unit scorecard. The corporate role was not to treat its business units as “customers.” The corporation owned the business units; it would set priorities and targets for the business units and would provide support to help the business units achieve targeted performance. Occasionally, corporate would intervene when it saw that a corporate priority—say, for innovation—required corporate funding for cross-unit or basic research beyond what an individual business unit could justify solely for its own performance. The corporate business development unit would find and fund acquisitions that it felt would benefit multiple business units. These interventions were based on objectives either on the corporate Balanced Scorecard or those of its shared-service units, such as corporate business development.
These two case studies illustrate two quite different approaches, yet each worked well for its organization and culture. The U.S. Army used a classic top-down approach. The corporate strategy was determined at the top and then cascaded down to lower-level operating units, where the maps and scorecards of the decentralized units simultaneously reflected corporate themes and priorities as well as their local missions and challenges. MDS used a more iterative approach. Headquarters first framed a preliminary corporate Strategy Map, and then operating and support units developed their own maps and scorecards. After this first round of scorecard development, headquarters revisited and revised the corporate Strategy Map and BSC and then cascaded common measures back down to local operating and support units.
Figure 6-4 Complete MDS Alignment
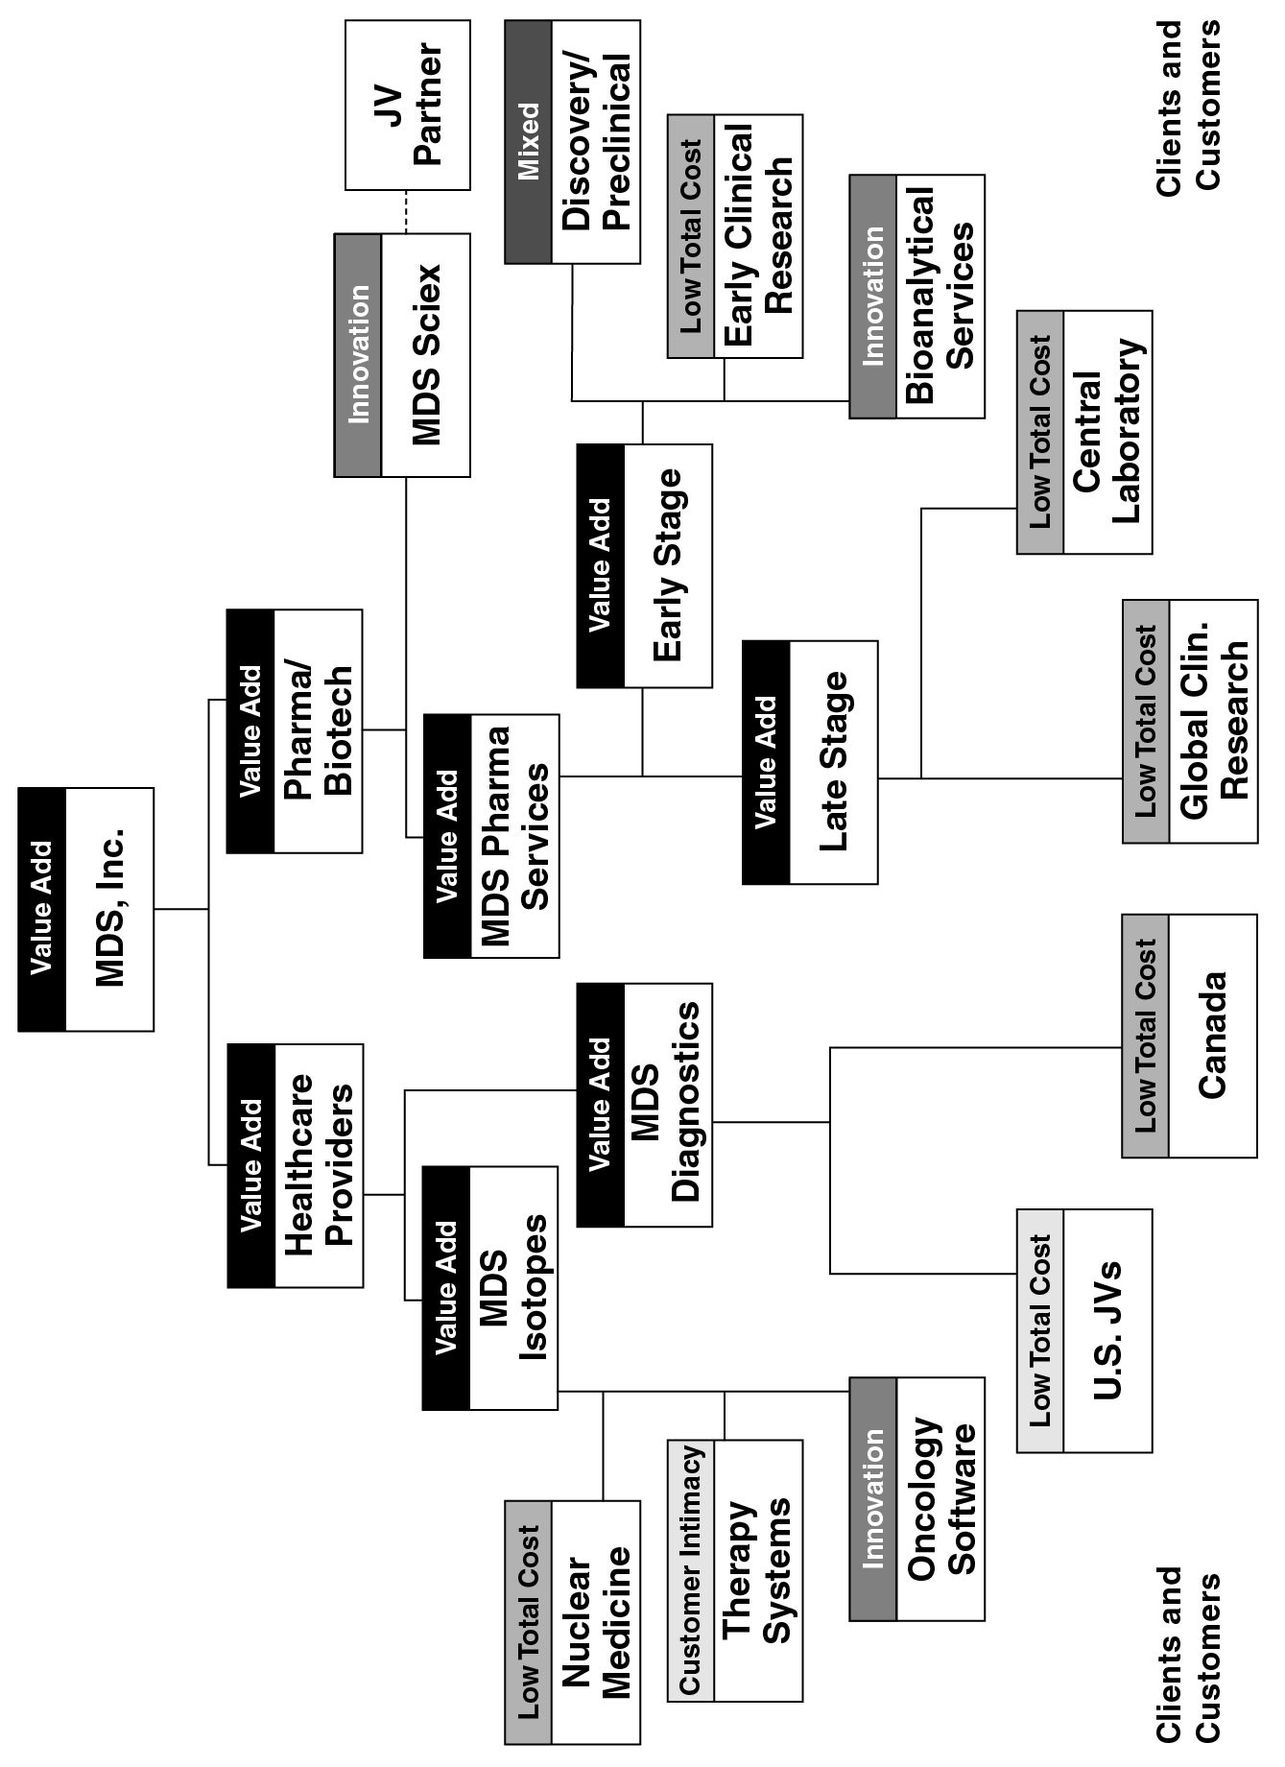
Figure 6-5 Revised MDS Corporate Strategy Map
CAN BUSINESS UNITS GO FIRST?
Many implementations of the BSC and Strategy Map do not start at the corporate level. The first scorecard might be built at a division or business unit level for two reasons. First, the corporation may want to pilot the concept at a local unit to gain knowledge, experience, credibility, and enthusiasm before launching a major project to develop and cascade scorecards across the entire enterprise.
Second, and more typically, the zeal to build and use a Balanced Scorecard as a strategy management system may not exist at the corporate headquarters. The enthusiasm for the concept may originate at a local business, geographic, or support unit. Following the ideas presented in the book so far, the local missionary may feel that she should first convince the senior corporate executive team of the benefits of the scorecard system so that it can be launched and sponsored at the top. Such a conversion to a new measurement and management concept, however, may take years if not decades. Few of us have the patience to wait for insight to burst forth spontaneously from the executive suite.
Our recommended course is to build the initial scorecard where the leadership and enthusiasm for it exist. Often this is at a local unit. But this approach may lead to a suboptimal local strategy. The unit’s strategy may reflect the best thinking about how it can create value through exploiting competitive opportunities in its local markets, but it may not be the strategy that adds the highest value to the corporation because it ignores links and opportunities for integration with other units in the organization.
The solution to this apparent dilemma, however, is simple. Early in the formative stages of the local project, representatives from the team should travel to corporate headquarters and meet with, say, the chief operating officer and the chief financial officer. The team members describe the project they have just launched and ask for guidance from the COO and CFO using some version of the following script:
Where do we fit within the corporate-level strategy? As we develop our strategy, our map, and our scorecard, what corporate priorities should we consider? Which corporate-level themes should we be sure to incorporate? Are there links or integration with other business units that we should be aware of as we develop our strategy and performance measures?
The answers to these questions do not require that a corporate-level Strategy Map and BSC exist. They require only that the senior executive team have a clear corporate-level strategy that provides a framework to describe how local business units should operate to create synergies across the organization.
So the hoped-for reply to the questions might describe the nature of the customer value proposition that the local unit should be attempting to deliver, important global customers to be featured, the need for cross-selling to shared customers of other units, and the importance of leveraging a central resource or capability, developing people, or creating databases and knowledge that can be shared with other units. The response might include corporate-level themes for excellence in quality, safety, environmental impact, or e-commerce. Informed by this corporate-level response, the project team members can return to the local unit and embed the corporate priorities, links, and opportunities for integration into their unit’s Strategy Map and Balanced Scorecard.
Of course, an alternative response from the senior executives would be to dismiss the question as irrelevant:
Don’t bother us with all this jargon about corporate-level strategy and common customer value propositions. We’re not populated at headquarters with a lot of MBAs or ex-consultants. Just go out there and make money. That’s what corporate wants.
The team members conclude, “OK, no corporate strategy here. We are free to adopt any strategy we want, as long as it delivers the financial results.” In this case, the local unit develops its own Strategy Map and BSC without explicit guidance from corporate (other than “The strategy had better work”). But at least they tried to identify synergy opportunities, even if rebuffed.
We hope that in either case, the local unit will develop a great scorecard that helps it implement its strategy rapidly and effectively and soon enjoys considerable financial success. As knowledge and confidence grow about how the scorecard facilitates effective strategy execution, the concept can migrate horizontally to other business units and vertically to the division and eventually the corporation. The key guiding principle, when people are developing the first scorecard at the local level, is to incorporate, as best they can, the opportunities for value creation by linking with other business units and shared services in ways that enhance the value created by the local unit by effective execution of its strategy.
We have seen examples where the first scorecard was built in a shared-service unit, such as human resources or information technology. This can certainly be a successful approach, but only when the shared-service unit understands the strategies of the operating units and the corporation sufficiently well that it can articulate a strategy for itself that directly helps the corporation and business units achieve their strategic objectives.
In one international automobile company, the first scorecard in the company was built for the IT group for European operations. The IT group played a central role in the operations of the eight independent product-line units in the region, so it felt confident it understood the strategies of these eight operating units. When the eight product-line units learned about the IT scorecard initiative and observed it in practice, they decided they wanted Balanced Scorecards, too. The IT BSC project team soon became the lead project team for the projects in the eight European units.
Eventually, news of the initiative drifted to corporate headquarters, and the person from IT who had helped to launch the project in his local department got the assignment to be the corporate-level resource for worldwide deployment of a Balanced Scorecard management system. Although this is not necessarily the recommended sequence for cascading scorecards throughout the organization, it certainly is a feasible one and one that allows enthusiasm and commitment to develop from the grass-roots level rather than being imposed from the top.
MIDDLE-TO-TOP-DOWN: THE BANK OF TOKYO-MITSUBISHI, HEADQUARTERS FOR THE AMERICAS
Our final example seemingly breaks the rules, but eventually it worked out fine. The Bank of Tokyo-Mitsubishi, Headquarters for the Americas (BTMHQA), based in New York, focuses on wholesale banking in North and South America. It has offices in twenty-three cities in nine countries in the region. It contains four major business units—treasury, global corporate banking, investment banking, and the corporate center—each with multiple divisions and groups. Each major business unit has a dual reporting relationship; it reports directly to a business unit headquarters in Tokyo and to the regional (Americas) headquarters in New York City.
BTMHQA adopted the Balanced Scorecard to provide a common strategic framework that would overcome differences between the Japanese and American cultures (see Figure 6-6). The BSC would also create horizontal alignment across the four major business groups, and vertical alignment up to regional headquarters and down to the geographical branches throughout the Americas.
At the start of the project, in the third quarter of 2001, senior executives at BTMHQA headquarters resisted articulating a corporate-level strategy and developing a corporate Strategy Map and Balanced Scorecard. Even though the various divisions and groups within BTMHQA shared customers and processes, the executives explained that in a Japanese company strategy is done bottom-up, not top-down. The BTMHQA senior executives told the project team, “If you want to know the strategy, go directly to the people.”
The headquarters project team proceeded by directing and assisting personnel in each of the more than thirty BTMHQA groups and departments to build their own Strategy Maps. The exercise typically took a unit about thirty days, and in many cases only one or two individuals, working independently, performed the task.
Upon completion of the more than thirty Strategy Maps, the headquarters project team observed that beyond all scorecards having four perspectives, no unifying structure existed. On most of the maps, the internal process objectives did not identify the processes necessary for successful delivery of the customer value proposition. And, given the way they were constructed, few interdependencies were recognized across individual group Strategy Maps. Also, a key corporate priority—risk management—appeared in only a few group scorecards.
During the fourth quarter of 2001, the headquarters project team worked to synthesize the common ideas in the multiple Strategy Maps. The implicit strategy existed within them, but important features needed to be extracted and presented in a standardized format. The team developed a high-level template, a 4 × 3 matrix, to provide a common language that could be used to organize objectives in the four perspectives (see Figure 6-7). To remedy the insufficient attention paid to risk management in the initial maps, the team included, in the new template, an explicit financial perspective category related to risk outcomes, such as reduced credit and litigation losses; in the internal process perspective, it included an operating theme focused on risk-management processes.
Figure 6-6 Bank of Tokyo-Mitsubishi, Americas,Had to Bridge Two Distinct Cultures
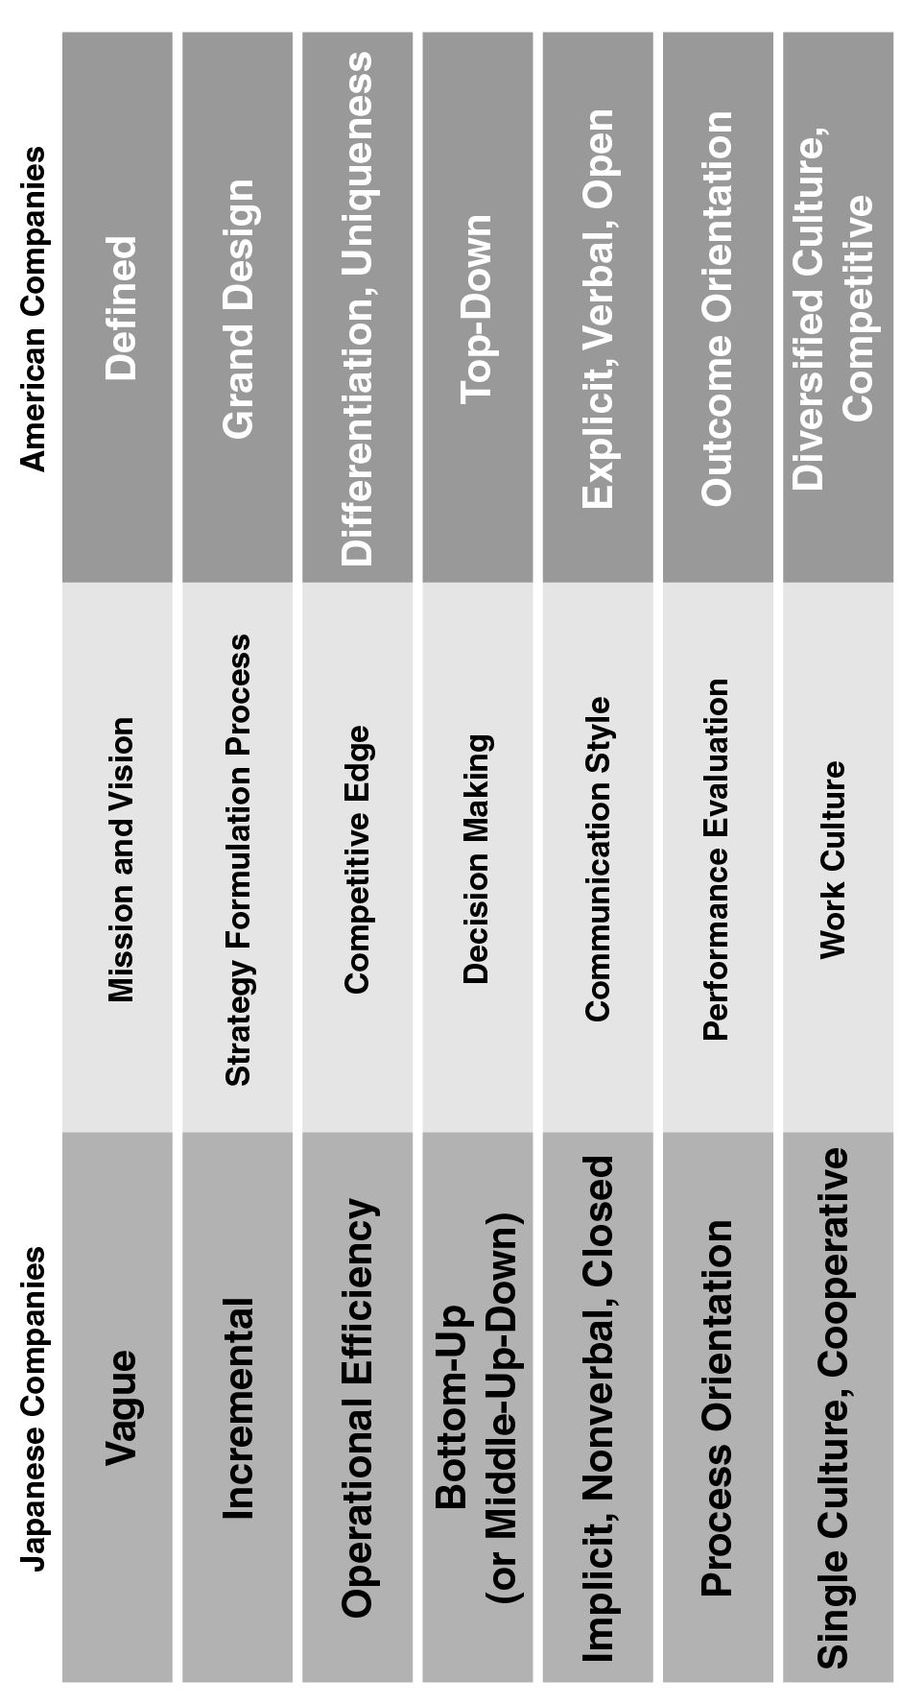
Source: Adapted from I. Nonaka "Essence of Failure ," Tokyo: Diamond-Sha, 1984
Figure 6-7 Bank of Tokyo-Mitsubishi, Americas, Corporate Strategy Map Foundation
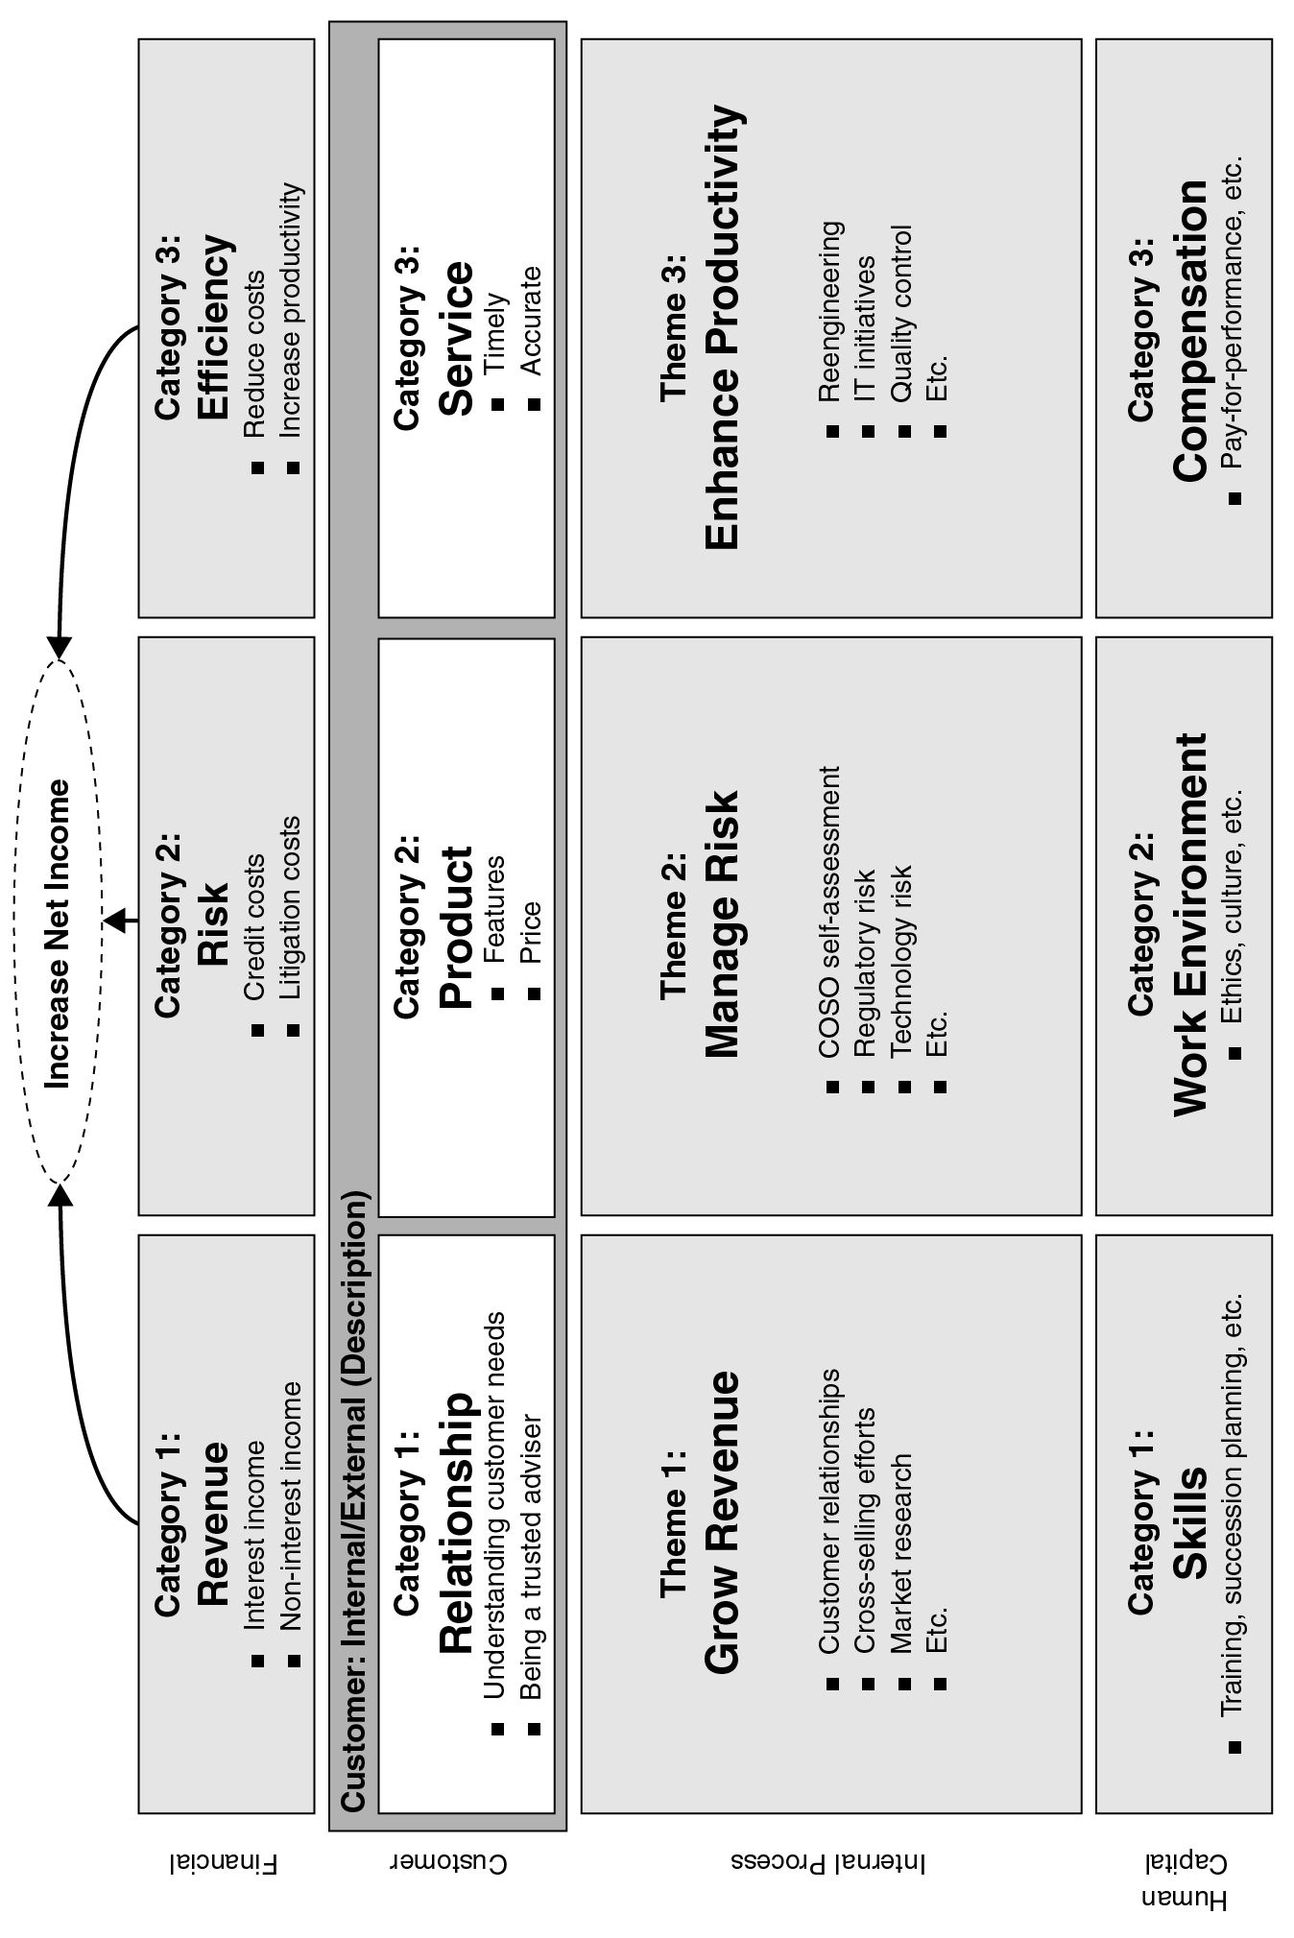
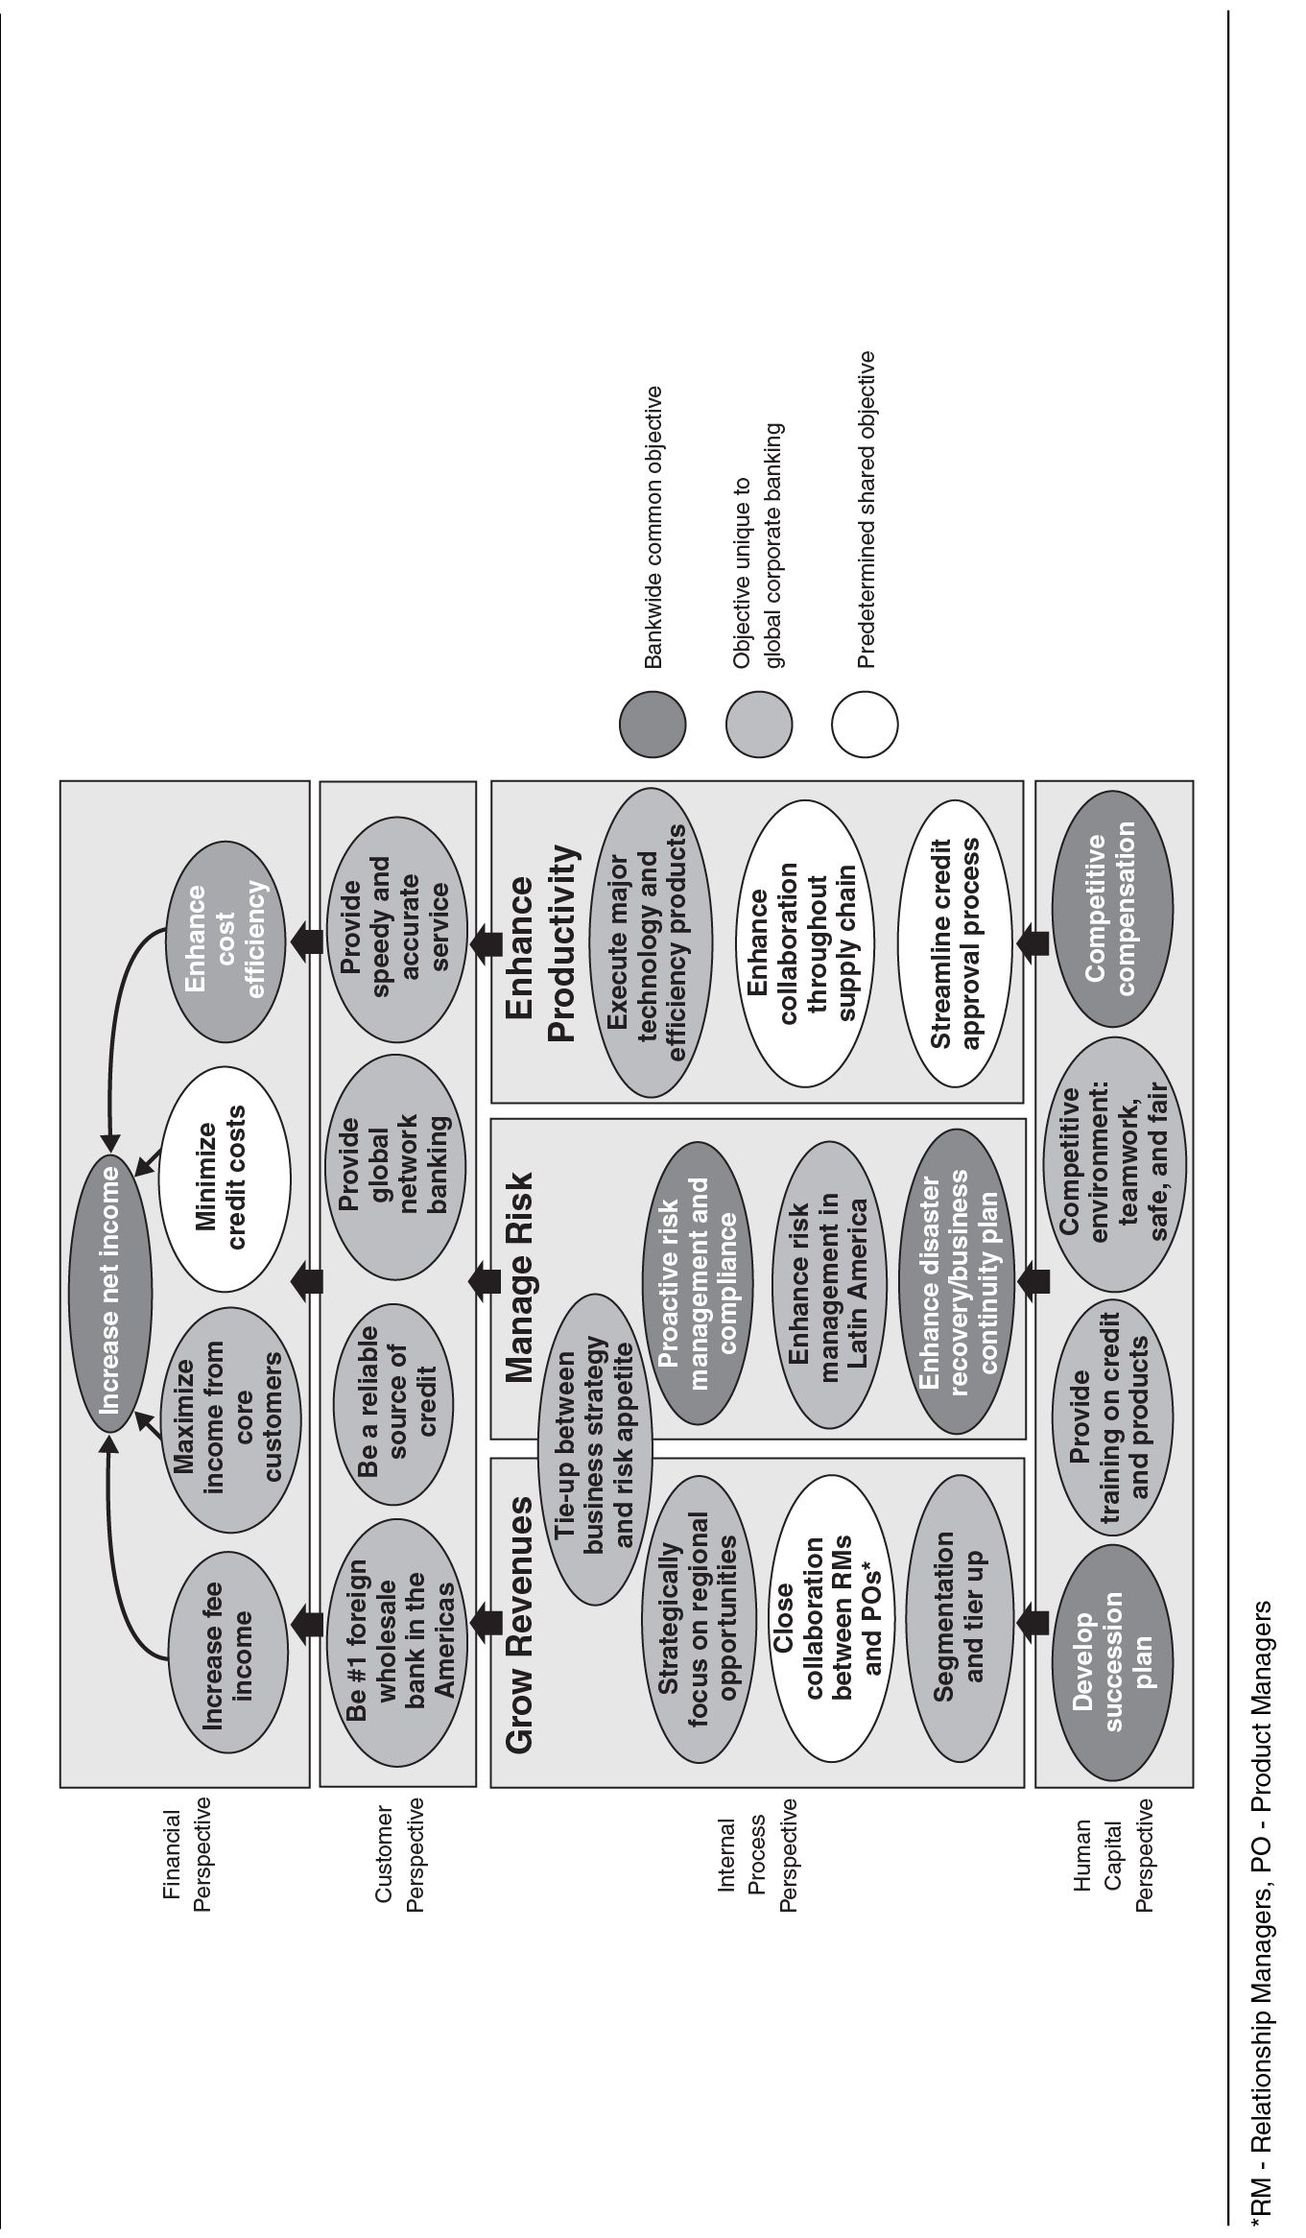
The team introduced one more feature to ensure that each group recognized interdependencies with other units and to incorporate these on their revised scorecards. Each unit would code each objective in its revised Strategy Map as falling into one of three categories:
| Type | Definition | Example |
|---|---|---|
| Common | Bankwide objectives, mandated throughout the organization on every scorecard | “Enhance cost efficiency" (financial perspective objective) |
| Shared | Interdivisional objectives shared between two or more units that were expected to cooperate to achieve the result | “Streamline credit approval process” (internal perspective operational efficiency objective) |
| Unique | Intradivisional objectives describing an activity expected to be fulfilled independently by that group | “Maintain knowledge of your customer files” (internal risk management theme objective for treasury) |
For example, the shared objective “streamline the credit approval process” required the credit analysis group to work closely with the business development group. In the past, these two groups had operated independently. The credit analysis group saw as its objective, naturally, the need to minimize credit losses. Consequently, the credit approval group systematically turned down the new business being generated by the business development group. The new objective, shared between the two groups, communicated that the proper goal was to manage risk, not to eliminate it. For effective risk management, both business development and credit approval had to agree on criteria for acceptable risks so that new business could quickly and predictably be approved.
Each group used the strategic foundation of Figure 6-7 as a starting point to create a customized version for its situation. Each group rebuilt its Strategy Map so that its objectives now corresponded to the strategic themes in the corporate template, with each objective coded as to whether it was common across the corporation, shared with one or more other units, or unique to its own operations.
Figure 6-8 shows an example of a revised Strategy Map for the global corporate banking unit. The corporate template facilitated use of a centralized risk-management process across all units (as discussed in Chapter 4). The groups completed this process during the third quarter of 2002, and by the fourth quarter, the Balanced Scorecard management system was in place and operating.
Figure 6-8 Redisigned BTMHQA Strategy Map (Example Banking Unit)
By doing the project in the unusual sequence of business groups → corporate → business groups, the organization increased the time to reach an operational system to fifteen months. But the project sequence corresponded well with the corporate culture—which favored strategy emerging from the business groups, rather than corporate—so by the time the system was up and running, it was well accepted throughout the corporation.
News of the success of the Balanced Scorecard project in the Americas soon reached Tokyo, and in 2004 the worldwide corporate headquarters of Bank of Tokyo-Mitsubishi launched its own Balanced Scorecard project.
SUMMARY
An organization can cascade the Balanced Scorecard and Strategy Map management system top-down or bottom-up, but ultimately scorecard reporting, analysis, and decision making should be flowing in both directions. Starting with an enterprise Strategy Map and BSC is the textbook approach for aligning middle- and lower-level organizational units with corporate-level strategy. But many enterprises choose to start the scorecard at a business unit level to test and validate the concept and gain support from line and functional managers before deploying it enterprise-wide.
Most organizations eventually use an iterative process, starting with corporate guidelines for business unit Strategy Maps and scorecards but using the ideas emanating from the business units to revise the corporate map and scorecard. Pushing the scorecard down through the organization too hard and too early could lead to resentment and a backlash. Most organizations have found that flexibility is the key ingredient during the early stages of cascading. Once an organization is using the tool—following a process of regularly reporting on and talking about strategy—imposing corporate priorities from the top down becomes more acceptable.