Chapter 2: The Structure and Synthesis of Process Flow Diagrams
WHAT YOU WILL LEARN
The hierarchy of chemical process design
The structure of continuous chemical processes
The differences between batch and continuous processes
When looking at a process flow diagram (PFD) for the first time, it is easy to be confused or overwhelmed by the complexity of the diagram. The purpose of this chapter is to show that the evolution of every process follows a similar path. The resulting processes will often be quite different, but the series of steps that have been followed to produce the final processes are similar. Once the path or evolution of the structure of processes has been explained and is understood, the procedure for understanding existing PFDs is also made simpler. Another important benefit of this chapter is to provide a framework to generate alternative PFDs for a given process.
2.1 Hierarchy of Process Design
Before discussing the steps involved in the conceptual design of a process, it should be noted that often the most important decision in the evolution of a process is the choice of which chemical syntheses or routes should be investigated to produce a desired product. The identification of alternative process chemistries should be done at the very beginning of any conceptual design. The conceptual design and subsequent optimization of a process are “necessary conditions” for any successful new process. However, the greatest improvements (savings) associated with chemical processes are most often due to changes, sometimes radical changes, to the chemical pathway used to produce the product. Most often, there are at least two viable ways to produce a given chemical. These alternative routes may require different raw materials and may produce different by-products. The cost of the raw materials, the value of the by-products, the complexity of the synthesis, and the environmental impact of any waste materials and pollutants produced must be taken into account when evaluating alternative synthesis routes.
Douglas [1, 2], among others, has proposed a hierarchical approach to conceptual process design. In this approach, the design process follows a series of decisions and steps. The order in which these decisions are made forms the hierarchy of the design process. These decisions are listed as follows:
Decide whether the process will be batch or continuous.
Identify the input/output structure of the process.
Identify and define the recycle structure of the process.
Identify and design the general structure of the separation system.
Identify and design the heat-exchanger network or process energy recovery system.
In designing a new process, Steps 1 through 5 are followed in that order. Alternatively, by looking at an existing process, and working backward from Step 5, it is possible to eliminate or greatly simplify the PFD. Hence, much about the structure of the underlying process can be determined.
This five-step design algorithm will now be applied to a chemical process. Each of the steps is discussed in some detail, and the general philosophy about the decision-making process will be covered. However, because Steps 4 and 5 require extensive discussion, these will be covered in separate chapters (Chapter 12 for separations, and Chapter 15 for energy recovery).
2.2 Step 1—Batch Versus Continuous Process
It should be pointed out that there is a difference between a batch process and a batch (unit) operation. Indeed, there are very few, if any, processes that use only continuous operations. For example, most chemical processes described as continuous receive their raw material feeds and ship their products to and from the plant in rail cars, tanker trucks, or barges. The unloading and loading of these materials are done in a batch manner. Indeed, the demarcation between continuous and batch processes is further complicated by situations when plants operate continuously but feed or receive material from other process units within the plant that operate in a batch mode. Such processes are often referred to as semi-batch. A batch process is one in which a finite quantity (batch) of product is made during a period of a few hours or days. The batch process most often consists of metering feed(s) into a vessel followed by a series of unit operations (mixing, heating, reaction, distillation, etc.) taking place at discrete scheduled intervals. This is then followed by the removal and storage of the products, by-products, and waste streams. The equipment is then cleaned and made ready for the next process. Production of up to 100 different products from the same facility has been reported [3]. This type of operation is in contrast to continuous processes, in which feed is sent continuously to a series of equipment, with each piece usually performing a single unit operation. Products, by-products, and waste streams leave the process continuously and are sent to storage or for further processing.
There are a number of considerations to weigh when deciding between batch and continuous processes, and some of the more important of these are listed in Table 2.1. As this table indicates, there are many things to consider when making the decision regarding batch versus continuous operation. Probably the most important of these are size and flexibility. If it is desired to produce relatively small quantities, less than approximately 500 tonne/y [1], of a variety of different products using a variety of different feed materials, then batch processing is probably the correct choice. For large quantities, greater than 5000 tonne/y of product [1], using a single or only a few raw materials, then a continuous process is probably the best choice. There are many trade-offs between the two types of processes. However, like most things, it boils down to cost. For a batch process compared to the equivalent continuous process, the capital investment is usually much lower because the same equipment can be used for multiple unit operations and can be reconfigured easily for a wide variety of feeds and products. On the other hand, operating labor costs and utility costs tend to be much higher. Recent developments in batch processing have led to the concept of the “pipeless batch process” [4]. In this type of operation, equipment is automatically moved to different workstations at which different processes are performed. For example, a reactor may be filled with raw materials and mixed at station 1, moved to station 2 for heating and reaction, to station 3 for product separation, and finally to station 4 for product removal. The workstations contain a variety of equipment to perform functions such as mixing, weighing, heating/cooling, filtration, and so on. This modular approach to the sequencing of batch operations greatly improves productivity and eases the scheduling of different events in the overall process.
Table 2.1 Some Factors to Consider When Deciding between Batch and Continuous Processes
Factor |
Advantages/Disadvantages for Batch Processes |
Advantages/Disadvantages for Continuous Processes |
Size |
Smaller throughput favors batch operations. As throughput increases, the required size of the process equipment increases, and the technical difficulties of moving large amounts of chemicals from equipment to equipment rapidly increase. |
Economies of scale favor continuous processes for large throughput. |
Batch Accountability/Product Quality |
When the product quality of each batch of material must be verified and certified, batch operations are preferred. This is especially true for pharmaceutical and food products. The manufacture of these products is strictly monitored by the Food and Drug Administration (FDA). If reworking (reprocessing) of off-specification product is usually not permitted, small batches are favored. |
Continuous or periodic testing of product quality is carried out, but some potentially large quantities of off-specification product can be produced. If off-specification material may be blended or stored in dump/slop tanks and reworked through the process when the schedule permits, continuous processes are favored. |
Operational Flexibility |
Often the same equipment can be used for multiple operations—for example, a stirred tank can be used as a mixer, then a reactor, and then as a stage of a mixer-settler for liquid-liquid extraction. |
Operational flexibility can be built in to continuous processes but often leads to inefficient use of capital. Equipment not required for one process but needed for another may sit idle for months. Often continuous processes are designed to produce a fixed suite of products from a well-defined feed material. If market forces change the feed/product availability or demand, then the plant will often be retrofitted to accommodate the change. |
Standardized Equipment—Multiple Products |
Often batch processes can be easily modified to produce several different products using essentially the same equipment. Examples of batch plants that can produce 100 different products are known [3]. For such processes the optimal control and sequencing of operations are critical to the success of such a plant. |
The product suite or slate produced from continuous processes is usually fixed. Equipment tends to be designed and optimized for a single or small number of operating conditions. |
Processing Efficiency |
Operation of batch processes requires strict scheduling and control. Because different products are scheduled back-to-back, changes in schedules have a ripple effect and may cause serious problems with product availability for customers. If the same equipment is used to produce many different products, then this equipment will not be optimized for any one product. Energy integration is usually not possible, so utility usage tends to be higher than for continuous processes. Separation and reuse of raw materials are more difficult than for continuous processes. |
Generally, as throughput increases, continuous processes become more efficient. For example, fugitive energy losses are reduced, and rotating equipment (pumps, compressors, etc.) operates with higher efficiency. Recycle of unused reactants and the integration of energy within the process or plant are standard practices and relatively easy to achieve. |
Maintenance and Operating Labor |
There are higher operating labor costs in standard batch plants due to equipment cleaning and preparation time. These costs have been shown to be reduced for the so-called pipeless batch plants [4]. |
For the same process, operating labor will be lower for continuous processes. |
Feedstock Availability |
Batch operations are favored when feedstock availability is limited, for example, seasonally. Canneries and wineries are examples of batch processing facilities that often operate for only part of the year. |
Continuous plants tend to be large and need to operate throughout the year to be profitable. The only way that seasonal variations in feeds can be accommodated is through the use of large storage facilities that are very expensive. |
Product Demand |
Seasonal demand for products such as fertilizers, gas-line antifreeze, deicing chips for roads and pavements, and so on, can be easily accommodated. Because batch plants are flexible, other products can be made during the off-season. |
It is difficult to make other products during the off-season. However, similar but different products—for example, a family of solvents— can be produced using the same processes through a series of campaigns at different times during the year. Each campaign may last several months. |
Rate of Reaction to Produce Products |
Batch operations favor processes that have very slow reaction rates and subsequently require long residence times. Examples include fermentation, aerobic and anaerobic wastewater treatment, and many other biological reactions. |
Very slow reactions require very large equipment. The flow through this equipment will be slow, and dispersion can be a problem if very high conversion is desired and plug flow is required. |
Equipment Fouling |
When there is significant equipment fouling, batch operations are favored because cleaning of equipment is always a standard operating procedure in a batch process and can be accommodated easily in the scheduling of the process. |
Significant fouling in continuous operations is a serious problem and is difficult to handle. Operating identical units in parallel, one on-line and the other off-line for cleaning, can solve this problem. However, capital investment is higher, additional labor is required, and safety problems are more likely. |
Safety |
Generally, worker exposure to chemicals and operator error will be higher (per pound of product) than for continuous processes. Operator training in chemical exposure and equipment operation is critical. |
Large chemical plants operating continuously have excellent safety records [6], and safety procedures are well established. Operator training is still of great importance, but many of the risks associated with operating equipment containing chemicals are eliminated. |
Controllability |
Controllability of batch processes using the same equipment for different unit operations and sometimes to produce different products may be difficult. The efficient scheduling of equipment becomes very important. The control used for this scheduling is complicated [3]. |
Generally, continuous processes are easier to control. Also, more work and research have been done for these processes. However, for complicated and highly integrated (energy and/or raw materials) plants, the control becomes complex, and operational flexibility is greatly reduced. |
Finally, it is important to recognize the role of pilot plants in the development of processes. It has been long understood that what works well in the laboratory often does not work as well on the large scale. Of course, much of the important preliminary work associated with catalyst development and phase equilibrium is most efficiently and inexpensively completed in the laboratory. However, problems associated with trace quantities of unwanted side products, difficult material handling problems, and multiple reaction steps are not easily scaled up from laboratory-scale experiments. In such cases, specific unit operations or the entire process may be “piloted” to gain better insight into the proposed full-scale operation. Often, this pilot plant work is carried out in batch equipment in order to reduce the inventory of raw materials. Sometimes, the pilot plant serves the dual purpose of testing the process at an intermediate scale and producing enough material for customers and other interested parties to test. The role and importance of pilot plants are covered in detail by Lowenstein [5].
2.3 Step 2—The Input/Output Structure of the Process
Although all processes are different, there are common features of each. The purpose of this section is to investigate the input/output structure of the process. The inputs represent feed streams and the outputs are product streams, which may be desired products, by-products, or waste streams.
2.3.1 Process Concept Diagram
The first step in evaluating a process route is to construct a process concept diagram. Such a diagram uses the stoichiometry of the main reaction pathway to identify the feed and product chemicals. The first step to construct such a diagram is to identify the chemical reaction or reactions taking place within the process. The balanced chemical reaction(s) form the basis for the overall process concept diagram. Figure 2.1 shows this diagram for the toluene hydrodealkylation process discussed in Chapter 1. It should be noted that only chemicals taking place in the reaction are identified on this diagram. The steps used to create this diagram are as follows:
A single “cloud” is drawn to represent the concept of the process. Within this cloud the stoichiometry for all reactions that take place in the process is written. The normal convention of the reactants on the left and products on the right is used.
The reactant chemicals are drawn as streams entering from the left. The number of streams corresponds to the number of reactants (two). Each stream is labeled with the name of the reactant (toluene and hydrogen).
Product chemicals are drawn as streams leaving to the right. The number of streams corresponds to the number of products (two). Each stream is labeled with the name of the product (benzene and methane).
Seldom does a single reaction occur, and unwanted side reactions must be considered. All reactions that take place and the reaction stoichiometry must be included. The unwanted products are treated as by-products and must leave along with the product streams shown on the right of the diagram.
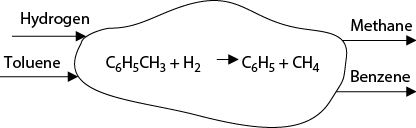
Figure 2.1 Input/Output Structure of the Process Concept Diagram for the Toluene Hydrodealkylation Process
2.3.2 The Input/Output Structure of the Process Flow Diagram
If the process concept diagram represents the most basic or rudimentary representation of a process, then the process flow diagram (PFD) represents the other extreme. However, the same input/output structure is seen in both diagrams. The PFD, by convention, shows the process feed stream(s) entering from the left and the process product stream(s) leaving to the right.
There are other auxiliary streams shown on the PFD, such as utility streams that are necessary for the process to operate but that are not part of the basic input/output structure. Ambiguities between process streams and utility streams may be eliminated by starting the process analysis with an overall input/output concept diagram.
Figure 2.2 shows the basic input/output structure for the PFD (see Figure 1.3). The input and output streams for the toluene HDA PFD are shown in bold. Both Figures 2.1 and 2.2 have the same overall input/output structure. The input streams labeled toluene and hydrogen shown on the left in Figure 2.1 appear in the streams on the left of the PFD in Figure 2.2. In Figure 2.2, these streams contain the reactant chemicals plus other chemicals that are present in the raw feed materials. These streams are identified as Streams 1 and 3, respectively. Likewise, the output streams, which contain benzene and methane, must appear on the right on the PFD. The benzene leaving the process, Stream 15, is clearly labeled, but there is no clear identification for the methane. However, by referring to Table 1.5 and looking at the entry for Stream 16, it can be seen that this stream contains a considerable amount of methane. From the stoichiometry of the reaction, the amount of methane and benzene produced in the process should be equal (on a mole basis). This is easily checked from the data for Streams 1, 3, 15, and 16 (Table 1.5) as follows:
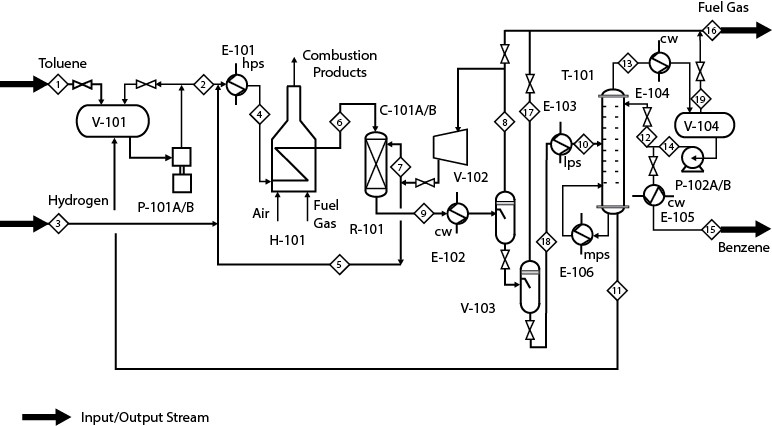
At times, it will be necessary to use the process conditions or the flow table associated with the PFD to determine where a chemical is to be found.
There are several important factors to consider in analyzing the overall input/output structure of a PFD. Some of these factors are listed below.
Chemicals entering the PFD from the left that are not consumed in the chemical reactor are either required to operate a piece of equipment or are inert material that simply passes through the process. Examples of chemicals required but not consumed include catalyst makeup, solvent makeup, and inhibitors. In addition, feed materials that are not pure may contain inert chemicals. Alternatively, chemicals may be added in order to control reaction rates, to keep the reactor feed outside of the explosive limits, or to act as a heat sink or heat source to control temperatures.
Any chemical leaving a process must either have entered in one of the feed streams or have been produced by a chemical reaction within the process.
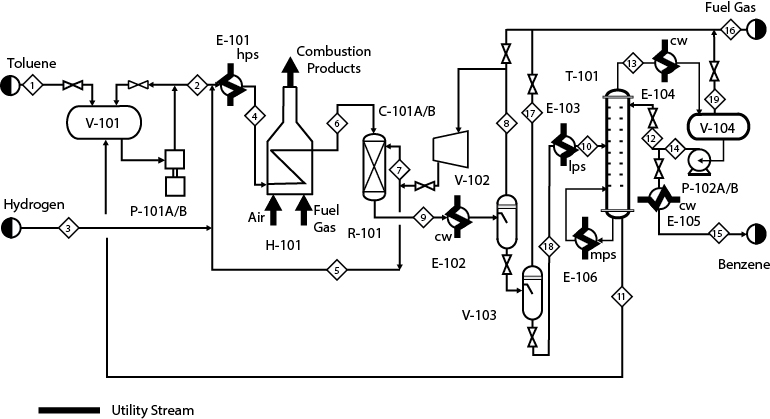
Utility streams are treated differently from process streams. Utility streams, such as cooling water, steam, fuel, and electricity, rarely directly contact the process streams. They usually provide or remove thermal energy or work.
Figure 2.3 identifies, with bold lines, the utility streams in the benzene process. It can be seen that two streams—fuel gas and air—enter the fired heater. These are burned to provide heat to the process, but never come in direct contact (that is, mix) with the process streams. Other streams such as cooling water and steam are also highlighted in Figure 2.3. All these streams are utility streams and are not extended to the left or right boundaries of the diagram, as were the process streams. Other utility streams are also provided but are not shown in the PFD. The most important of these is electrical power, which is most often used to run rotating equipment such as pumps and compressors. Other utilities, such as plant air, instrument air, nitrogen for blanketing of tanks, process water, and so on, are also consumed.
2.3.3 The Input/Output Structure and Other Features of the Generic Block Flow Process Diagram
The generic block flow diagram is intermediate between the process concept diagram and the PFD. This diagram illustrates features, in addition to the basic input/output structure, that are common to all chemical processes. Moreover, in discussing the elements of new processes it is convenient to refer to this diagram because it contains the logical building blocks for all processes. Figure 2.4(a) provides a generic block flow process diagram that shows a chemical process broken down into six basic areas or blocks. Each block provides a function necessary for the operation of the process. These six blocks are as follows:
Reactor feed preparation
Reactor
Separator feed preparation
Separator
Recycle
Environmental control
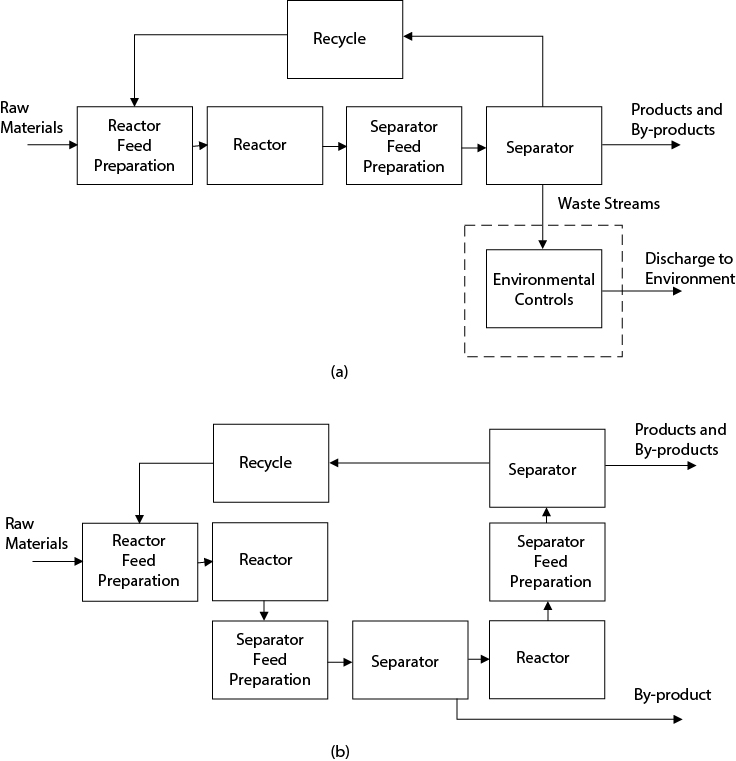
Figure 2.4 (a) The Six Elements of the Generic Block Flow Process Diagram; (b) A Process Requiring Multiple Process Blocks
An explanation of the function of each block in Figure 2.4(a) is given below.
Reactor Feed Preparation Block: In most cases, the feed chemicals entering a process come from storage. These chemicals are most often not at a suitable concentration, temperature, and pressure for optimal performance in the reactor. The purpose of the reactor feed preparation section is to change the conditions of these process feed streams as required in the reactor.
Reactor Block: All chemical reactions take place in this block. The streams leaving this block contain the desired product(s), any unused reactants, and a variety of undesired by-products produced by competing reactions.
Separator Feed Preparation Block: The output stream from the reactor, in general, is not at a condition suitable for the effective separation of products, by-products, waste streams, and unused feed materials. The units contained in the separator feed preparation block alter the temperature and pressure of the reactor output stream to provide the conditions required for the effective separation of these chemicals.
Separator Block: The separation of products, by-products, waste streams, and unused feed materials is accomplished via a wide variety of physical processes. The most common of these techniques are typically taught in unit operations and/or separations classes—for example, distillation, absorption, and extraction.
Recycle Block: The recycle block represents the return of unreacted feed chemicals, separated from the reactor effluent, back to the reactor for further reaction. Because the feed chemicals are not free, it most often makes economic sense to separate the unreacted reactants and recycle them back to the reactor feed preparation block. Normally, the only equipment in this block is a pump or compressor and perhaps a heat exchanger.
Environmental Control Block: Virtually all chemical processes produce waste streams. These include gases, liquids, and solids that must be treated prior to being discharged into the atmosphere, sequestered in landfills, and so on. These waste streams may contain unreacted materials, chemicals produced by side reactions, fugitive emissions, and impurities coming in with the feed chemicals and the reaction products of these chemicals. Not all of the unwanted emissions come directly from the process streams. An example of an indirect source of pollution results when the energy needs of the plant are met by burning high sulfur oil. The products of this combustion include the pollutant sulfur dioxide, which must be removed before the gaseous combustion products can be vented to the atmosphere. The purpose of the environmental control block is to reduce significantly the waste emissions from a process and to render all nonproduct streams harmless to the environment.
It can be seen that a dashed line has been drawn around the block containing the environmental control operations. This identifies the unique role of environmental control operations in a chemical plant complex. A single environmental control unit may treat the waste from several processes. For example, the wastewater treatment facility for an oil refinery might treat the wastewater from as many as 20 separate processes. In addition, the refinery may contain a single stack and incinerator to deal with gaseous wastes from these processes. Often, this common environmental control equipment is not shown in the PFD for an individual process, but is shown on a separate PFD as part of the “off-site” section of the plant. Just because the environmental units do not appear on the PFD does not indicate that they do not exist or that they are unimportant.
Each of the process blocks may contain several unit operations. Moreover, several process blocks may be required in a given process. An example of multiple process blocks in a single process is shown in Figure 2.4(b). In this process, an intermediate product is produced in the first reactor and is subsequently separated and sent to storage. The remainder of the reaction mixture is sent to a second stage reactor in which product is formed. This product is subsequently separated and sent to storage, and unused reactant is also separated and recycled to the front end of the process. Based upon the reason for including the unit, each unit operation found on a PFD can be placed into one of these blocks. Although each process may not include all the blocks, all processes will have some of these blocks.
In Example 2.6, at the end of this chapter, different configurations will be investigated for a given process. It will be seen that these configurations are most conveniently represented using the building blocks of the generic block flow diagram.
2.3.4 Other Considerations for the Input/Output Structure of the Process Flowsheet
The effects of feed impurities and additional flows that are required to carry out specific unit operations may have a significant impact on the structure of the PFD. These issues are covered in the following section.
Feed Purity and Trace Components. In general, the feed streams entering a process do not contain pure chemicals. The option always exists to purify further the feed to the process. The question of whether this purification step should be performed can be only answered using a detailed economic analysis. However, some commonsense heuristics may be used to choose a good base case or starting point. The following heuristics are modified from Douglas [1]:
If the impurities are not present in large quantities (say, <10%–20%) and these impurities do not react to form by-products, then do not separate them prior to feeding to the process. For example, the hydrogen fed to the toluene HDA process contains a small amount of methane (5 mol%—see Stream 3 in Table 1.5). Because the methane does not react (it is inert) and it is present as a small quantity, it is probably not worth considering separating it from the hydrogen.
If the separation of the impurities is difficult (for example, an impurity forms an azeotrope with the feed or the feed is a gas at the feed conditions), then do not separate them prior to feeding to the process. For example, again consider the methane in Stream 3. The separation of methane and hydrogen is relatively expensive (see Example 2.3) because it involves low temperature and/or high pressure. This fact, coupled with the reasons given above, means that separation of the feed would not normally be attempted.
If the impurities foul or poison the catalyst, then purify the feed. For example, one of the most common catalyst poisons is sulfur. This is especially true for catalysts containing Group VIII metals such as iron, cobalt, nickel, palladium, and platinum [7]. In the steam reformation of natural gas (methane) to produce hydrogen, the catalyst is rapidly poisoned by the small amounts of sulfur in the feed. A guard bed of activated carbon (or zinc oxide) is placed upstream of the reactor to reduce the sulfur level in the natural gas to the low ppm level, which reduces the catalyst poisoning to an acceptable level.
If the impurity reacts to form difficult-to-separate or hazardous products, then purify the feed. For example, in the manufacture of isocyanates for use in the production of polyurethanes, the most common synthesis path involves the reaction of phosgene with the appropriate amine [8]. Because phosgene is a highly toxic chemical, all phosgene is manufactured on-site via the reaction of chlorine and carbon monoxide:
If carbon monoxide is not readily available (by pipeline), then it must be manufactured via the steam reformation of natural gas. The following equation shows the overall main reaction (carbon dioxide may also be formed in the process, but it is not considered here):
The question to ask is, at what purity must the carbon monoxide be fed to the phosgene unit? The answer depends on what happens to the impurities in the CO. The main impurity is hydrogen. The hydrogen reacts with the chlorine to form hydrogen chloride, which is difficult to remove from the phosgene, is highly corrosive, and is detrimental to the isocyanate product. With this information, it makes more sense to remove the hydrogen to the desired level in the carbon monoxide stream rather than send it through with the CO and cause more separation problems in the phosgene unit and further downstream. Acceptable hydrogen levels in carbon monoxide feeds to phosgene units are less than 1%.
If the impurity is present in large quantities, then purify the feed. This heuristic is fairly obvious because significant additional work and heating/cooling duties are required to process the large amount of impurity. Nevertheless, if the separation is difficult and the impurity acts as an inert, then separation may still not be warranted. An obvious example is the use of air, rather than pure oxygen, as a reactant. Because nitrogen often acts as an inert compound, the extra cost of purifying the air is not justified compared with the lesser expense of processing the nitrogen through the process. An added advantage of using air, as opposed to pure oxygen, is the heat-absorbing capacity of nitrogen, which helps moderate the temperature rise of many highly exothermic oxidation reactions.
Addition of Feeds Required to Stabilize Products or Enable Separations. Generally, product specifications are given as a series of characteristics that the product stream must meet or exceed. Clearly, the purity of the main chemical in the product is the major concern. However, other specifications such as color, density or specific gravity, turbidity, maximum amount of certain trace chemicals, and so on, may also be specified. Often many of these specifications can be met in a single piece or train of separation equipment. However, if the product stream is, for example, reactive or unstable, then additional stabilizing chemicals may need to be added to the product before it goes to storage. These stabilizing chemicals are additional feed streams to the process. The same argument can be made for other chemicals such as solvents or catalysts that are effectively consumed in the process. If a solvent such as water or an organic chemical is required to make a separation take place—for example, absorption of a solvent-soluble chemical from a gas stream—then this solvent is an additional feed to the process (see Appendix B.5—the production of maleic anhydride via the partial oxidation of propylene). Accounting for these chemicals both in feed costs and in the overall material balance (in the product streams) is very important.
Inert Feed Material to Control Exothermic Reactions. In some cases, it may be necessary to add additional inert feed streams to the process in order to control the reactions taking place. Common examples of this are partial oxidation reactions of hydrocarbons. For example, consider the partial oxidation of propylene to give acrylic acid, an important chemical in the production of acrylic polymers. The feeds consist of nearly pure propylene, air, and steam. The basic reactions that take place are as follows:
All these reactions are highly exothermic, not limited by equilibrium, and potentially explosive. In order to eliminate or reduce the potential for explosion, steam is fed to the reactor to dilute the feed and provide thermal ballast to absorb the heat of reaction and make control easier. In some processes, enough steam (or other inert stream) is added to move the reaction mixture out of the flammability limits, thus eliminating the potential for explosion. The steam (or other inert stream) is considered a feed to the process, must be separated, and leaves as a product, by-product, or waste stream.
Addition of Inert Feed Material to Control Equilibrium Reactions. Sometimes it is necessary to add an inert material to shift the equilibrium of the desired reaction. Consider the production of styrene via the catalytic dehydrogenation of ethyl benzene:
This reaction takes place at high temperature (600°C–750°C) and low pressure (<1 bar) and is limited by equilibrium. The ethyl benzene is co-fed to the reactor with superheated steam. The steam acts as an inert in the reaction and both provides the thermal energy required to preheat the ethyl benzene and dilutes the feed. As the steam-to-ethyl benzene ratio increases, the equilibrium shifts to the right (Le Chatelier’s principle) and the single-pass conversion increases. The optimum steam-to-ethyl benzene feed ratio is based on the overall process economics.
2.3.5 What Information Can Be Determined Using the Input/Output Diagram for a Process?
The following basic information, obtained from the input/output diagram, is limited but nevertheless very important:
Basic economic analysis on profit margin
What chemical components must enter with the feed and leave as products
All the reactions, both desired and undesired, that take place
The potential profitability of a proposed process can be evaluated and a decision whether to pursue the process can be made. As an example, consider the profit margin for the toluene HDA process given in Figure 2.1.
The profit margin will be formally introduced in Chapter 10, but it is defined as the difference between the value of the products and the cost of the raw materials. To keep things simple the stoichiometry of the reaction is used as the basis. If the profit margin is a negative number, then there is no potential to make money. The profit margin for the HDA process is given in Example 2.1.
Evaluate the profit margin for the HDA process.
From Tables 8.3 and 8.4, the following prices for raw materials and products are found:
Benzene = $1.196/kg
Toluene = $1.019/kg
Natural gas (methane, MW = 16) = $0.1119/std m3 = $0.165/kg
Hydrogen = $0.381/kg (based on the same equivalent energy cost as natural gas)
Using 1 kmol of toluene feed as a basis
Cost of Raw Materials
92 kg of Toluene = (92 kg)($1.019/kg) = $93.75
2 kg of Hydrogen = (2 kg)($0.381/kg) = $0.76
Value of Products
78 kg of Benzene = (78 kg)($1.196/kg) = $93.29
16 kg of Methane = (16 kg)($0.165/kg) = $2.64
Profit Margin
Profit Margin = (93.29 + 2.64) − (93.75 + 0.76) = $1.42 or $0.0154/kg toluene
Based on this result, it is concluded that further investigation of this process may be warranted.
The results in Example 2.1 show that the profit margin for benzene using the HDA process are positive but small. It is unlikely that when the costs of equipment, utilities, and all other operating costs are correctly accounted for that production of benzene via the HDA process would be profitable. Nevertheless, benzene has been produced for the last 50 years and is a viable starting material for a host of petrochemical products. How is this possible? It must be concluded that benzene can be produced via at least one other route, which is less sensitive to changes in the price of toluene, benzene, and natural gas. One such commercial process is the disproportionation or transalkylation of toluene to produce benzene and a mixture of para-, ortho-, and meta-xylene via the following reaction:
The profit margin for this process is given in Example 2.2.
Evaluate the profit margin for the toluene disproportionation process.
From Table 8.4:
Mixed Xylenes = $1.06/kg
Using 2 kmols of toluene feed as a basis
Cost of Raw Materials
184 kg of Toluene = (184 kg)($1.019/kg) = $187.50
Value of Products
78 kg of Benzene = (78 kg)($1.196/kg) = $93.29
106 kg of Xylene = (106 kg)($1.06/kg) = $112.36
Margin
Profit Margin = 93.29 + 112.36 − 187.50 = $18.15 or $0.099/kg toluene feed
From the results of Example 2.2, the profit margin for the production of benzene via the disproportionation of toluene is greater than the toluene HDA process. In addition, a closer look at the cost of purified xylenes (from Table 8.4) shows that these purified xylenes are considerably more valuable (ranging in value from $1.235 to $2.91/kg) than the mixed xylene stream ($1.06/kg). Therefore, the addition of a xylene purification section to the disproportionation process might well yield a significantly more profitable process. Historically, the prices of toluene and benzene fluctuate in phase with each other. In general, toluene disproportionation has been the preferred process for benzene production over the last two decades.
In carrying out Examples 2.1 and 2.2, a single-point price for each chemical was used. In general in order to determine a more accurate margin for a process, cost data for the feed and product chemicals over a period of several years should be sought in order to get average values and then these values should be used to evaluate the margin. Another important point to note is that there are often two or more different chemical paths to produce a given product. These paths may all be technically feasible; that is, catalysts for the reactions and separation processes to isolate and purify the products probably exist. However, it is the costs of the raw materials that usually play the major role when deciding which process to choose.
2.4 Step 3—The Recycle Structure of the Process
The remaining three steps in building the process flow diagram basically involve the recovery of materials and energy from the process. It may be instructive to break down the operating costs for a typical chemical process. This analysis for the toluene process is given in Chapter 8, Example 8.10. From the results of Example 8.10, it can be seen that raw material costs (toluene and hydrogen) account for (87.398)/(114.6) × 100 = 76% of the total manufacturing costs. This value is typical for chemical processes. Peters and Timmerhaus [9] suggest that raw materials make up between 10% and 50% of the total operating costs for processing plants; however, due to increasing conservation and waste minimization techniques this estimate may be low, and an upper limit of 80% is more realistic. Because these raw materials are so valuable, it is imperative that unused reactants are separated and recycled. Indeed, high efficiency for raw material usage is a requirement of the vast majority of chemical processes. This is why the generic block flow process diagram (Figure 2.4) shows a recycle stream. However, the extent of recycling of unused reactants depends largely on the ease with which these unreacted raw materials can be separated (and purified) from the products that are formed within the reactor.
2.4.1 Efficiency of Raw Material Usage
It is important to understand the difference between single-pass conversion in the reactor, the overall conversion in the process, and the yield.
For the HDA process introduced in Chapter 1, the following values are obtained for the most costly reactant (toluene) from Table 1.5:
The single-pass conversion indicates how much of the toluene that enters the reactor is converted to benzene. The lower the single-pass conversion, the greater the recycle must be, assuming that the unreacted toluene can be separated and recycled. In terms of the overall economics of the process, the single-pass conversion will affect equipment size and utility flows, because both of these are directly affected by the amount of recycle. However, the raw material costs are not changed significantly, assuming that the unreacted toluene is separated and recycled.
The overall conversion indicates what fraction of the toluene in the feed to the process (Stream 1) is converted to products. For the hydrodealkylation process, it is seen that this fraction is high (99.3%). This high overall conversion is typical for chemical processes and shows that unreacted raw materials are not being lost from the process.
Finally the yield indicates what fraction of the reacted toluene ends up in the desired product: benzene. For this case, the yield is unity (within round-off error), and this is to be expected because no competing or side reactions were considered. In reality, there is at least one other significant reaction that can take place, and this may reduce the yield of toluene. This case is considered in Problem 2.1 at the end of the chapter. Nevertheless, yields for this process are generally very high. For example, Lummus [10] quotes yields from 98% to 99% for their DETOL hydrodealkylation process.
By looking at the conversion of the other reactant, hydrogen, it can be seen from the data in Table 1.5 that
Clearly these conversions are much lower than for toluene. The single-pass conversion is kept low because a high hydrogen-to-hydrocarbon ratio is desired everywhere in the reactor so as to avoid or reduce coking of the catalyst. However, the low overall conversion of hydrogen indicates poor raw material usage. Therefore, the questions to ask are “Why is the material usage for toluene so much better than for hydrogen?” and “How can the hydrogen usage be improved?” These questions can be answered by looking at the ease of separation of hydrogen and toluene from their respective streams and leads us to investigate the recycle structure of the process.
2.4.2 Identification and Definition of the Recycle Structure of the Process
There are basically three ways that unreacted raw materials can be recycled in continuous processes.
Separate and purify unreacted feed material from products and then recycle.
Recycle feed and product together and use a purge stream.
Recycle feed and product together and do not use a purge stream.
Separate and Purify. Through the ingenuity of chemical engineers and chemists, technically feasible separation paths exist for mixtures of nearly all commercially desired chemicals. Therefore, the decision on whether to separate the unreacted raw materials must be made purely from economic considerations. In general, the ease with which a given separation can be made is dependent on two principles.
First, for the separation process (unit operation) being considered, what conditions (temperature and pressure) are necessary to operate the process?
Second, for the chemical species requiring separation, are the differences in physical or chemical properties for the species, on which the separation is based, large or small?
Examples that illustrate these principles are given below.
For the HDA process, the reactor effluent, Stream 9, is cooled and separated in a two-stage flash operation. The liquid, Stream 18, contains essentially benzene and toluene. The combined vapor stream, Streams 8 and 17, contains essentially methane and hydrogen. In Example 2.3, methods to separate the hydrogen in these two streams are considered and are used to screen potential changes in the recycle structure of the HDA process.
For the separation of methane and hydrogen, first look at distillation:
Normal boiling point of methane = −161°C
Normal boiling point of hydrogen = −252°C
Separation should be easy using distillation due to the large difference in boiling points of the two components. However, in order to obtain a liquid phase, a combination of high pressure and very low temperature must be used. This will be very costly and suggests that distillation is not the best operation for this separation.
Absorption
It might be possible to absorb or scrub the methane from Streams 8 and 17 into a hydrocarbon liquid. In order to determine which liquids, if any, are suitable for this process, the solubility parameters for both methane and hydrogen in the different liquids must be determined. This information is available in Walas [11]. Because of the low boiling point of methane, a low temperature and high pressure would be required for effective absorption.
Pressure-Swing Adsorption
The affinity of a molecule to adhere (either chemically or physically) to a solid material is the basis of adsorption. In pressure-swing adsorption, the preferential adsorption of one species from the gas phase occurs at a given pressure, and the desorption of the adsorbed species is facilitated by reducing the pressure and allowing the solid to “de-gas.” Two (or more) beds operate in parallel, with one bed adsorbing and the other desorbing. The separation and purification of hydrogen contained in gaseous hydrocarbon streams could be carried out using pressure-swing adsorption. In this case, the methane would be preferentially adsorbed onto the surface of a sorbent, and the stream leaving the unit would contain a higher proportion of hydrogen than the feed. This separation could be applied to the HDA process.
Membrane Separation
Commercial membrane processes are available to purify hydrogen from hydrocarbon streams. This separation is facilitated because hydrogen passes more readily through certain membranes than does methane. This process occurs at moderate pressures, consistent with the operation of the HDA process. However, the hydrogen is recovered at a fairly low pressure and would have to be recompressed prior to recycling. This separation could be applied to the HDA process.
From Example 2.3, it can be seen that pressure-swing adsorption and membrane separation of the gas stream should be considered as viable process alternatives, but for the preliminary PFD for this process, no separation of hydrogen was attempted. In Example 2.4, the separation of toluene from a mixture of benzene and toluene is considered.
What process should be used in the separation of toluene and benzene?
Distillation
Normal boiling point of benzene = 80.1°C
Normal boiling point of toluene = 110.6 °C
Separation should be easy using distillation, and neither excessive temperatures nor pressures will be needed. This is a viable operation for the separation of benzene and toluene in the HDA process.
Economic considerations often make distillation the separation method of choice. The separation of benzene and toluene is routinely practiced through distillation and this is the preferred method in the preliminary PFD for this process.
Recycle Feed and Product Together with a Purge Stream. If separation of unreacted feed and products is not accomplished easily, then recycling both feed and product should be considered. In the HDA process, the methane product will act as an inert because it will not react with toluene. In addition, this process is not limited by equilibrium considerations; therefore, the reaction of methane and benzene to give toluene and hydrogen (the undesired path for this reaction), under the conditions used in this process, is not significant. It should be noted that for the case when a product is recycled with an unused reactant and the product does not react further, then a purge stream must be used to avoid the accumulation of product in the process. For the HDA process, the purge is the fuel gas containing the methane product and unused hydrogen, Stream 16, leaving the process. The recycle structure for the hydrogen and methane in the HDA process is illustrated in Figure 2.5.

Figure 2.5 Recycle Structure of Hydrogen Stream in Toluene Hydrodealkylation Process. Methane Is Purged from the System via Stream 16.
Recycle Feed and Product Together without a Purge Stream. This recycle scheme is feasible only when the product can react further in the reactor and therefore there is no need to purge it from the process. If the product does not react and it does not leave the system with the other products, then it would accumulate in the process, and steady-state operations could not be achieved. In the previous case, with hydrogen and methane, it was seen that the methane did not react further and that it was necessary to purge some of the methane and hydrogen in Stream 16 in order to prevent accumulation of methane in the system.
An example where this strategy could be considered is again given in the toluene HDA process. Up to this point, only the main reaction between toluene and hydrogen has been considered:
However, even when using a catalyst that is very specific to the production of benzene, some amount of side reaction will occur. For this process, the yield of toluene for commercial processes is on the order of 98% to 99%. Although this is high, it is still lower than the 100% that was originally assumed. A very small amount of toluene may react with the hydrogen to form small-molecule, saturated hydrocarbons, such as ethane, propane, and butane. More important, a proportion of the benzene reacts to give a two ring aromatic, diphenyl:
The primary separation between the benzene and toluene in T-101 (see Figure 2.1) will remain essentially unchanged, because the light ends (hydrogen, methane, and trace amounts of C2–C4 hydrocarbons) will leave in the flash separators (V-102 and V-103) or from the overhead reflux drum (V-104). However, the bottoms product from T-101 will now contain toluene and essentially all the diphenyl produced in the reactor, because it has a much higher boiling point than toluene. It is known that the benzene/diphenyl reaction is equilibrium limited at the conditions used in the reactor. Therefore, if the diphenyl is recycled with the toluene, it will simply build up in the recycle loop until it reaches its equilibrium value. At steady state, the amount of diphenyl entering the reactor in Stream 6 will equal the diphenyl in the reactor effluent, Stream 9. Because diphenyl reacts back to benzene, it can be recycled without purging it from the system. The changes to the structure of the process that would be required if diphenyl were produced are considered in Example 2.5.
Consider the following two process alternatives for the toluene HDA process when the side reaction of benzene to form diphenyl occurs.
Clearly for Alternative B, shown in Figure E2.5(b), an additional separator is required, shown here as a second distillation column T-102, along with the associated equipment (not shown) and extra utilities to carry out the separation. For Alternative A, shown in Figure E2.5(a), the cost of additional equipment is avoided, but the recycle stream (Stream 11) will be larger because it now contains toluene and diphenyl, and the utilities and equipment through which this stream passes (H-101, E-101, R-101, E-102, V-102, V-103, T-101, E-106) will all be greater. Which is the economically preferable alternative?

Figure E2.5(a) PFD for Alternative A in Example 2.5—Recycle of Diphenyl without Separation (E-101 and H-101 Not Shown)

Figure E2.5(b) PFD for Alternative B in Example 2.5—Recycle of Diphenyl with Separation (E-101 and H-101 Not Shown)
The answer depends upon the value of the equilibrium constant for the benzene-diphenyl reaction. If the equilibrium conversion of benzene is high, then there will be a large amount of diphenyl in the recycle and the costs to recycle this material will be high, and vice versa. The equilibrium constant for this reaction is given as
The exit conditions of the reactor can be estimated by assuming that the benzene-diphenyl reaction has reached equilibrium, a conservative assumption. Using this assumption and data from Table 1.5 for Stream 9, if x kmol/h of diphenyl is present in the reactor effluent, then
Solving for the only unknown gives x = 1.36 kmol/h. Thus, the toluene recycle, Stream 11, will be increased from 35.7 to 37.06 kmol/h, an increase of 4%, while the increases in Streams 4 and 6 will be approximately 0.1%. Based on this result, Alternative A will probably be less expensive than Alternative B.
2.4.3 Other Issues Affecting the Recycle Structure That Lead to Process Alternatives
There are many other issues that affect the recycle structure of the PFD. The use of excess reactant, the recycling of inert materials, and the control of an equilibrium reaction are some examples that are addressed in this section.
How Many Potential Recycle Streams Are There? Consider first the reacting species that are of value. These are essentially all reactants except air and maybe water. Each reacting species that does not have a single-pass conversion >99% should be considered as a potential recycle stream. The value of 99% is an arbitrarily high number, and it could be anywhere from 90% to >99%, depending on the cost of raw materials, the cost to separate and recycle unused raw materials, and the cost of disposing of any waste streams containing these chemicals.
How Does Excess Reactant Affect the Recycle Structure? When designing the separation of recycled raw materials, it is important to remember which reactant, if any, should be in excess and how much this excess should be. For the toluene HDA process, the hydrogen is required to be in excess in order to suppress coking reactions that foul the catalyst. The result is that the hydrogen:toluene ratio at the inlet of the reactor (from Table 1.5) is 735.4/144, or slightly greater than 5/1. This means that the hydrogen recycle loop must be large, and a large recycle compressor is required. If it were not for the fact that this ratio needs to be high, the hydrogen recycle stream, and hence the recycle compressor, could be eliminated.
How Many Reactors Are Required? The reasons for multiple reactors are as follows:
Approach to Equilibrium: The classic example is the synthesis of ammonia from hydrogen and nitrogen. As ammonia is produced in a packed-bed reactor, the heat of reaction heats the products and moves the reaction closer to equilibrium. By adding additional reactants between staged packed beds arranged in series, the concentration of the reactants is increased, and the temperature is decreased. Both these factors move the reaction away from equilibrium and allow the reaction to proceed further to produce the desired product, ammonia.
Temperature Control: If the reaction is mildly exothermic or endothermic, then internal heat transfer may not be warranted, and temperature control for gas-phase reactions can be achieved by adding a “cold (or hot) shot” between staged adiabatic packed beds of catalyst. This is similar to the ammonia converter described earlier. More information on the design of exothermic and endothermic reactions is given in Chapter 22.
Concentration Control: If one reactant tends to form by-products, then it may be advantageous to keep this reactant at a low concentration. Multiple side feeds to a series of staged beds or reactors may be considered. See Chapter 22 for more details.
Optimization of Conditions for Multiple Reactions: When several series reactions (A→R→S→T) must take place to produce the desired product (T) and these reactions require different catalysts and/or different operating conditions, then operating a series of staged reactors at different conditions may be warranted.
Do Unreacted Raw Material Streams Need to Be Purified Prior to Recycling? The next issue is whether the components need to be separated prior to recycle. For example, if distillation is used to separate products from unused reactants, and if two of the reactants lie next to each other in a list of relative volatility, then no separation of these products is necessary. They can be simply recycled as a mixed stream.
Is Recycling of an Inert Warranted? The components in the feed streams that do not react, that is, are inert, are considered next. Depending on the process, it may be worth recycling these streams. For example, consider the water feed to the absorber, Stream 8, in the acetone production process (Appendix B, Figure B.10.1). This water stream is used to absorb trace amounts of isopropyl alcohol and acetone from the hydrogen vent, Stream 5. After purification, the water leaves the process as a wastewater stream, Stream 15. This water has been purified in column T-1103 and contains only trace amounts of organics. An alternative process configuration would be to recycle this water back to the absorber. This type of pollution prevention strategy is discussed further in Chapter 27.
Can Recycling an Unwanted Product or an Inert Shift the Reaction Equilibrium to Produce Less of an Unwanted Product? Another example of recycling an inert or unwanted product is to use that material to change the conversion and selectivity of an equilibrium reaction. For example, consider the production of synthesis gas (H2 and CO) via the partial oxidation (gasification) of coal:
Coal, shown here simply as a mixture of carbon and hydrogen, is reacted with a substoichiometric amount of pure oxygen in a gasifier, and steam is added to moderate the temperature. The resulting mixture of product gases forms the basis of the synthesis gas. The carbon dioxide is an unwanted by-product of the reaction and must be removed from the product stream, usually by a physical or chemi-physical absorption process. A viable process alternative is recycling a portion of the separated carbon dioxide stream back to the reactor. This has the effect of pushing the equilibrium of the water-gas shift reaction to the left, thus favoring the production of carbon monoxide.
Is Recycling of an Unwanted Product or an Inert Warranted for the Control of Reactor Operation? As mentioned previously, for highly exothermic reactions such as the partial oxidation of organic molecules, it is sometimes necessary to add an inert material to the reactor feed to moderate the temperature rise in the reactor and/or to move the reacting components outside of the explosive (flammability) limits. The most often used material for this purpose is steam, but any inert material that is available may be considered. For example, in the coal gasification example given earlier, steam is used to moderate the temperature rise in the reactor. For the case of recycling carbon dioxide to affect the water-gas shift reaction, there is another potential benefit. The recycling of carbon dioxide reduces the amount of steam needed in the feed to the reactor, because the carbon dioxide can absorb heat and reduce the temperature rise in the reactor.
What Phase Is the Recycle Stream? The phase of the stream to be recycled plays an important role in determining the separation and recycle structure of the process. For liquids, there are concerns about azeotropes that complicate the separations scheme. For gases, there are concerns about whether high pressures and/or low temperatures must be used to enable the desired separation to take place. In either case gas compression is required, and, generally, this is an expensive operation. For example, the use of membrane separators or pressure-swing adsorption requires that the gas be fed at an elevated pressure to these units. If separation of a gas (vapor) is to be achieved using distillation, then a portion of the gas must be condensed, which usually requires cooling the gas significantly below ambient temperatures. This cooling process generally requires the use of compressors in the refrigeration cycle and the lower the desired temperature, the more expensive is the refrigeration. Some typical refrigerants and their temperature ranges are given in Table 2.2. Because separations of gases require expensive, low-temperature refrigeration, they are avoided unless absolutely necessary.
Table 2.2 Common Refrigerants and Their Ranges of Cooling (Data from References [12] and [13])
Refrigerant |
Typical Operating Temperature Range (°C) |
Vapor Pressure at 45°C (bar) |
Critical Pressure (bar) |
Critical Temperature (°C) |
Methane |
−129 to −184 |
749 |
46.0 |
−82.5 |
Ethane |
−59 to −115 |
1453 |
48.8 |
32.3 |
Ethylene |
−59 to −115 |
2164 |
50.3 |
9.3 |
Propane |
4 to −46 |
15.3 |
42.5 |
96.7 |
Propylene |
4 to −46 |
18.45 |
46.1 |
91.6 |
N-Butane |
16 to −12 |
4.35 |
38.0 |
152.0 |
Ammonia |
27 to −32 |
17.8 |
112.8 |
132.5 |
Carbon Dioxide |
4 to −50 |
787 |
73.8 |
31.1 |
Methylene Chloride |
4 to −12 |
1.21 |
60.8 |
236.9 |
Methyl Chloride |
4 to −62 |
9.84 |
66.8 |
143.1 |
R-134a (1,1,1,2- tetrafluoro-ethane) |
4 to −50 |
11.6 |
40.6 |
101.0 |
R-152a (1,1-difluoro- ethane) |
4 to −50 |
10.4 |
45.0 |
113.5 |
Only refrigerants with critical temperatures above the typical cooling water condenser temperature of 45°C can be used in single-stage, noncascaded refrigeration systems. Therefore, such systems are usually limited to the range of −45°C to −60°C (for example using propylene, propane, or methyl chloride). For lower temperatures, refrigeration systems with two different refrigerants are required, with the lower-temperature refrigerant rejecting heat to the higher-temperature refrigerant, which in turn rejects heat to the cooling water. Costs of refrigeration are given in Chapter 8, and these costs increase drastically as the temperature decreases. For this reason, separations of gases requiring very low temperatures are avoided unless absolutely necessary.
As a review of the concepts covered in this chapter, Example 2.6 is presented to illustrate the approach to formulating a preliminary process flow diagram.
Illustrative Example Showing the Input/Output and Recycle Structure Decisions Leading to the Generation of Flowsheet Alternatives for a Process
Consider the conversion of a mixed feed stream of methanol (88 mol%), ethanol (11 mol%), and water (1 mol%) via the following dehydration reactions:
The reactions take place in the gas phase, over an alumina catalyst [14, 15], and are mildly exothermic but do not require additional diluents to control reaction temperature. The stream leaving the reactor (reactor effluent) contains the following components, listed in order of decreasing volatility (increasing boiling point):
Ethylene (C2H4)
Dimethyl Ether (DME)
Diethyl Ether (DEE)
Methanol (MeOH)
Ethanol (EtOH)
Water (H2O)
Moreover, because these are all polar compounds, with varying degrees of hydrogen bonding, it is not surprising that these compounds are highly nonideal and form a variety of azeotropes with each other. These azeotropes are as follows:
DME – H2O (but no azeotrope with significant presence of alcohol)
DME – EtOH
DEE – EtOH
DEE – H2O
EtOH – H2O
For this problem, it is assumed that the mixed alcohol stream is available at a relatively low price from a local source ($0.75/kg). However, pure methanol ($0.672/kg) and/or ethanol ($1.138/kg) streams may be purchased if necessary. The selling prices for DME, DEE, and ethylene are $0.841/kg, $1.75/kg, and $1.488/kg, respectively. Preliminary market surveys indicate that up to 15,000 tonne/y of DEE and up to 10,000 tonne/y of ethylene can be sold.
For a proposed process to produce 50,000 tonne/y of DME, determine the viable process alternatives.
Step 1: Batch versus Continuous
For a plant of this magnitude, a continuous process would probably be chosen. However, this issue will be reviewed after considering some process alternatives and it will be seen that a hybrid batch/continuous process should also be considered.
Step 2: Define the Input/Output Structure of the Process
The basic input/output diagram of the process is shown in the process concept diagram of Figure E2.6(a). First, consider a material balance for the process and estimate the profit margin:
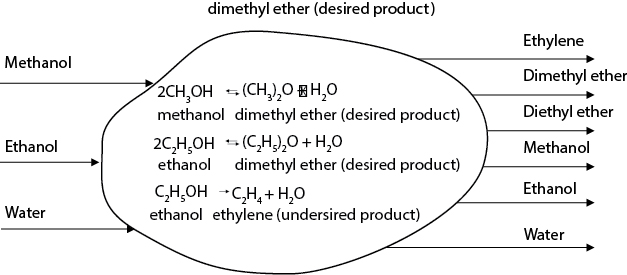
Figure E2.6(a) Process Concept Diagram for the Mixed Ethers Process of Example 2.6
Required MeOH feed = (2)(1.087 × 10⁶) = 2.174 × 10⁶ kmol / y
Maximum ethylene production = 0.2718 × 10⁶ kmol/y or 7.61 × 10³ tonne/y
Value of DME = (50×106)(0.841) = $42.05×10⁶/y
Value of DEE (maximum production) = (0.1309 × 10⁶)(74)(1.75) = $16.95 × 10⁶/y
Value of ethylene (maximum production) = (0.2718 × 10⁶)(28)(1.488) = $11.32×10⁶/y
Margin will vary between (42.05 + 16.95 − 58.62) = $0.38 million and (42.05 + 11.32 − 58.62) = −$5.24 million per year.
Important Points
From this margin analysis, it is clear that the amount of DEE produced should be optimized, because making ethylene is far less profitable. In addition, the maximum amount of DEE that the market can support is not currently being produced. Therefore, supplementing the feed with ethanol should be considered.
Because the main feed stream contains both reactants and an impurity (water), separation or purification of the feed prior to processing should be considered.
In order to minimize the production of by-products (ethylene), the selectivity of the DEE reaction should be optimized.
Alternative 1
In this option, shown in Figure E2.6(b), the mixed alcohol feed is not separated, but feed is supplemented with ethanol. One reactor is used for both reactions. The disadvantages of this case are that the separations are complicated and the reactor for both DME and DEE production cannot be optimized easily.
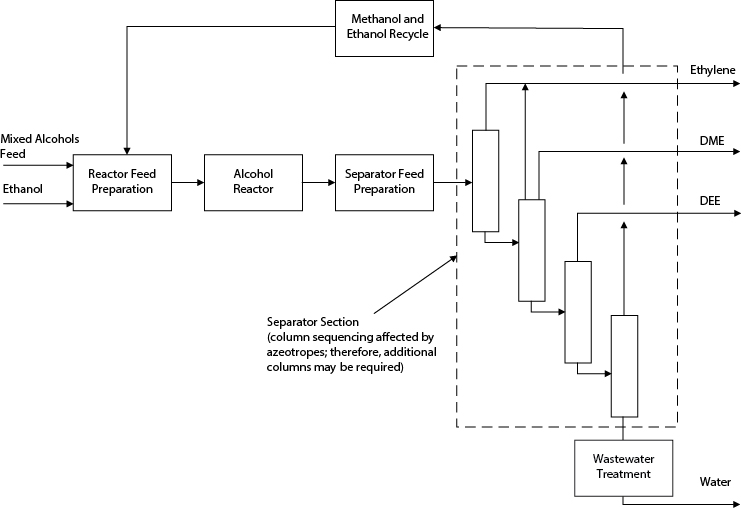
Figure E2.6(b) Structure of Process for Alternative 1 in Example 2.6
Alternative 2
In this option, shown in Figure E2.6(c), feed is supplemented with ethanol and is separated into separate methanol and ethanol streams. Two reaction trains are used: one for DME and the other for DEE production. This allows the production of DME and DEE to be optimized separately and eliminates problems associated with the DME-ethanol azeotrope. However, there are two reactors and at least one more separation (column).
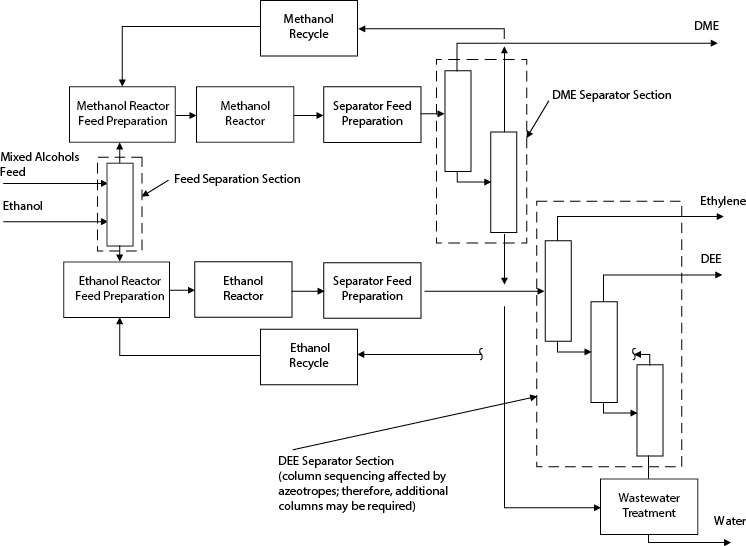
Figure E2.6(c) Structure of Process for Alternative 2 in Example 2.6
Alternative 3
This option is a hybrid between batch and continuous processes. The methanol is continuously separated from ethanol in the first column. However, the same equipment is used to produce both DME and DEE but at different times. The equipment is run in two “campaigns” per year. In the first campaign (Figure E2.6[d]), DME is produced and ethanol is stored for use in the second campaign.
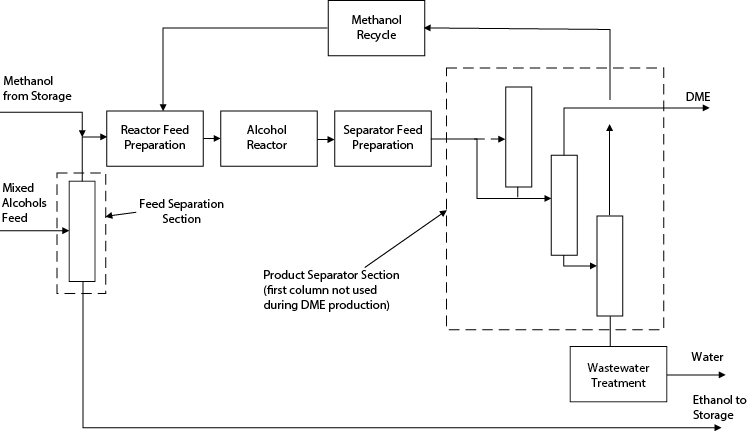
Figure E2.6(d) Structure of Process for Alternative 3—DME Campaign in Example 2.6
In the second campaign, shown in Figure E2.6(e), methanol is sent to storage, and ethanol is taken from storage to produce DEE and ethylene using the same equipment that was used to produce DME. For this part of the campaign, the first column is used to remove the ethylene.
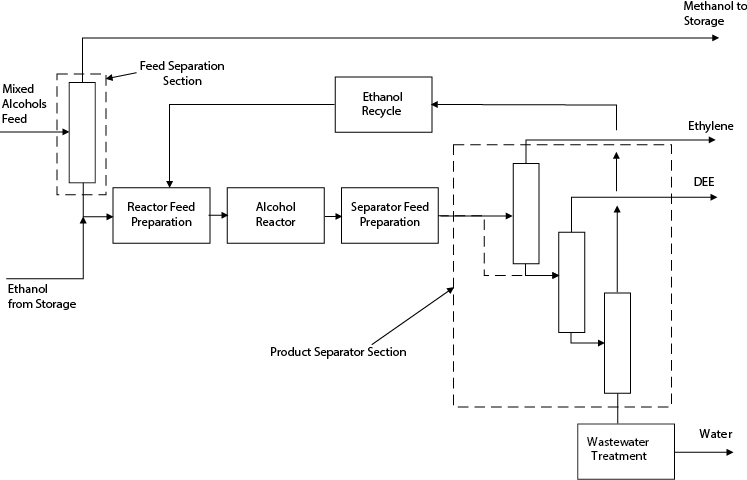
Figure E2.6(e) Structure of Process for Alternative 3—DEE Campaign in Example 2.6
For this option, there is significantly less equipment to buy. However, the design and optimization of the process are more complicated because the equipment must be designed to perform two separate and quite different functions.
2.5 Step 4—General Structure of the Separation System
As pointed out previously, the structure of the separation sequence is covered in detail in Chapter 12. In that chapter, considerable emphasis is placed on the sequencing of distillation columns, and some of the problems associated with azeotropic systems are covered.
2.6 STEP 5—Heat-Exchanger Network or Process Energy Recovery System
The main objective of process energy recovery is to optimize the energy that a process exchanges with the utilities. At the expense of capital investment, the utility usage can be decreased by exchanging energy between process streams. The amount of energy integration is a function of the relative costs of the utilities. In addition, the process becomes more complex and more difficult to control. This loss in flexibility must be weighed against the savings in operating costs. These and other issues are covered in more detail in Chapter 15.
2.7 Information Required and Sources
In formulating a process flow diagram, one of the most important tasks is the collection and synthesis of data. These data are available in a wide variety of publications. As a guide, a summary of useful resources is presented in Table 2.3. The data in this table are partitioned into information pertaining to new and existing processes and data on new and existing chemical pathways.
Table 2.3 Summary of Resources for Obtaining Information on Chemical Processes
Resource |
Information Available |
|
Existing Processes |
Shreve’s Chemical Process Industries [16] |
Gives a good review of basic processes to produce a wide variety of chemicals. Both organic and inorganic chemicals are covered. |
Refinery Processes Handbook [17] |
Published every other year in Hydrocarbon Processing. Gives basic block flow diagrams and operating cost and capital investment data for a wide range of refinery operations. |
Gas Processes Handbook [18] |
Published every other year in Hydrocarbon Processing. Gives basic block flow diagrams and operating cost and capital investment data for a wide range of gas processing operations. |
Petrochemical Processes Handbook [19] |
Published every other year in Hydrocarbon Processing. Gives basic block flow diagrams and operating cost and capital investment data for a wide range of gas petrochemical operations. |
Kirk-Othmer Encyclopedia of Chemical Technology [20] |
Comprehensive 25-volume encyclopedia has background information and PFDs for a wide variety of organic and inorganic chemical processes. |
Encyclopedia of Chemical Processing and Design [21] |
Comprehensive 20-volume encyclopedia contains background information on a variety of chemical processes. Many solutions to previous AIChE student contest problems are published as case studies. |
|
Reaction and Kinetics |
Chemical Reactor Design for Process Plants [22] |
Vol. 2 has several excellent case studies for processes, including reaction kinetics and reactor designs. |
Industrial and Engineering Chemistry Research |
This journal is published monthly by the American Chemical Society and contains numerous research articles containing information about processes and reaction kinetics. |
Journal of Catalysis—Academic Press Applied Catalysis—Elsevier Catalysis Today—Elsevier |
These (and other) journals concentrate on research conducted into the field of heterogeneous catalysis. Kinetic expressions and activity data are given for many processes of industrial importance. |
Patents |
The patent literature contains a wealth of information about new processes. Typically, single-pass conversions and catalyst activities are given. However, reaction kinetics are generally not provided and may not be derived easily from patent data. An excellent on-line patent search engine is at http://www.delphion.com. |
SRI Reports |
Excellent source of background information on all aspects of processes. Unfortunately, this information is available only to industrial clients of this service. |
2.8 Summary
In this chapter, the development of a process flow diagram has been investigated. The first step in synthesizing a PFD was to establish and examine all possible chemical routes that form the desired product(s). The next step was to establish whether the process should operate in a batch or continuous manner. Guidelines to make this decision were presented in Table 2.1. The next step was to establish the input/output structure of the process. A process concept diagram was introduced that only required the identification of the raw materials, products, and stoichiometry of all the reactions that take place. At the process level, it was shown that all processes possess the same basic structure given in the generic block flow diagram.
The recycle structure of the PFD was introduced, and the three basic methods of recycle were discussed. Reasons and examples were provided to illustrate why inert material or products are sometimes recycled with unreacted raw materials. Difficulties in separating streams of products and reactants were given, and these were shown to influence the recycle structure and type of separation used.
The separation of products and unreacted raw materials and the integration of energy were covered briefly and are covered in greater depth in Chapters 12 and 15, respectively. An example showing how process alternatives are generated using the methods outlined in this chapter was provided, and several process alternatives were illustrated for this example using generic block flow diagrams. Finally, a list of resources was presented to help guide the reader to obtain basic data on chemical reactions and processes.
WHAT YOU SHOULD HAVE LEARNED
The first choice is whether to use batch or continuous operation.
Continuous chemical processes have a general structure:
Input-output
Recycle
Separation
The input-output structure of a continuous chemical process consists of
Reactor feed preparation
Reactor
Separation feed preparation
Separation
Recycle
Environmental control
References
1. Douglas, J. M., Conceptual Design of Chemical Processes (New York: McGraw-Hill, 1989).
2. Douglas, J. M., “A Hierarchical Design Procedure for Process Synthesis,” AIChE J. 31 (1985): 353.
3. “Batch Plants Adapt to CPI’s Flexible Gameplans, Newsfront,” Chem. Eng. 95 (February 1988): 31–35.
4. Fruci, L., “Pipeless Plants Boost Batch Processing,” Chem. Eng. 100 (June 1993): 102–110.
5. Lowenstein, J. G., “The Pilot Plant,” Chem. Eng. 92 (December 1985): 62–79.
6. Crowl, D., and J. Louvar, Chemical Process Safety (Upper Saddle River, NJ: Prentice Hall, 1990).
7. Rase, H. F., Chemical Reactor Design for Process Plants, Vol. 1: Principles and Techniques (New York: John Wiley & Sons, 1977).
8. Oertel, G., Polyurethane Handbook, 2nd ed. (Munich: Hanser Publ., 1993).
9. Peters, M. S., and K. D. Timmerhaus, Plant Design and Economics for Chemical Engineers, 4th ed. (New York: McGraw-Hill, 1991.)
10. Technical Information for Houdry® Hydrodealkylation DETOL®, LITOL®, and PYROTOL® for High Purity Benzene, ABB Lummus Global, BG503-0026, May 1997.
11. Walas, S. M., Phase Equilibria in Chemical Engineering (Stoneham, MA: Butterworth, 1985).
12. Mehra, Y. R., “Refrigeration Systems for Low-Temperature Processes,” Chemical Engineering, July 12, 1982, 95.
13. Perry, R. H., D. W. Green, and J. O. Maloney, Chemical Engineers’ Handbook, 7th ed. (New York: McGraw-Hill, 1991).
14. Butt, J. B., H. Bliss, and C. A. Walker, “Rates of Reaction in a Recycling System—Dehydration of Ethanol and Diethyl Ether over Alumina,” AIChE J. 8, no. 1 (1962): 42–47.
15. Berčič, G., and J. Lavec, “Intrinsic and Global Reaction Rates of Methanol Dehydration over γ-Al2O3 Pellets,” Ind. Eng. Chem. Res. 31 (1992): 1035–1040.
16. Austin, G. T., Shreve’s Chemical Process Industries, 5th ed. (New York: McGraw-Hill, 1984).
17. Refinery Processes Handbook ’00, in Hydrocarbon Processing (Houston: Gulf Publishing Co., 2000).
18. Gas Processes Handbook ’00, in Hydrocarbon Processing (Houston: Gulf Publishing Co., 2000).
19. Petrochemical Processes Handbook ’01, in Hydrocarbon Processing (Houston: Gulf Publishing Co., 2001).
20. Kirk-Othmer Encyclopedia of Chemical Technology, 4th ed. (New York: John Wiley & Sons, 1991–1998).
21. McKetta, J. J., and W. A. Cunningham, Encyclopedia of Chemical Processing and Design (New York: Marcel Dekker, 1976).
22. Rase, H. F., Chemical Reactor Design for Process Plants, Vol. 2. (New York: John Wiley & Sons, 1977).
Short Answer Questions
1. What are the five elements of the hierarchy of process design?
2. What are the three types of recycle structures possible in a chemical process? Explain when each is used.
3. Give three criteria for choosing a batch process as opposed to a continuous process.
4. When would one purposely add an inert material to a feed stream? Illustrate this strategy with an example, and explain the advantages (and disadvantages) of doing this.
5. In general, when would one purify a material prior to feeding it to a process unit? Give at least one example for each case you state.
Problems
6. In modern integrated gasification combined cycle (IGCC) coal-fed power plants, oxygen is produced via cryogenic separation of air and is fed to the IGCC plant along with coal. The separation of oxygen from air is expensive; what reason(s) can you give for doing this?
7. The production of ethylbenzene is described in Appendix B, Project B.2. From the PFD (Figure B.2.1) and accompanying stream table (Table B.2.1), determine the following:
The single-pass conversion of benzene
The single-pass conversion of ethylene
Overall conversion of benzene
Overall conversion of ethylene
Suggest two strategies to increase the overall conversion of ethylene and discuss their merits.
8. Consider the following statement: “If a reactant (G) in a process is a gas at the feed conditions, subsequent separation from the reactor effluent is difficult, hence unused G cannot be recycled.” Do you agree with this statement? Give your reasoning why you agree or disagree.
9. Most pharmaceutical products are manufactured using batch processes. Give at least three reasons why this is so.
10. The formation of styrene via the dehydrogenation of ethylbenzene is a highly endothermic reaction. In addition, ethylbenzene may decompose to benzene and toluene and also may react with hydrogen to form toluene and methane:
This process is presented in Appendix B as Project B.3 From the information given in Appendix B, determine the following:
The single-pass conversion of ethylbenzene
The overall conversion of ethylbenzene
The yield of styrene
Suggest one strategy to increase the yield of styrene, and sketch any changes to the PFD that this strategy would require.
11. There are two technically viable routes to the production of a hydrocarbon solvent, S, starting with feed material A. Route 1 uses a disproportionation reaction, in which feed material A is converted to the desired solvent S and another solvent R, both of which are marketable products. Route 2 starts with the same chemical A but uses a hydrodealkylation reaction to produce the desired solvent. The reaction schemes for each process are shown below.
Assuming that pure A is fed to the process, the solvents S and R are separable by simple distillation, and both are much less volatile than either methane or hydrogen, sketch PFDs for Routes 1 and 2. Which process do you think will be more profitable? Explain your reasoning and assumptions.
12. When considering the evolution of a process flowsheet, it was noted that there are three forms of recycle structure for unused reactants, given as a–c below. For each case, carefully explain under what conditions you would consider or implement each strategy.
Separate, purify, and recycle
Recycle without separation and use a purge
Recycle without separation and do not use a purge
13. Acetaldehyde is a colorless liquid with a pungent, fruity odor. It is primarily used as a chemical intermediate, principally for the production of acetic acid, pyridine and pyridine bases, peracetic acid, pentaeythritol, butylene glycol, and chloral. Acetaldehyde is a volatile and flammable liquid that is miscible in water, alcohol, ether, benzene, gasoline, and other common organic solvents. In this problem, the synthesis of acetaldehyde via the dehydrogenation of ethanol is to be considered. The following reactions occur during the dehydrogenation of ethanol:
The single-pass conversion of ethanol is typically 60%. The yields for each reaction are approximately:
Acetaldehyde 92%
Ethyl acetate 4%
Butanol 2%
Acetic acid 2%
For this process, generate a process concept diagram showing all the input and output chemicals.
Develop two alternative preliminary process flow diagrams for this process.
14. Consider the following process in which liquid feed material A (normal BP of 110°C) is reacted with gaseous feed material G to produce main product C and by-products R and S via the following reactions:
Both feeds enter the process at ambient temperature and pressure. Both reactions occur in the gas phase at moderate temperature and pressure (250°C and 10 bar). The normal boiling points of G, S, and C are less than −120°C. By-product R has a normal boiling point of 75°C and is highly soluble in water. Product C is very soluble in water but G and S are insoluble. The single-pass conversion through the reactor is low for feed A, and the ratio of G to A in the feed to the reactor should be maintained in excess of 4 to minimize the chance of other unwanted side reactions. Using this information, and assuming that both A and G are expensive, do the following:
Draw a preliminary process flow diagram identifying the main unit operations (reactors, compressors, pumps, heat exchangers, and separators), and identify the recycle structure of the process.
Justify the methods used to recycle A and G.
What unit operations do you suggest for your separators? Justify your choices.
How would your PFD change if the price of feed material G were very low?
15. How is Scotch whisky made?
The following descriptions of malt and grain whisky manufacturing are given here courtesy of the University of Edinburgh at http://www.dcs.ed.ac.uk/home/jhb/whisky/swa/chap3.html. For each of the two processes, sketch a process flow diagram.
There are two kinds of Scotch whisky: malt whisky, which is made by the pot still process, and grain whisky, which is made by the patent still (or Coffey still) process. Malt whisky is made from malted barley only, whereas grain whisky is made from malted barley together with unmalted barley and other cereals.
Malt Whisky
The pot still process by which malt whisky is made may be divided into four main stages: malting, mashing, fermentation, and distillation.
(1) Malting
The barley is first screened to remove any foreign matter and then soaked for two or three days in tanks of water known as steeps. After this it is spread out on a concrete floor known as the malting floor and allowed to germinate. Germination may take from 8 to 12 days depending on the season of the year, the quality of the barley used, and other factors. During germination the barley secretes the enzyme diastase, which makes the starch in the barley soluble, thus preparing it for conversion into sugar. Throughout this period the barley must be turned at regular intervals to control the temperature and rate of germination.
At the appropriate moment germination is stopped by drying the malted barley or green malt in the malt kiln. More usually nowadays malting is carried out in Saladin boxes or in drum maltings, in both of which the process is controlled mechanically. Instead of germinating on the distillery floor, the grain is contained in large rectangular boxes (Saladin) or in large cylindrical drums. Temperature is controlled by blowing air at selected temperatures upward through the germinating grain, which is turned mechanically. A recent development caused by the rapid expansion of the Scotch whisky industry is for distilleries to obtain their malt from centralized maltings that supply a number of distilleries, thereby enabling the malting process to be carried out more economically.
(2) Mashing
The dried malt is ground in a mill, and the grist, as it is now called, is mixed with hot water in a large circular vessel called a mash tun. The soluble starch is thus converted into a sugary liquid known as wort. This is drawn off from the mash tun, and the solids remaining are removed for use as cattle feed.
(3) Fermentation
After cooling, the wort is passed into large vessels holding anything from 9000 to 45,000 liters of liquid, where it is fermented by the addition of yeast. The living yeast attacks the sugar in the wort and converts it into crude alcohol. Fermentation takes about 48 hours and produces a liquid known as wash, containing alcohol of low strength, some unfermentable matter, and certain by-products of fermentation.
(4) Distillation
Malt whisky is distilled twice in large copper pot stills. The liquid wash is heated to a point at which the alcohol becomes vapor. This rises up the still and is passed into the cooling plant, where it is condensed into liquid state. The cooling plant may take the form of a coiled copper tube or worm that is kept in continuously running cold water, or it may be another type of condenser.
The first distillation separates the alcohol from the fermented liquid and eliminates the residue of the yeast and unfermentable matter. This distillate, known as low wines, is then passed into another still, where it is distilled a second time. The first runnings from this second distillation are not considered potable, and it is only when the spirit reaches an acceptable standard that it is collected in the spirit receiver. Again, toward the end of the distillation, the spirit begins to fall off in strength and quality. It is then no longer collected as spirit but drawn off and kept, together with the first running, for redistillation with the next low wines.
Pot-still distillation is a batch process.
Grain Whisky
The patent still process by which grain whisky is made is continuous in operation and differs from the pot still process in four other ways.
The mash consists of a proportion of malted barley together with unmalted cereals.
Any unmalted cereals used are cooked under steam pressure in converters for about 3½ hours. During this time the mixture of grain and water is agitated by stirrers inside the cooker.
The starch cells in the grain burst, and when this liquid is transferred to the mash tun, with the malted barley, the diastase in the latter converts the starch into sugar.
The wort is collected at a specific gravity lower than in the case of the pot still process.
Distillation is carried out in a patent or Coffey still, and the spirit collected at a much higher strength.
Storage and aging of the whisky are also an important part of the overall process but need not be considered for this problem. Storage occurs in oak barrels that previously stored either sherry or bourbon (or both, in the case of double-aged whisky). The length of storage in the barrel determines the vintage of the whisky. Unlike wine, the time after bottling does not count, and so a 15-year-old scotch that was bought in 1960 is today still a 15-year-old scotch.