Chapter 24: Process Troubleshooting and Debottlenecking
WHAT YOU WILL LEARN
What troubleshooting and debottlenecking are
Strategies for troubleshooting and debottlenecking
Imagine that you are responsible for a chemical process unit. The pressure in a chemical reactor begins to increase. You are concerned about material failure and explosion. What do you do? For a case such as this with potential catastrophic consequences, it may be necessary to shut the process down. However, process shutdown and start-up are very costly, and if a safe alternative were available, you would certainly want to consider it as an option. In another scenario, what would you do if it had been observed that the purity of product from your unit had been decreasing continuously for several days, and customers had begun to complain of poor product quality and have threatened to cancel lucrative contracts?
The situations described above may be classified as process troubleshooting problems. Once a plant is built and operating, it is anticipated that it will operate for a number of years (10–30 years). During this time, there will be instances when the plant displays unusual behavior. This unusual behavior may represent a problem or a symptom of a problem that has not yet become apparent. The procedure for identifying the root cause of unusual behavior is part of troubleshooting. The other part is to provide guidance as to what action should be taken to correct the problem or, in the case of a symptom that has not yet resulted in a problem, to prevent a problem from developing. Problems that affect process performance represent financial losses and potential safety hazards, so these problems must be quickly identified and resolved. The key to smooth plant operations is preventive action based on correct diagnosis of early symptoms. Troubleshooting problems associated with process start-up are beyond the scope of this text.
Even during a period of successful operation, the process does not operate at a steady state. Distillation units operate differently in summer than in winter, as well as between night and day, as a result of internal reflux changes resulting from heat losses or gains from the tower. Feed material compositions and flowrates fluctuate, the temperature of cooling water changes, catalyst decays, heat exchangers foul, and so on. The control system responds to these changes and alters utility flows to maintain process streams at close to normal operating conditions.
The key to solving troubleshooting problems is to make use of the information regarding the process taken during periods of successful operation. Based on operating experience, the range over which changes can take place without a significant effect on the performance of the process is learned. Consequently, there is no single base case to represent process behavior as described in previous chapters. When comparing current operations to normal operations, it is important to determine whether current operation lies within the range of normal operations. The range of normal process operation provides the base case.
Three steps can be identified to troubleshoot a process:
Treat the Symptoms: In this situation, the observed problem is addressed without investigation of the root cause. If the reactor pressure is increasing, find a way to relieve the pressure. This is a short-term solution. Because the root cause of the pressure increase has not been identified and addressed, the pressure may increase again. However, the immediate problem (the potential for an explosion, vessel rupture, or unwanted product release through a relief valve) has been avoided, and there is now time to seek the root cause of the problem.
Identify the Cause of the Problem: Eventually, the cause of the problem should be diagnosed. This is particularly true if the problem recurs or if it is safety related. Because this may take time, the symptoms must continue to be treated.
Fix the Problem: Ultimately, the problem should be fixed.
Process troubleshooting involves solving open-ended problems for which there are likely to be several possible solutions. It is necessary for the engineer faced with such a problem to consider many identifiable solutions. Failure to consider a sufficient number of possible solutions may result in missing the actual solution.
Now, consider a different situation. It is necessary to determine how much scale-up is possible for the process for which you are responsible. You determine that one process unit can be scaled up only by 10%, whereas all other process units can be scaled up by at least 15%. The process unit that can be scaled up only by 10% is called a bottleneck. Elimination of this bottleneck is called debottlenecking and involves determining how to remove obstacles limiting process changes.
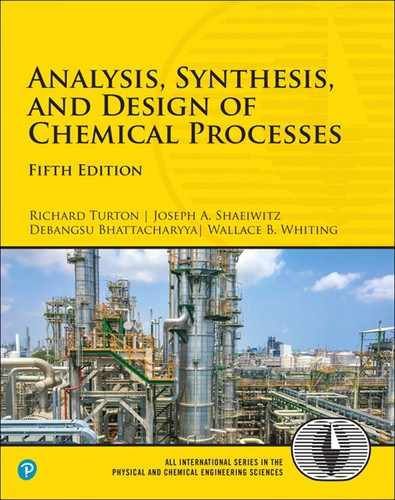
To put troubleshooting and debottlenecking problems in context, consider the input/output model shown in Figure 24.1. This model was first introduced in Chapter 19, Figure 19.17, and was used to define design and performance problems. The input/output model can also be used to define troubleshooting and debottlenecking problems. Troubleshooting problems involve identification and correction of the change in inputs and/or the process responsible for observed changes in outputs. Debottlenecking problems involve identification and modification of the portion of a process limiting the ability to change inputs or outputs.
In this chapter, a recommended methodology for attacking process troubleshooting problems is presented. Then five case studies of increasing complexity are presented that will serve to enhance the reader’s skills in attacking troubleshooting problems. Finally, an example of a debottlenecking problem is presented.
24.1 Recommended Methodology
When solving complex problems such as troubleshooting and debottlenecking, having a reliable, personal problem-solving strategy is important. Problem-solving strategies are discussed briefly here. More details can be found elsewhere [1].
24.1.1 Elements of Problem-Solving Strategies
Three elements of successful problem-solving strategies are recommended here for attacking process troubleshooting problems (including debottlenecking problems). This is not meant to be an exhaustive list of strategies; it is simply some of the strategies that can be used. The three strategies discussed here are
Brainstorming
Using known or observed data plus your understanding of equipment behavior
Considering the unexpected
Each is considered separately. They can also be combined into a general methodology for solving open-ended problems.
Brainstorming involves generating an extensive list of possible ideas. This need not be a formal process; it can be done informally and rapidly. In fact, the natural response to a troubleshooting situation is to think immediately and rapidly of several possible causes. If the product is not meeting specifications, think of all of the reasons that can be considered as potential causes, no matter how remote the possibility. Then brainstorm possible solutions. The main rule of brainstorming is that there are no bad ideas. The goal is to generate as many ideas as is possible. After brainstorming, only then is it time to evaluate all items critically to generate the most likely causes and solutions. Although brainstorming is usually a group activity, often it must be done individually. For a large, long-term problem, time can be taken to brainstorm in a group. For an everyday problem, especially an emergency situation, one should train oneself to brainstorm automatically. Brainstorming is a component of most problem-solving strategies.
When brainstorming a troubleshooting problem, consider all ideas, no matter how unusual they may seem.
When troubleshooting a chemical process, an understanding of equipment behavior should be used to narrow the list of possibilities. For example, in a staged separation using a mass separating agent, the Kremser equation (see Section 21.2.3) quantifies the relationship between process variables. The most important of these relationships for a variety of unit operations were covered in the performance sections of Chapters 19–23. Use of these relationships will be illustrated in the case studies presented later in this chapter.
When there is a problem with process operation, the cause of the problem must be identified. The problem may or may not be located at the unit where poor operation is observed. For example, the output from the separator may be off-spec due to lower-quality product exiting the reactor rather than due to poor separator operation. In troubleshooting plant problems, a vast amount of data exist that can be used to help identify the problem. These data would likely include current and historical operating conditions. In addition, the plant P&IDs would show where to look for additional current operating data. Any methodology for troubleshooting must consider this information, and any solution must be consistent with the operating data. Often, solving the problem is facilitated by selection of the data that will lead to identification of the problem.
Although a knowledge of equipment behavior is essential to solving troubleshooting problems, it is important that all alternatives, no matter how unexpected, be considered. If the pressure drop in a tray tower is increasing, a knowledge of equipment function suggests that there may be loading or flooding, so an increased liquid or vapor flowrate is a possible cause. However, was the possibility that someone left a toolbox in the downcomer during a recent maintenance shutdown also considered? The lesson here is to expect the unexpected! Consider all possibilities no matter how remote they may seem.
Given the open-ended nature of troubleshooting problems, their solution may best be attacked by creative problem-solving strategies. One such strategy, presented by Fogler and LeBlanc [1], is discussed here in the context of process troubleshooting. (Another similar strategy is presented in Chapter 25.) Their problem-solving strategy involves five steps:
Define
Generate
Decide
Implement
Evaluate
First, the correct problem must be defined. If the problem is incorrectly defined, it is likely that an incorrect solution will be found. If the product is not meeting specifications, this is the problem. However, if after further investigation it is found that the stream leaving the reactor is not at design conditions but the reactor feed is at design conditions, it may be necessary to redefine the problem to be incorrect reactor performance.
Once the problem is defined, ideas must be generated. This is identical to brainstorming. It is important to generate as many ideas as possible. It is poor problem-solving strategy to focus on one possible solution or to assume that there is only one possible solution. For process troubleshooting, ideas may need to be generated both for the cause of the problem and for remedies to the problem.
Once ideas have been generated, the next step is to decide how to proceed. This is when knowledge of equipment can be used to select the most likely items from the brainstorming list to implement first. The next step is to implement the chosen solution.
Once the chosen solution method is implemented, it is necessary to evaluate the chosen solution. Is it working? If not, why not? Should another solution be implemented? If several solutions have been attempted, none of which appears to be solving the problem, it may be time to think about whether there is an unexpected solution that can solve the problem.
24.1.2 Application to Troubleshooting Problems
A troubleshooting strategy is given in Table 24.1. It involves five steps. This sequence of steps is shown to parallel the problem-solving strategy of Fogler and LeBlanc discussed in Section 24.1.1.
Table 24.1 Strategy for Troubleshooting Existing Plants
Phase 1 |
Check out primary suspects. a. Verify the identified problem or symptom. b. Check input to the process. c. If only one unit is involved, check operating conditions of unit. d. Check for fully open or closed control valves. |
Phase 2 |
Identify the unit operation producing the problem or symptom. a. System size is reduced systematically until the unit operation that is the source of the problem or symptom is determined. b. Inputs to each system are checked. |
Phase 3 |
Perform a detailed analysis of unit operation uncovered in Phase 2 to determine and to verify the root cause of the problem or symptom. |
Phase 4 |
Report your diagnosis of the root cause of the problem, and recommend action to remove the problem or symptom. |
Phase 5 |
Report significant observations uncovered during the analysis that may be important to your organization. |
Phase 1. Screen the whole process for the most common causes of problems or symptoms of problems in the process. This might involve brainstorming done informally as part of your thought process.
It is important to define the correct problem, or to determine whether one even exists. One common situation is false identification of a problem or symptom. An instrument could have been read incorrectly or could be broken, the analytical analysis (online or in lab) may not be correct, reagents may have been prepared incorrectly, and so on. In this situation, there is no problem with the process; it is a false indication of a problem. Never accept the initial problem identification without verification.
Once it has been determined that a problem really exists, the suspects should be screened. This is the generate step. A common cause of problems results from changes in process inputs. The adage “garbage in, garbage out” is universal and applies to chemical processes. Component flows into the process must be verified and compared to those for normal operations. If a problem appears as a result of process inputs, go to Phase 3. If a problem is known to involve a single unit (which may be true only for academic problems), consider possible unit malfunctions (some are listed under Phase 2). In this case, you should also go directly to Phase 3.
A third common cause results from limitations of the control systems on the utility streams used to maintain the temperature and pressure of process streams. If any control valves are found to be fully open or fully closed, there is a high probability that the desired control is not being achieved. All of the utility control valves are not normally shown on the PFD, and it is necessary to review the P&ID. All control valves should be checked. This information is used as input in later phases to identify the cause of the problem observed.
Phase 2. Locate the unit operation that is producing the problem or symptom. This is part of the decide step. The process is divided into subsections. If there is no obvious choice for selecting subsections, the process sections identified in the block flow diagram represent a reasonable starting point. Each system analyzed contains the stream identified as having a problem or symptom. Analyze system inputs. This identifies the subsection containing the cause of the problem. The subsection size is reduced, and the inputs are again analyzed. This continues until the unit operation producing the problem is identified. Then the operation of the identified unit should be checked. Ask key questions about each unit. Is there evidence of heat-exchanger fouling? Is the reflux ratio on the distillation column within its normal range? Are the temperature and pressure of the reactor at normal conditions?
Phase 3. Determine the root cause of the problem or symptom by a detailed analysis of the unit operation identified in Phase 1 or 2. This is the remainder of the decide step. Normal operation is used as a base case. This is the first place where the utility flows are analyzed. This involves using heuristics (Chapter 11), operating conditions of special concern (Chapter 6), calculation tools, and other material presented in Chapters 19–23.
Phase 4. Present all available evidence that establishes the root cause identified in Phase 3 as valid. Also, present any evidence that may not support the argument. Recommend action to be taken to correct the problem or treat the symptom. This is the implement step.
Phase 5. Present an evaluation of any significant observations that resulted from your analysis that could impact this or other processes within your company. This is the evaluate step. If you identify process improvements or potential for future problems, you are acting professionally. This is true especially if the suggestions are related to the environment or safety of personnel.
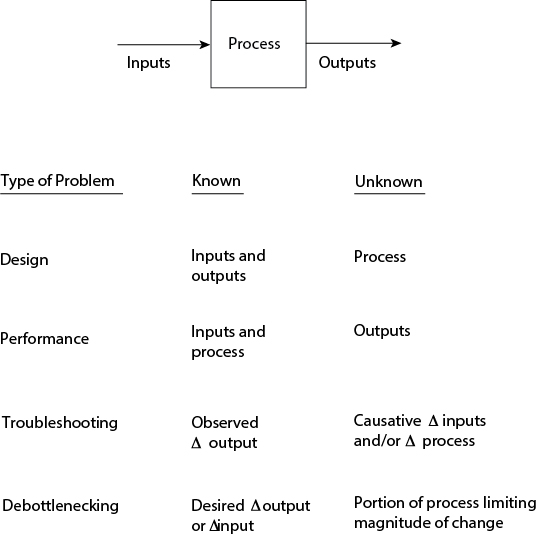
In summary, the cause of a change in output originates with a change in input and/or a change in process operation. Some possibilities are illustrated in Figure 24.2. This list is not meant to be exhaustive. It illustrates some possible causes for changes in output. The strategy discussed above is illustrated in the problems that follow.
24.2 Troubleshooting Individual Units
The first two case studies presented involve troubleshooting individual pieces of equipment. Although real troubleshooting situations usually involve an entire process, the necessary skills can be developed on simpler problems such as the two presented in this section.
24.2.1 Troubleshooting a Packed-Bed Absorber
The first troubleshooting problem involves a packed-bed absorber. The absorber has been designed to remove a contaminant from an air purge stream and has been operating for some time as designed. Then it is observed that the outlet air contains more contaminant than it should. A similar problem involving a tray absorber is given at the end of the chapter.
A packed absorber (Figure 24.3) has been designed to reduce the acetone concentration in 40 kmol/h of air from a mole fraction of 0.02 to 0.001. Acetone is absorbed into pure water at 20 kmol/h. Acetone is recovered from the effluent liquid, and the water, which is assumed pure, is recycled to the absorption unit. After a period of successful operation, it is observed that the exit acetone mole fraction in air is now 0.002.

The column is packed with 2.5 cm (1 in) Raschig rings and has a 48 cm diameter, which was obtained by designing for 75% of flooding. The column is assumed to operate isothermally at 27°C, and the nominal pressure is 1 atm. Raoult’s Law is assumed, and the partition coefficient for acetone, m = y/x = P*/P, where ln P* = 10.92 – 3598/T(K), has been determined from tabulated data [2]. At 27°C and 1.01 atm, m = 0.337.
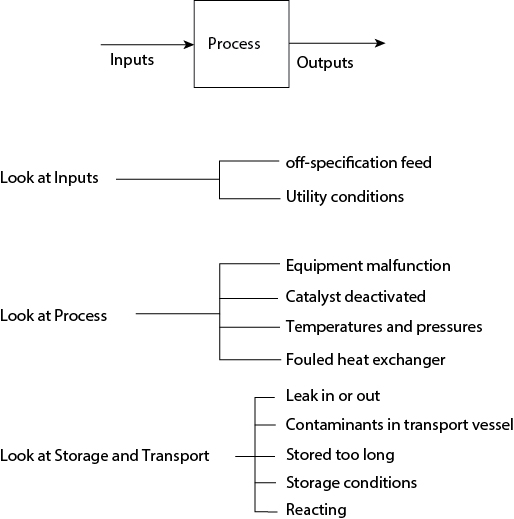
This problem, which involves dilute solutions, can be analyzed using the Colburn graph, Figure 21.29. On this graph, the interrelationship between the number of transfer units, NtoG, the absorption factor, A (A = L/mG), and the mole fraction is defined. The base-case point can be located. The y-axis is at a value of 0.05, and A = 1.48. This gives NtoG = 6.2. This is shown as point “a” on Figure 24.4.
Figure 24.4 Use of Colburn Graph to Solve Example 24.1
The first step is to verify that the acetone concentration has indeed increased. This might involve having an operator or technician make flow and concentration measurements on the effluent stream in question. It is assumed that the increased concentration at the normal flowrate has been verified. The next step in Phase 1 is to check process inputs and process operation (because only one unit is known to be involved) for potential causes for the observed change in output concentration. Changes in input are evaluated first. If the inputs are not found to be the cause of the problem, process operation is then investigated. Example 24.1 shows seven possible causes (“suspects”) for the observed change in output concentration.
Generate a list of causes for the observed change in absorber output. First, examine input changes, and then examine process operation changes.
The knowledge of packed-bed absorber performance illustrated on the Colburn graph is a good starting point. Any or all of these parameters could be different from design conditions.
Potential input problems include the following:
Increased Flowrate of Gas to Be Treated: A disturbance in A is a possible cause. Intuitively, if it is the gas rate, G, that has been disturbed, an increased gas rate would be the cause of an increased acetone concentration in the exit gas stream. This would result in a decrease in A.
Decreased Flowrate of Water: This would also result in a decrease in A.
The Water Does Not Enter Acetone Free: If the entering water contains acetone, intuitively, less acetone can be absorbed.
There Is More Acetone in the Feed: If the mole fraction of acetone in the feed were increased, the same fractional removal of acetone from air would result in a higher acetone mole fraction in the exit air stream.
These four items would be checked first to determine whether they are the cause of the faulty absorber performance. If they were not found to be the cause, the process operation would be investigated. Potential process operation problems include the following:
A Decrease in Column Pressure: Intuitively, a decrease in column pressure favors the vapor phase. Mathematically, because A = L/mG, and m = P*/P, a decrease in P increases m, causing a decrease in A.
An Increase in Column Temperature: Intuitively, an increase in column temperature favors the vapor phase. Mathematically, because P* increases with temperature, so does m, causing a decrease in A.
There Is Channeling in the Packed Bed: If there were channeling in the packed bed, not all of the available (and designed for) mass transfer area would be used. This could cause faulty absorber performance.
To reiterate, the process inputs would be checked. If they were not found to be the problem, then process operation would be investigated. The next step would be to check for fully open or closed control valves. In this problem, it is assumed that control valves are still controlling and are not the cause of the observed problem. Phase 2 is also not applicable because there is only one unit operation involved in this problem.
Phase 3 involves a detailed analysis of the suspects. In Example 24.1, Items 1, 2, 5, and 6 can be represented on the Colburn graph. For these items, the diagnosis is that the absorption factor has decreased, which moves the operating point for the column vertically at constant NtoG = 6.2 to point “b.” The new absorption factor is 1.15. The problem could be in any (or a combination of all) of the parameters of the absorption factor. L could have decreased to 17,391 mol/h, or G could have increased to 46,000 mol/h. Alternatively, the value of m could have changed to 0.388, meaning that the temperature of the column increased to about 30°C (30.5°C), or that the column pressure decreased to 0.87 atm. However, because the air stream discharges to the atmosphere, a decrease in column pressure below 1 atm is not possible.
There is an alternative diagnosis, however, which is Item 3 in Example 24.1. The operating point can remain fixed in the original position (point “a”), but the outlet acetone concentration in air increased due to the presence of acetone in the water fed to the column. This makes the second term in the numerator and denominator of the y-axis nonzero. Solution for the inlet acetone concentration in water yields a mole fraction of 0.00312.
Thus far, five possible causes for the observed increase in outlet acetone concentration in air have been identified. There are certainly additional possible causes, some of which are associated with equipment operation such as liquid distribution, channeling, and fouling, which could also contribute to the observed performance decrease. One of these is identified as Item 6 in Example 24.1.
At this point, there is not enough information given to complete Phase 3 to identify the root cause of the problem. The next step would be to measure the input flows and concentrations, column temperature, column pressure, and column pressure drop (a measure of channeling). This should allow identification and verification of the root cause of the problem.
If the root cause of the reduced performance of the absorber is understood, then possible methods of compensation are straightforward (Phase 4). Here, it is assumed that compensation cannot be achieved by altering the cause of the disturbance; that is, if the cause is an increased gas rate, then the gas rate cannot be lowered. However, in the context of a chemical process, the possibility of reversing the disturbance should be investigated.
If the gas rate is too high, the liquid rate can be increased to compensate. However, flooding could become a problem, especially if both gas and liquid rates are increased. The Colburn graph does not account for flooding, which is specific to a given packed column.
If the liquid rate is too low, it is unlikely that the gas rate can be decreased without scaling down the entire process. A better choice might be to decrease the temperature of the absorber to 22°C, increase the pressure in the absorber to 1.15 atm, or make a combination of changes in temperature and pressure, in order to make the absorption equilibrium more favorable and bring the absorption factor back to a value of 1.48.
If a temperature increase is the problem and altering flowrates is not desirable due to flooding considerations, one possible compensation is to alter the pressure (usually difficult for these types of problem). Another might be to decrease the temperature of the water used to remove the acetone from the air. Increasing the liquid rate moves the column toward flooding, but a small increase should not be a serious problem.
Finally, if the cause of the disturbance is acetone in the water, compensation can be accomplished by decreasing the temperature, increasing the liquid rate, or increasing the pressure. For this situation, the stripping column used to remove scrubbed acetone from the water stream should also be investigated, because the cause of the faulty absorber performance may lie in an adjacent piece of equipment.
In general, adjusting the temperature or pressure is probably the best method of compensation, because flooding is not an issue. Of course, there can be multiple causes of the disturbance, and compensation can be achieved by adjusting two variables by smaller amounts rather than by adjusting only one variable.
As an example of Phase 5, suppose that the root cause was determined to be an increase in acetone content of the scrubber liquor (water). It is necessary for you to notify anyone else using the same water supply of the acetone contamination. Similarly, suppose that channeling in the absorber was identified as the problem. It is necessary to report the operating conditions that caused the channeling to other parts of the company using the same packing material.
To review, this relatively simple problem illustrates how there can be multiple possible causes and multiple solutions to a troubleshooting problem. The strategy presented here for solving troubleshooting problems was illustrated.
24.2.2 Troubleshooting the Cumene Process Feed Section
This problem deals with the feed section to the cumene process in Appendix C, Figure C.8. This problem is actually part of the problem presented in Appendix C, and the process flowsheet along with calculations associated with the pumps can be found there. The problem is restated here.
A problem has recently arisen regarding the feed pumps to the cumene process. A maintenance check showed that P-802 (propylene feed pump) needed a new bearing, and a new one was installed. Premature bearing failure in this pump, often associated with cavitation, has occurred several times. The latest problem occurred during a recent warm spell, when the ambient temperature reached 110°F. The same maintenance check showed that P-801 (benzene feed pump) was fine. The ambient temperature has now returned to an average of 70°F, and both pumps seem to be working fine. Suggest a diagnosis and a method for compensation for the problem with P-802. In the process description in Appendix C, it is stated that propylene is stored in a tank as a saturated vapor/liquid mixture with liquid drawn from the tank as feed, and that liquid benzene is stored in a tank (most likely with an inert vapor blanket such as nitrogen) at atmospheric pressure.
In this case, the problem is immediately verified; the bearing had to be replaced. A check of the pump input might identify a contaminant that could have caused the bearing to deteriorate. It is assumed that no such contaminant was found. Because the unit operation producing the problem has already been identified, the root cause of the problem must be identified (Phase 3).
An intuitive understanding of pump operation suggests that the primary suspect is cavitation of P-802. This is consistent with the need for replacement of a bearing because cavitation can damage the internals of a pump. This may also be consistent with the recent warm spell, because the available Net Positive Suction Head, NPSHA, often decreases at higher temperatures due to increasing vapor pressure. Recalling the discussion in Section 19.5.2,
Because the vapor pressure P* increases with increasing temperature, it seems logical that the available NPSH decreased during the warm spell, causing cavitation that damaged the pump bearing. Example 24.2 shows the results of an analysis of the propylene feed pump.
Calculate the NPSHA for the propylene feed pump under normal ambient conditions (70°F) and for the warm spell (110°F).
Equation (24.1) can be rewritten as in Section 19.5.2, with an expression for Pinlet substituted.
For the case of propylene being stored as a vapor/liquid mixture, the pressure in the tank is equal to the vapor pressure. As a consequence, NPSHA does not change with temperature because Ptank = P*. Therefore, the NPSHA = 7 feet of liquid at the level alarm low (LAL—the tank level at which an alarm goes off warning of too low a liquid level in the tank) in the tank at all temperatures, as per the calculations shown in Appendix C.
The lesson learned from Example 24.2 is that although a belief in the understanding of how equipment works can help you focus on a solution to a troubleshooting problem, the tendency to focus on the first solution or on only one solution can lead to an erroneous solution.
Resist the temptation to focus on only one solution or the first solution that comes to mind.
The reason why the pump malfunctioned is still not clear. If cavitation were the reason, the NPSHA expression should be investigated further. It is now known, for this situation, that
reasons must be sought why this expression may have decreased in value. There may be reasons for the pump malfunction not associated with the NPSHA. Therefore, five additional possibilities that should be analyzed (Phase 3) for causing the pump malfunction are as follows:
The static pressure has decreased. Perhaps the level in the tank has fallen below the low alarm level and the alarm has failed. Therefore, these items should be checked.
The frictional pressure has increased. Perhaps the flowrate from the tank has increased, causing an increase in frictional losses. The flowrate monitors and the settings on the control valve after the pump should be checked. This scenario would have additional consequences, because an increased propylene flowrate would have an effect on reactor conversion and possibly on product production rate and purity. Therefore, the flowrate and purity of the reactor effluent should also be checked.
The bearing in the pump wore out with age. Just because pump cavitation often causes damage to pump internals such as bearings does not mean that it was the cause of this pump’s malfunction. Given the analysis above, it is possible, indeed likely, that the pump malfunction observed here was simply caused by a worn bearing.
Mechanical problems in the pump. The bearing could be wearing out prematurely due to poor shaft alignment within the pump.
There is a manufacturing defect within the pump. If the pump shaft or other internals were defective (incorrect size, for example), the bearing might wear out prematurely.
The recommended action (Phase 4) will depend upon which (if any) of the five causes of bearing failure listed above is identified to be the problem. If problems are found with the pump (Item 4 and/or 5), it would be appropriate for you to notify others in your company using the same pump or similar pumps from the same manufacturer of the problem you have had with your pump.
24.3 Troubleshooting Multiple Units
In this section, two troubleshooting case studies are presented that involve multiple unit operations. One of the lessons of these case studies is that the symptoms of a problem are not necessarily observed at the source of the problem. In these two case studies, only one solution is discussed. Generation of alternative possibilities is the subject of problems at the end of the chapter.
24.3.1 Troubleshooting Off-Specification Acrylic Acid Product
This problem concerns an acrylic acid production process similar to the one in Appendix B, Figure B.9.1. The process flow diagram, stream flows, and equipment specifications are presented there.
At another acrylic acid plant owned by your company, process shutdown for modifications and improvements has recently been completed, and the process has been started up once again. Customers have begun to complain that the acrylic acid product does not appear to be meeting specifications. They have observed that the acrylic acid has a yellowish color, which is different from the clear liquid they had previously received. Their tests also found that the viscosity of the acrylic acid has increased.
The following process modifications were completed during the recent shutdown:
A new catalyst that is supposed to minimize side reactions was installed in the reactor. The reactor specifications were not changed.
A new solvent is now being used in the extraction unit. It is less expensive than the previous solvent, and the performance of the extraction unit is supposed to be unchanged. No modifications were made to the extraction equipment.
As a cost-cutting measure, refrigerated water (entering at 10°C) has been replaced by cooling water (entering at 30°C) in the acrylic acid purification column. The column has 25 actual trays with 2.25-in weirs, a total condenser, and a partial reboiler.
The following operating restrictions are also known: For the new catalyst, the operating range is between 250°C and 350°C and between 1 bar and 5 bar. Once the acrylic acid has been produced and condensed into the liquid phase, the temperature is to be maintained below 90°C to avoid polymerization of the acrylic acid.
The first step is to verify the problem. Assume that you had a technician take a sample of acrylic acid product, and the yellowish color and increased viscosity were both verified. This means that the problem is not in the shipping and storage steps but is within the plant. Therefore, the problem is yours, not the customer’s. Further, assume that all process inputs have been checked and found to be within normal operating conditions, and that a check has found no control valves to be fully open or closed.
There are several possible causes for the off-specification acrylic acid product. The most likely causes are changes that may have occurred during shutdown. Perhaps the new catalyst is not performing as designed. Perhaps the new solvent is contaminating the product. The reactor effluent and the extractor effluent streams should be checked for contamination. Suppose that has been done, and everything has been found to be within normal conditions. Therefore, the most likely cause involves the temperature in the acrylic acid distillation column. In this column, acrylic acid and acetic acid are separated. It will be assumed that this is a simple binary distillation.
There must have been a reason for using refrigerated water in the distillation column prior to the recent shutdown. This can be understood using the following analysis. From tabulated data [2], the following vapor pressure expressions can be obtained for acrylic acid and acetic acid:
Because acrylic acid is the heavier component, the bottom of the column must remain below 90°C to avoid undesired acrylic acid polymerization. From Equation (24.3), assuming that pure, saturated acrylic acid leaves the bottom of the column, the pressure at the bottom of the column is 118 mm Hg, which is 5.26 ft of liquid, assuming that liquid acrylic acid and liquid acetic acid have the same density as liquid water. The pressure drop per tray will be approximated by the height of liquid on the tray. The height of liquid on each tray will be approximated by the weir height. Because there are 25 trays, the pressure drop in the column is
Therefore, the pressure at the top of the column is 5.26 – 4.69 = 0.57 ft liquid = 12.8 mm Hg. From Equation (24.4), assuming pure, saturated acetic acid at the top of the column, T = 21°C. Because cooling water enters at 30°C, it is not possible to condense acetic acid at 21°C with cooling water. This is why refrigerated water was used in the original design.
The above discussion suggests that the switch to cooling water could be one reason for the off-specification acrylic acid product. With cooling water available at 30°C, it is not possible for the top of the column to be less than 30°C, which places a lower bound on the top pressure of the column. Because the pressure drop in the column is essentially fixed by the weir height on the trays, there is also a lower bound on bottom pressure in the column, which places a lower bound on the bottom temperature, which is greater than 90°C, thereby promoting polymerization. Apparently, this column has no control room pressure reading (perhaps the instrument is out of order). Therefore, an operator would be sent to measure the pressure at the top of the column.
There is one simple remedy. Refrigerated water should be used in the condenser. If this is not desirable for the long term, the incremental economics of modifying the trays to have lower weirs (or using a low pressure drop, high efficiency packing) could be considered, which could happen only at the next plant shutdown. It is also necessary for you to report this problem to any other plants within your company making acrylic acid so that they can avoid (or correct) problems arising from the use of cooling water instead of refrigerated water.
It is observed that rough calculations involving certain reasonable, simplifying assumptions were used to obtain an approximate result very quickly. It is neither necessary nor desirable to do detailed calculations when screening alternatives in a troubleshooting problem. The approximations that were made to facilitate a rapid calculation for the distillation column were that the top and bottoms products were pure and that the height of liquid on the trays equaled the weir height. Although these are not exactly true, detailed calculations would show that these are good approximations.
When screening alternatives, rough calculations using reasonable approximations are more useful than detailed simulations.
24.3.2 Troubleshooting Steam Release in Cumene Reactor
This problem involves the reactor in a cumene process similar to the one in Appendix C, Figure C.8. The process flow diagram is presented in Appendix C.
A company has been testing a new cumene catalyst at a facility producing the identical amount of cumene as the one in Appendix C. The new catalyst completely suppresses the undesired DIPB formation reaction. However, the reaction rate for the desired reaction is lower. Therefore, when the new catalyst is used in the existing reactor, a single-pass conversion of only 50% is obtained. This new catalyst, which is less expensive than the previous catalyst, is known to have a higher initial activity that decays rapidly to constant activity. During the initial activity period, a 33% increase in cumene production has been observed. The operating parameters of the benzene distillation column have been altered, the recycle benzene stream has been increased, the DIPB column has been taken off-line, and the plant has been producing cumene successfully.
The reactor for cumene production, which is shown in Figure 24.5, is of the shell-and-tube design, with catalyst in the tubes and boiler feed water vaporized to form high-pressure steam in the shell. The pipe to the steam header is 2-in schedule 40 and contains 32.5 m of equivalent pipe length after the regulating valve. Under normal operating conditions, the pressure drop across the regulating valve is 50 kPa. There is a pressure-relief valve on the shell side of the reactor rated at 4500 kPa. The tubes are completely submerged in the boiler feed water. As part of the test of the new catalyst, the plant has been shut down briefly every three months for the past year, and the catalyst has been replaced so that the spent catalyst could be studied.
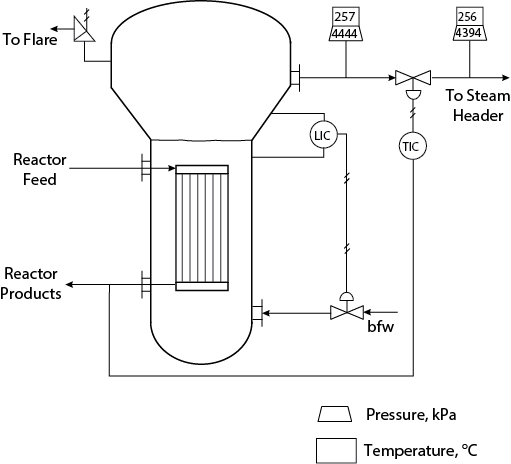
After start-up subsequent to each shutdown, the pressure-relief valve on the shell side of the reactor has opened periodically for a few days. Because only steam was released and it is not in a part of the plant where anyone could be harmed, the problem was attributed to start-up transients and was ignored. A recent safety audit has resulted in the suggestion that the cause of this problem be identified and corrected.
The problem is verified by the observation of a steam release. Assume that you have checked all process inputs, the operation of all other units, and control valves and you have decided that the problem must be at the reactor. A check of the reactor feed and the boiler feed water input reveals normal conditions. Therefore, the problem must be with reactor operation, which points to the higher-activity catalyst.
First, it is necessary to calculate some operating parameters for the design conditions. Under normal operating conditions, from Appendix C, the heat generated in the reactor is 9800 MJ/h. The amount of steam formed can be calculated from
Solving for the mass flow of steam yields
Here, the heat capacity of water is taken at an average temperature of 173°C, and the temperature of steam formed in the shell corresponds to the pressure in the shell calculated below. Because high-pressure steam is made, the pressure of steam downstream of the reactor is that of high-pressure steam, 4237 kPa. Under design conditions, the pressure of steam in the reactor exceeds this value to account for the pressure drop in the pipe leading to the steam header and across the regulating valve. The density of the steam varies with the pressure. It will be assumed that the average steam conditions between the reactor shell and the steam header are 255°C and 4300 kPa. At these conditions, the density of steam is about 17.6 kg/m3. For 2-in schedule-40 pipe (D = 0.05250 m), at the given mass flow and density of steam, the velocity in the pipe is 28.3 m/s, so the Reynolds number is
For commercial steel pipe, e/d = 4.6 × 10⁻⁵ m/0.0525 m = 0.0009. From Figure 19.6, the friction factor f = 0.009. Therefore, the pressure drop in the pipe leading to the steam header is
The pressure in the reactor shell, under normal conditions, is the pressure at the steam header plus the pressure drop in the pipe plus the pressure drop across the valve, which is
The situation immediately after catalyst replacement can be analyzed using base-case ratios. If the activity of the new catalyst is higher than that of the old catalyst, then the reaction rate is increased. Because the only reaction involved is for cumene production, 33% more steam is produced. Therefore, the steam velocity in the pipe leading to the steam header is increased by 33%. Because the flow is fully turbulent, the friction factor remains constant, and, assuming unchanged density,
where subscript 2 refers to new conditions and subscript 1 refers to design conditions. Therefore,
If it is assumed that the control system has responded by opening the regulating valve completely, so there is no pressure drop across the valve, then the pressure in the reactor shell is
which exceeds the rating for the pressure-relief valve, causing it to open and release steam.
Now that the problem has been identified, the next question is how to compensate for this problem. It is likely that necessary changes can be made only during the next shutdown, which is not a problem because there are no releases for most of an operating cycle. One alteration would be to reset the pressure-relief valve to a higher pressure. Caution is warranted here because the 4500 kPa limit was originally chosen for a reason. The pressure ratings for the materials of construction and reactor design should be checked very carefully to determine their limits.
Another simple solution would be to replace the line leading to the steam header with larger-diameter pipe. The next larger size, 2.5-in schedule 40, has a diameter D = 0.06271 m. Using a relationship from Chapter 19, a base-case ratio at the original flowrate is
So the pressure drop, under normal operating conditions with the new pipe, is
ΔP2 = 157 kPa(0.41) = 64.4 kPa
and the pressure drop with the new pipe with increased catalyst activity is
ΔP2 = 64.4 kPa(1.77) = 114 kPa
and the pressure in the reactor is
Prxr = 4237 + 114 = 4351 kPa
With the larger-diameter pipe, it is possible for there to be a pressure change across the regulating valve without exceeding the cutoff pressure of the relief valve.
Finally, you should report these results and explanations clearly so that proper modifications can be made in similar plants prior to switching to the new catalyst.
24.4 A Process Troubleshooting Problem
In this section, a troubleshooting problem involving an entire process is presented [3]. It is based on the production of cumene problem presented in Appendix C, Figure C.8. The process flowsheet and stream flow table are included in Appendix C.
Lately, Unit 800 has not been operating within standard conditions. There is a new supplier of propylene; however, the contract guarantees that the new propylene feed will contain less than 5 wt% propane.
Upon examining present operating conditions, the following observations were made:
Production of cumene has dropped by about 8%, and the reflux in T-801 was increased by approximately 8% in order to maintain 99 wt% purity. The flows of benzene (Stream 1) and propylene (Stream 2) have remained the same. Pressure in the storage tanks (not shown on the flowsheet) has not changed appreciably when measured at the same ambient temperature.
The amount of fuel gas being produced has increased significantly and is estimated to be 78% greater than before. Additionally, it has been observed that the pressure control valve on the fuel gas line (Stream 9) leading from V-802 is now fully open, whereas previously it was controlling the flow.
The benzene recycle, Stream 11, has increased by about 5%, and the temperature of Stream 3 into P-201 has increased by about 3°C.
Production of steam in the reactor has fallen by about 6%.
Catalyst in the reactor was changed six months ago, and previous operating history (over the last ten years) indicates that no significant drop in catalyst activity should have occurred over this time period.
p-diisopropyl benzene (p-DIPB) production, Stream 14, has dropped by about 20%.
Suggest possible causes and potential remedies for the observed problems.
The reactions are as follows:
Assume that all of the above symptoms have been verified. The next step would be to check process inputs, which might reveal off-specification feed. This might immediately identify the problem. A check of the control valves verifies that only the valve in Stream 9 is fully open, as stated in Observation 2. If there were no problems with the feed, the next step would be to check the individual units to determine which ones were not operating within normal limits. As part of Phase 2, analyze the six observations above to determine what they suggest.
An analysis of the six observations above suggests the following:
Observation 1 suggests that either less cumene is being produced in the reactor or that significant cumene is being lost as fuel gas. If it is assumed that the feeds are unchanged, these are the only possibilities.
Observation 2 suggests that the fuel gas rate has increased significantly. Components of fuel gas could be cumene, unreacted propylene and benzene, propane, and p-DIPB.
Observation 3 suggests that additional benzene is being processed in the distillation column. The temperature increase could be due to the increased concentration of benzene relative to propane and propylene at the top of T-801.
Observation 4 suggests that less cumene is being formed in the reactor. This is the opposite situation to that in the case study presented in the previous section.
Observation 5 suggests that catalyst deactivation should not be a problem. This does not necessarily guarantee that catalyst deactivation is not a problem.
Observation 6 suggests that the selectivity for the desired reaction, Equation (24.7), has increased.
Among the possible causes of some of these observations are the following:
The propylene feed contains propane impurity in excess of 5 wt%. Even though the new supplier claims that the propylene meets specifications, it is possible that the propylene is off-specification. This would be verified in Phase 1. If the propylene feed contains undetected excess propane, it is likely that the feed rate would be unchanged. (This could also be verified.) Therefore, the concentration of propylene in the reactor feed would decrease, thereby decreasing the reaction rate. Conversion in the reactor would then decrease. An examination of Figure 24.6, the approximate reactor profiles, shows that a decrease in reactor conversion would have a larger percentage effect on the p-DIPB, because its concentration is lower. Examination of the kinetics, which are based on the assumption that Equations (24.7) and (24.8) are elementary steps, also supports this diagnosis. If the concentration of propylene is decreased, the rates of Equations (24.7) and (24.8) decrease. This decreases the concentration of cumene in the reactor, which causes the rate of Equation (24.8) to decrease even further, reducing the p-DIPB concentration more than the cumene concentration. If this reactor scenario were true, then there would be additional propane leaving the reactor. This would increase the flow of fuel gas, which is mostly propane and propylene, and increase the recycle, which is mostly benzene. It is seen that this scenario is consistent with all six observations.
The catalyst is defective and has begun to deactivate. This could be checked by analyzing samples of the reactor input and reactor output. If the catalyst is defective and has begun to deactivate, all reaction rates would decrease. This would result in less cumene and p-DIPB and more unreacted benzene and propylene. This scenario is consistent with five of the six observations. Because the possibility of bad catalyst must be acknowledged, this scenario is also possible.
Reactor temperature has decreased. This could be checked in the control room, but the possibility of a faulty thermocouple or indicator should also be considered if the “correct” temperature was observed. A decrease in reactor temperature would result in decreased reaction rates. Qualitatively, the results are similar to those for deactivated catalyst in Item 2.
Reactor pressure has decreased. This could be checked in the control room, but the possibility of a faulty pressure transducer or indicator should also be considered if a “correct” pressure was observed. A decrease in reactor pressure would result in a decrease in all gas-phase concentrations and a decrease in all reaction rates. Qualitatively, the results are similar to Items 2 and 3.
The flow controllers on Streams 1 and/or 2 have failed. Suppose that the benzene flow were increased or the propylene flow were decreased. The benzene concentration would increase, which would increase the excess benzene and increase the selectivity for the desired reaction. This is consistent with the last observation above. If this were not observed in the control room, the possibility of faulty instrumentation should be considered.
The temperature and/or pressure in V-802 is not at specification. This could be checked, but a “correct” reading could be due to faulty instrumentation. If the temperature and/or pressure in the flash vessel were incorrect, the desired separation would not be accomplished. If the temperature were too high and/or the pressure were too low, additional fuel gas would be produced, causing less cumene to leave as product and less benzene in the recycle. If the opposite were true, additional feed to the distillation column would be produced, which could cause flooding in the column and compromise the desired separation.
The problem stems from a combination of any or all of the above items. There is no guarantee that the problem has only one cause. Therefore, combinations of the above possibilities should be considered.

An examination of Items 1–7 suggests that taking a sample of the fuel gas would identify the root cause of the problem. If there was too much propane in the fuel gas, the problem would be with the feed. If there was too much benzene in the fuel gas, the problem would be reduced conversion in the reactor. If there was too much or too little cumene in the fuel gas, the problem would be that the temperature and/or pressure of the flash was incorrect.
The next question is how to remedy the problem. It is not always necessary to identify the cause of a problem in order to begin to compensate. However, it is necessary to identify the problem to ensure that it does not recur. It is also necessary to be certain that what appears to be a remedy is not itself a problem. For example, if the propylene feed contains excess propane or if the catalyst was deactivated, it would still be necessary to find a way to compensate temporarily until new feed and/or catalyst could be obtained. Also, detailed quantitative solutions may not be necessary as long as the qualitative trends are understood.
In order to suggest remedies, it will be assumed that the cause of the observed process upset is in the process feed and in the reactor (Items 1 and 2). Possible remedies include, but are not limited to, the following:
Increase the temperature in the reactor. Intuitively, this seems like a reasonable possibility. However, Chapter 22 should be consulted for the limitations associated with increasing reactor temperature. Increasing the reactor feed temperature can be accomplished by increasing the air and natural gas flows to the fired heater, but the reactor operation is limited by heat transfer. Increasing the reaction temperature increases the reaction rate exponentially, so a large temperature increase should not be needed. However, increasing the inlet temperature does not guarantee that the reactor operation will change appreciably. One consequence of increasing reactor temperature is that the temperature of the boiling water used to remove the heat of reaction must increase. This requires an increased steam pressure. It must be determined whether the materials of construction of the reactor can withstand the required pressure increase. The temperature limitations of the catalyst support and of catalyst activity must also be considered. Increasing the temperature high enough to damage the catalyst is an example of the remedy causing another problem.
Increase the pressure on the process side of the reactor. Increasing the pressure in the reactor can be accomplished by closing the valve after the reactor. The increase in pressure increases the reaction rate by increasing the concentration. The effect is not as significant as for temperature, because temperature increases the reaction rate exponentially.
Increase the flow of propylene feed. Increasing the propylene feed can be accomplished only by using the spare pump (P-802B) in series or in parallel with the operating pump (P-802A), due to limitations in pumping capacity shown on the pump and system curve plot, which is shown in Appendix C. In principle, the flow of propylene can be increased enough so that the specified cumene production rate is achieved in the reactor. However, it must be determined how each piece of equipment will perform when subjected to the increased capacity and concentration changes caused by this remedy.
There are several lessons to be learned from this process troubleshooting problem. As discussed earlier in this chapter, it is important not to focus on one possible solution to the exclusion of others. It is important to consider as many alternatives as possible. Several possible causes were presented here for the observed process upsets. Without detailed measurements and/or simulations, which take more time to perform, the other possibilities could not be ruled out. They would cause the same qualitative trends, but different quantitative values for the upset parameters.
It is also important to observe that a problem in the reactor was manifested in process locations far removed from the reactor: the fuel gas, the benzene recycle, the cumene production rate, and the p-DIPB production rate.
The cause of an observed process upset may be located in a different part of the process.
Finally, if the problem was identified to be impure propylene feed or defective catalyst, it would be necessary to report this problem to other plants in your company using the same propylene feed supplier or the same catalyst.
24.5 Debottlenecking Problems
In the course of operating a chemical process, it may become necessary to modify operating conditions. Possible changes include scale-up, scale-down, handling a new feed composition, and so on. A bottleneck is defined as the part of the process that limits the desired change. Troubleshooting the bottleneck is called debottlenecking. Debottlenecking is a sequential process. A bottleneck is identified and removed. The next bottleneck is then identified and removed, and so on. The removal of these bottlenecks does not usually involve a large capital investment.
The performance of a heating loop problem for the allyl chloride reactor given in Appendix C will be evaluated. It is necessary to scale up production of the allyl chloride facility (see Appendix C, Figure C.3) due to an unscheduled shutdown at a similar facility owned by the same company. The problem is to determine the maximum level of scale-up possible for the allyl chloride facility. Therefore, it is necessary to determine the maximum scale-up possible for the reactor.
The problem to be analyzed is illustrated in Figure 24.7. It is a part of the allyl chloride problem discussed in more detail in Appendix C.
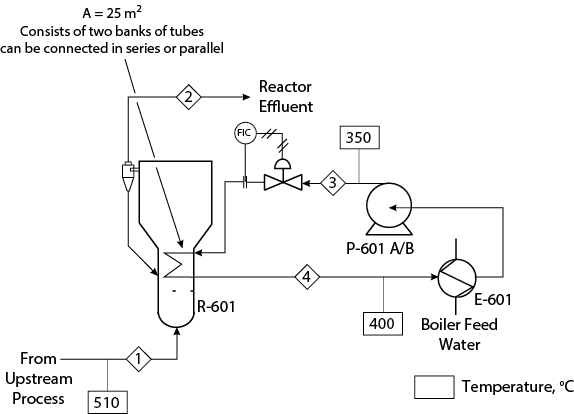
Due to an emergency, an unscheduled shutown at an another allyl chloride production plant operated by your company, it is necessary to increase production temporarily at your plant. Your job is to determine the maximum scale-up possible for the allyl chloride production reactor. The reactor is a fluidized bed, with a cyclone for solids recovery, operating isothermally at 510°C. The reactor is operating at two times the minimum fluidization velocity. Based on the cyclone design and the solids handling system, it is known that an increase of at least 100% of process gas flow can be accommodated. The reaction proceeds to completion as long as the reactor temperature remains at 510°C. A temperature increase destroys the catalyst, and a temperature decrease results in incomplete reaction and undesired side products. The reaction is exothermic, and heat is removed by Dowtherm A circulating in the loop. The maximum operating temperature for Dowtherm A is 400°C, and its minimum operating pressure at this temperature is 138 psig. There are two heat-exchanger units in the reactor, and they are currently operating in series. The heat transfer resistance on the reactor side is four times that on the Dowtherm A side. The inside of the reactor is always at 510°C due to the well-mixed nature of the fluidized solids. There is a spare pump to circulate the Dowtherm A. High-pressure steam is made from boiler feed water in the heat exchanger. The boiler feed water is available at 90°C and has been pumped to 600 psig by a boiler water feed pump that is not shown. The pool of liquid being vaporized can be assumed to be at the vaporization temperature, 254°C. All resistance in the heat exchanger is assumed to be on the Dowtherm A side. At normal operating conditions, Dowtherm A circulates at 85 gal/min in the loop. The temperatures of each stream are shown in Figure 24.7. The pump curve for the pump in the loop is shown in Figure 24.8.
An energy balance on the process fluid in the reactor yields
where is the molar flowrate of chlorine (the limiting reactant), and the subscript R refers to the reactor. The heat of reaction term in Equation (24.9) is on a unit mole basis. Because the heat of reaction is constant during scale-up, Equation (24.9) shows that the amount of heat removed increases proportionally with the amount of scale-up. From this energy balance, there is nothing to suggest that the reactor cannot be scaled up by a factor of 2, the maximum allowed by the reactor. However, the question that must be answered is whether twice the heat can be removed from the reactor by the heat-exchange loop. An energy balance on the Dowtherm A in the reactor yields
where the subscript D refers to the Dowtherm A. From Equation (24.10), it is observed that the heat removal rate is proportional to both the mass flowrate and the temperature increase of the Dowtherm A. Therefore, the most obvious method is to increase the flowrate of Dowtherm A, so it is necessary to determine the maximum flowrate possible for Dowtherm A. Example 24.3 illustrates this calculation.
From the pump curve provided in Figure 24.8 determine the maximum possible flowrate for Dowtherm A in the loop. The pump operates at only one speed, described by the curve given in the figure. The pressure drops between streams are shown in Figure E24.3.

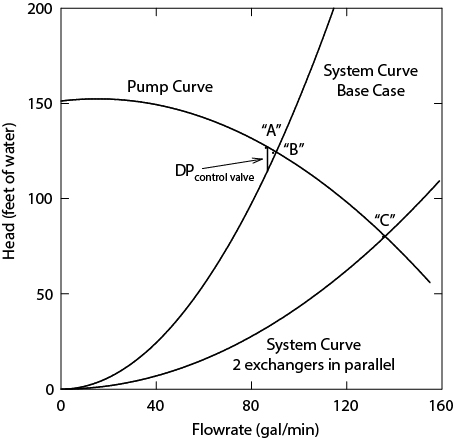
The pump operates only at conditions shown on the pump curve. The pressure drop in the system and regulating valves must equal the pressure delivered by the pump. The base-case solution gives one point on this line (point “A”). Of this total pressure drop, 15 feet of water is from the control valve, which can be adjusted independently. The remaining pressure drop, 110 feet of water (125 - 15 feet of water), is the system pressure drop and is dependent on the flowrate through the system. The system pressure drop can be obtained from the equation for frictional pressure losses.
Taking the ratio of Equation (E24.3a) for the scaled-up case (subscript 2) to the base case (subscript 1) for constant L, D, and the assumed constant friction factor (high Reynolds number, fully developed turbulent flow) yields
where M is the scale-up factor, the ratio of the scaled-up Dowtherm A flowrate to that for the base case. Equation (E24.3b) is plotted with the pump curve in Figure 24.8 The maximum flowrate occurs when the valve is wide open. When the valve is wide open, there is no (or very little) pressure drop across the valve. This is shown as point “B” and occurs at 89 gal/min.
Example 24.3 shows that the maximum scale-up is limited to about 5% by the Dowtherm A flowrate in the loop. A bottleneck has been identified. In order for additional scale-up to be possible, a method for increasing the maximum Dowtherm A flowrate must be found. Several options are possible:
Run only one pump, but operate the reactor heat exchangers in parallel.
Run both pumps (the operating pump and the spare) in parallel, with the reactor heat exchangers in series.
Run both pumps in series, with the reactor heat exchangers in series.
Run both pumps (series or parallel), and operate the reactor heat exchangers in parallel.
Option 1 is illustrated in Example 24.4.
Determine the maximum possible Dowtherm A flowrate for one pump operating with the two reactor heat exchangers operating in parallel.
From Equation (E24.3a), it is seen that
The equivalent length in the heat exchanger is reduced by half for operation in parallel. Half the flowrate goes through each heat exchanger, which means that the Dowtherm A has half the original velocity. Therefore, the pressure drop through the reactor heat exchangers drops by a factor of 8 and becomes 11.25 feet of water. The base-case pressure drop is now 31.25 feet of water. Therefore, a new system curve is obtained. Its equation is
The new system curve along with the pump curve is plotted in Figure 24.8 Point “C” represents the maximum possible flowrate of Dowtherm A, 135 gal/min. This represents a 58.8% scale-up.
Therefore, if only the original pump is used with the reactor heat exchangers in parallel, the Dowtherm A circulation rate can be increased by almost 50%. For Options 2 through 4, additional increases are possible. It should be noted that liquid velocities exceeding 10 ft/sec are not recommended due to potential erosion problems. Therefore, if the original case was designed for the maximum recommended velocity, operation at a 50% higher velocity for an extended period of time is not a good idea. Proceeding with this problem, the assumption is that the original design permits 50% scale-up without exceeding the maximum recommended velocity.
Because the flowrate of the Dowtherm A can be scaled up by 50% does not mean that the heat removal rate can be scaled up by the same factor. Analysis of the heat transfer in both heat exchangers is required. For the reactor, the energy balances were given by Equations (24.9) and (24.10) for the process side and the Dowtherm A side, respectively. The performance equation for the reactor heat exchanger is
For the heat exchanger producing steam, there are two additional equations. One is the energy balance on the boiler feed water to steam side:
where is the mass flowrate of steam, ΔT is the temperature difference between the boiler feed water inlet and the vaporization temperature, and λ is the latent heat of vaporization of the steam. The second equation is the performance equation for the heat exchanger:
The energy balance on the Dowtherm A side is identical (with the temperature difference reversed) to Equation (24.10). It is assumed that all heat removed from the reactor is transferred to make steam (QR = Qh).
Therefore, there are five independent equations that describe the performance of the loop, Equations (24.9)–(24.13). The unknowns are T3, T4, QR = Qh, , , and . For a given value of , the mass flowrate of Dowtherm A, a unique solution exists. The method for obtaining this solution is illustrated in Example 24.5.
From a heat transfer analysis, determine the maximum scale-up possible for the allyl chloride reactor for the original case and for the case of one pump with the reactor heat exchangers operating in parallel.
Ratios of the scaled-up case (subscript 2) to the base case (subscript 1) will be used. Q2/Q1 is the ratio of the heat transfer rates, M is the ratio of the mass flowrates of Dowtherm A, and Ms is the ratio of the mass flowrates of steam. Only three of the five equations are coupled. Base-case ratios of Equations (24.10), (24.11), and (24.13) must be solved for T3, T4, and Q2/Q1. Then Ms and M are determined from Equations (24.12) and (24.9), respectively. The value of Q2/Q1 defines the level of scale-up possible.
The base-case ratios for Equations (24.10), (24.11), and (24.13) are
For the case of maximum scale-up with the original heat-exchanger configuration, M = 89/85 = 1.05. The solutions are
T3 = 348.7°C
T4 = 397.4°C
Q2/Q1 = 1.02
From Equation (24.9), because Q2/Q1 = 1.02, and because the heat of reaction is constant, the process flowrate increases by 2%. So only 2% scale-up is possible.
For one pump with the reactor heat exchangers in parallel, the mass flowrate in each reactor heat exchanger is half of the total flow. Therefore, Equation (E24.5b) becomes
For M = 1.588, solution of Equations (E24.5a), (E24.5c), and (E24.5d) yields
T3 = 331.7°C
T4 = 367.8°C
Q2/Q1 = 1.15
Therefore, 15% scale-up is possible.
Performance of the heat-exchange loop is illustrated on the T-Q diagram shown in Figure 24.9 The lines for the reactor and the steam-generating heat exchanger are unchanged. The line for the Dowtherm A changes slope as the mass flowrate, the reactor heat-exchanger configuration, or the number and configuration of pumps change.

This complex problem illustrates an important feature of chemical processes. Often the bottleneck to solving a problem is elsewhere in the process. In this problem, the bottleneck to reactor scale-up is not in the reactor itself, but in the heat removal loop. Nevertheless, several alternatives are available to increase the Dowtherm A flowrate and scale up the process.
For the problem in Example 24.3, it was determined that the pump in the Dowtherm A loop could handle only 5% increased flow, which allowed only 2% increased reactor operation. Within the reactor portion of the allyl chloride process, the pump is identified as the bottleneck. From the perspective of the entire process, assuming that all other units can be scaled up by more than 5%, the Dowtherm A loop is the bottleneck. It was shown that by operating the two reactor heat-exchange coils in parallel, the reactor could be scaled up by 15%. Altering configuration of the reactor heat-exchange coils is the act of debottlenecking the process. For this problem, it can be shown that additional scale-up in the reactor and Dowtherm A loop is possible by operating the pump and the spare either in series or in parallel. Suppose that the maximum scale-up were now found to be 25%. What if one of the distillation columns downstream could handle only 20% increased throughput before flooding? Then the distillation column would become the new bottleneck. The focus would now be on methods for debottlenecking the distillation column. If this were possible, then another unit would become the bottleneck, and so forth. Therefore, debottlenecking is a progressive problem in which bottlenecks are removed from the process one at a time. Eventually, the maximum possible change, where a bottleneck cannot be removed, will be reached. At this point, a decision would have to be made whether a significant capital investment should be made in order to increase further the maximum scale-up. When significant process modifications involving new equipment are required, the procedure is called retrofitting.
24.6 Summary
In summary, process troubleshooting problems and debottlenecking problems, such as the ones described here, are very realistic problems in terms of what the process engineer will experience. Unlike comprehensive design problems, the troubleshooting problems rely on simple, approximate calculations along with an intuitive understanding of a chemical process rather than repetitive, complex calculations. In order to solve troubleshooting and debottlenecking problems, it is important to develop both an intuitive feel for chemical processes and the ability to do approximate calculations to complement the ability to do repetitive, detailed calculations.
WHAT YOU SHOULD HAVE LEARNED
If there is a process upset, it may be traceable to a distant part of the process.
There are multiple possible causes for a process upset, and all must be considered.
When debottlenecking a process, identify the most severe bottleneck, and if that portion can be debottlenecked, proceed to the next most severe bottleneck, and so on.
References
1. Fogler, H. S., and S. E. LeBlanc, Strategies for Creative Problem Solving, 2nd ed. (Upper Saddle River, NJ: Prentice Hall, 2008), 20.
2. Perry, R. H., D. W. Green, and J. O. Maloney, eds., Perry’s Chemical Engineers’ Handbook, 7th ed. (New York: McGraw-Hill, 1997), 2–61.
3. Shaeiwitz, J. A., and R. Turton, “A Process Troubleshooting Problem,” 1996 Annual ASEE Conference Proceedings, Session 3213.
Problems
1. For the absorber problem in Section 24.2.1, it is necessary to adjust process operation temporarily to handle a 20% increase in gas to be treated.
Can this be accomplished by increasing the liquid rate by 20%?
Suggest at least two additional methods for handling the increase. Be quantitative.
2. A five-equilibrium-stage tray absorber is used for the acetone separation described in Section 24.2.1. It is now observed that the outlet mole fraction of acetone in air is 0.002.
Suggest at least six individual causes for the faulty absorber performance.
For the causes listed in Part (a) that are represented on the Kremser graph, determine the exact value of the parameter (i.e., what flowrate would cause the observed outlet mole fraction?).
For each cause listed in Part (b), suggest at least three compensation methods. Be quantitative.
3. For the situation in Problem 24.2, how would you handle the following temporary process upsets? Be quantitative. Suggest at least three alternatives for each situation.
The gas rate must increase by 10%.
The feed mole fraction of acetone must increase to 0.025.
The outlet mole fraction of acetone in air must be reduced to 0.00075.
4. Suggest additional alternatives for the off-specification acrylic acid in the case study in Section 24.3.1. Analyze the alternatives quantitatively.
5. An acrylic acid facility has been designed to operate successfully using cooling water in the distillation column condenser. However, after a recent warm spell in which the temperature exceeded 100°F for a week, customers complained that the acrylic acid product had the same yellowish color and increased viscosity observed in another plant, as described in Section 24.3.1. Suggest possible causes and remedies for this situation.
6. Suggest additional alternatives for the steam release in the cumene reactor in the case study in Section 24.3.2. Analyze the alternatives quantitatively.
7. During the start-up of a chemical plant, one of the final steps before introducing the process chemicals is a steam-out procedure. Essentially, this step involves filling all the equipment with low-pressure steam and leaving it for a period of time in order to clean the equipment. During one such steam-out, in a plant in Wisconsin, a vessel was accidentally isolated from other equipment and left to stand overnight. Upon inspection the following morning, it was found that this vessel had ruptured.
The company responsible for the design of the plant claimed that the design was not at fault and cited a similar situation that occurred at a plant in Southern California in which no damage to the vessel was seen to occur.
From the above information can you explain what happened? What would you suggest be done in the future in order to ensure that this problem does not reoccur?
8. During the hydrogenation of a certain plant-derived oil, the fresh feed is pumped from a vessel to the process unit. The process is illustrated in Figure P24.8(a).

Figure P24.8 Heat-Exchanger Configurations for Problem 24.8
Because the oil is very viscous, it is heated with steam that passes through a heating coil located in the vessel. The present system uses 50 psig saturated steam to heat the oil. Due to unforeseen circumstances, the 50 psig steam supply will be down for maintenance for about a week. It has been suggested that a temporary connection from the high-pressure steam line (600 psig, saturated) be made via a regulator (to reduce the pressure to 50 psig) to supply steam to the steam coil as shown in Figure P24.8(b).
Do you foresee any problems with the recommendation regarding the high-pressure steam? If so, what recommendations do you suggest?
9. During the start-up and operation of a new plant (see Figure P24.9) the pressure-relief/safety valve on top of the steam drum (V-101) of a waste heat boiler (E-101) has opened and low-pressure steam is escaping to the atmosphere through the open valve.

Figure P24.9 PFD for Problem 24.9
Upon questioning the operators from another unit, you discover that similar incidents have occurred during the initial operation of other process units. However, it appears that the situation remedies itself after a few months.
What could be causing this phenomenon to occur? If the situation does not remedy itself, what permanent solution (if any) would you suggest to fix the problem?
10. For the cumene troubleshooting problem in Section 24.4, it has been determined that off-specification propylene will have to be used for the next several months. To assist in handling this feed, prepare the following performance graphs for use in determining what reactor temperature and pressure are required to compensate for increased propane impurity. Determine the maximum possible propane impurity that can be handled in the given temperature or pressure range without loss of cumene production capability.
A plot of cumene production rate versus propane impurity (from 5 wt% to 10 wt%) at pressures from 2700 kPa to 3300 kPa at 400°C and the original propylene feed rate
A plot of cumene production rate versus propane impurity (from 5 wt% to 10 wt%) at temperatures from 300°C to 400°C at 3300 kPa and the original propylene feed rate
11. In the cumene problem in Section 24.4, assume that one possible remedy involves increased benzene recycle with a corresponding decrease in fresh benzene feed. What are some potential consequences on the benzene feed pump, P-201? Support your answer with calculations.
12. You are in charge of a process to manufacture a polymer in which acetone is used as a solvent. The last step is a drying oven in which residual acetone is removed from the polymer into an air stream. The air is fed to the absorber in Example 24.1. All flows, mole fractions, and physical property data in Example 24.1 are assumed to hold.
It is necessary to scale up polymer production as much as possible. Upstream, there is a spare reactor, dryer, and peripherals, because the plant has been operating below capacity for many years. However, the acetone scrubber was designed and installed recently for the current production capacity. Therefore, it is anticipated that the acetone scrubber will be the process bottleneck. What limit does the acetone scrubber place on scale-up? How would you debottleneck this situation?
13. For the cumene problem in Section 24.4, it has been determined that the feed is off-specification. Until a new propylene supplier can be contracted with, the propylene from the current supplier will have to be used. Tests have shown that this propylene can be expected to have between 5 wt% and 10 wt% propane impurity. It has been decided to try to maintain the design cumene production rate by increasing the propylene feed rate so that a constant, design amount of propylene enters the reactor. Identify the bottlenecks to the proposed process change. Debottleneck this situation.
14. A saturated liquid is stored in a tank in equilibrium with its vapor. The liquid is pumped to a heat exchanger, where the liquid is vaporized. Frictional losses in the suction line to the pump are negligible; however, frictional losses after the pump are such that the liquid is saturated upon entering the heat exchanger. The heat exchanger vaporizes the saturated liquid to saturated vapor while condensing saturated steam to saturated liquid.
In the base case, the liquid vaporizes at 130°C, and the steam used is passed through a desuperheater to create saturated steam at 155°C from saturated, low-pressure steam at 160°C. It is now necessary to increase the flowrate of the vaporized stream. Pump and system curves are provided in Figures P24.14(a) and P24.14(b). Assume that the pressure entering the vaporizer remains constant.

Figure P24.14(a) Process Flow Diagram for Problem 24.14

Figure P24.14(b) Pump and System Curves for Problem 24.14
If the base-case flowrate is 50 m3/h, identify the bottleneck to process flowrate scale-up. What is the maximum possible flowrate increase?
With scale-up, the frictional losses in the suction line to the pump increase. Is the pump in danger of cavitating? Explain your answer.
15. Refer to the drying oil process in Appendix B. The following problems were encountered after the drying oil facility was started up in early August.
Pump P-501 A/B has been noisy since start-up, and the noise (a high-pitched whine) continues to get louder.
Problems have been observed in T-501. Column performance has been below specification. Specifically, the flowrate of Dowtherm A through the reboiler, E-502, has had to be increased in order to keep the products at design specifications.
It has also been noted recently that production rates have fallen during the graveyard shift (12 p.m.–8 a.m.). The head of operations believed that this was due to some of the operators not paying attention to the plant during this shift. However, after talking to all concerned, it appears that there might be a problem with the feed of ACO from the storage tank (not shown on the PFD) to the feed vessel, V-501.
The pressure-relief valve on E-506 has been open from the start of production, and steam has been venting to the atmosphere. This problem was more severe right after start-up; however, it is still occurring. Suggest causes for these problems, identify the most likely causes, and suggest potential remedies.
16. Refer to the drying oil process in Appendix B. Due to an unfavorable business climate for the product, it is possible that production will have to be cut by 20%. Suggest at least three equipment-related issues that might have to be addressed to implement the production cut.
17. Refer to the formalin process in Appendix B.
You have recently joined a chemical company. Among the chemicals that this company produces is methanol, mostly for internal consumption. A major use of internal methanol is to produce formalin, which is a 37 wt% solution of formaldehyde in water. Formaldehyde and urea are used to make urea-formaldehyde resins that are subsequently used as adhesives and binders for particleboard and plywood.
The company recently received a memorandum from a customer who buys this formalin indicating that there are periodic problems, mostly in the summer, with the formalin they are receiving. They claim that the formalin contains unacceptably high amounts of formic acid relative to formaldehyde. It seems that this alters the urea-formaldehyde resin properties such that the particle board and plywood subsequently manufactured do not have the appropriate tensile and load strength. They are threatening legal action unless this problem is rectified immediately.
Storage of formaldehyde/water mixtures is tricky. At high temperatures, undesirable polymerization of formaldehyde is inhibited, but formic acid formation is favored. At low temperatures, acid formation is inhibited, but polymerization is favored. There are stabilizers that inhibit polymerization, but they are incompatible with resin formation. Methanol, at concentrations between 5 and 15 wt%, can also inhibit polymerizaton, but no separation equipment for methanol currently exists on site, and methanol greater than 1 wt% also causes defective resin production. With ≤ 1 wt% methanol, the storage tank contents must be maintained between 35°C and 45°C.
You have toured the plant, checked the logbooks, spoken to engineers and operators, and have gathered the following information:
The catalyst is replaced once per year, and for about five days after start-up, a pressure-relief valve in the reactor (R-801) releases.
During the same time period, bfw consumption in R-801 was not seen to increase beyond normal, day-to-day fluctuations of ±1%, and the reactor outlet temperature was not seen to increase significantly.
Excess acidity occurs mainly in the summer.
All existing equipment is made of carbon steel.
One year ago, an unscheduled, emergency shutdown was required to replace a control system between the tower (T-802) and the subsequent pump (P-803 A/B). Due to availability and time constraints, 1-in schedule-40 pipe was used in place of 1.5-in schedule-40 pipe.
During hot-weather periods, the inlet temperature of cooling water has been observed to increase by as much as 5°C.
During these hot-weather periods, the pressure in the distillation column has been observed to increase slightly, but operation over a long period of time shows no leakage or safety problems associated with this change in pressure.
Pump (P-803 A/B) is located at a height of 5 m below the tower (T-802) exit. There is a total of 30 equivalent meters of pipe, elbows, and valves in the line.
An inspection of the pressure-relief valve on the reactor (R-801) indicates that it is rated at 1115 kPag. It will open at or above that pressure.
Over long periods of time after catalyst replacement, the pressure of medium-pressure steam leaving R-801 is 1110 kPag.
During hot weather, the volume of off-gas leaving the absorber increases by 1%. However, the increase in formaldehyde is about 22%, and the increase in water is about 3%.
Pump (P-803 A/B) constantly makes noise, and each individual pump has been replaced within the last year.
Suggest potential causes for the observed problems, and suggest possible remedies.
18. Delayed coking is an oil refinery process that takes a heavy oil fraction and heats it up to approximately 900°F (480°C) in a furnace. Upon leaving the furnace, the oil is fed to one of two (or more) coking drums, where it is allowed to sit and “cook” for up to 24 hours. During the cooking (coking) process, the oil cracks and gives off a variety of gaseous and liquid products that are processed further. The material remaining in the drums is a solid coke that is subsequently “cut out” of the drum using a very high-pressure water jet. This coke is then shipped out as a salable product. The process is shown in Figure P24.18.
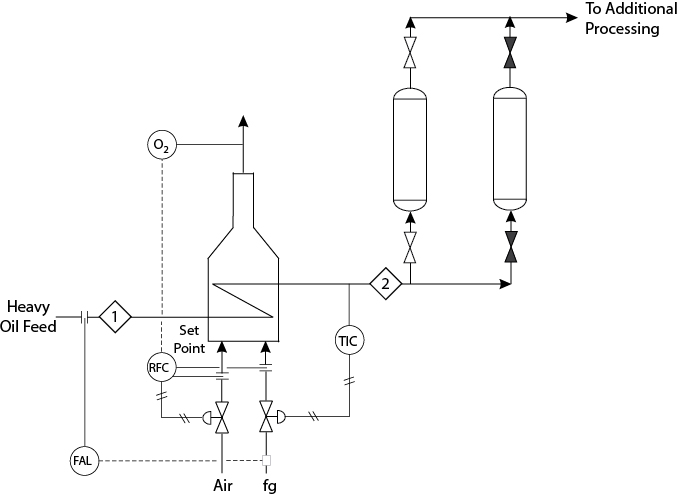
Figure P24.18 PFD for Problem 24.18
The control scheme on the furnace is set to regulate the flow of fuel gas (fg) based on the measured temperature of the exit oil stream (Stream 2). A ratio flow controller adjusts the flowrate of air so that a constant air/fuel ratio is maintained. An oxygen analyzer measures the excess oxygen in the flue gas and adjusts the set point of the ratio controller to maintain the desired air/fuel ratio. A flow alarm is also present to detect a low flow condition in Stream 1 and activates a solenoid shutoff valve to the fuel gas.
A few days ago there was a process upset in which the oil flow to the fired heater was momentarily interrupted. This interruption triggered the shutoff valve, which closed the fuel gas line. The flow of Stream 1 resumed its normal rate after about 30 seconds, at which time the fuel gas solenoid valve opened and the flow of fuel gas resumed. During the upset, the flow of air changed in proportion to the fuel gas flow.
A short time after this process upset, the following conditions were observed. For each scenario given below, give an explanation of what may have happened to cause the observed changes.
The flow of fuel gas to the furnace has slowly increased, and the air flowrate has increased proportionally to maintain the same air/fuel ratio. No other changes have been observed. What could be causing the problem? What do you recommend be done?
The flow of fuel gas to the furnace has increased, the air flowrate has increased proportionally to maintain the same air/fuel ratio, and the flow of products and coke production rate appear to be slightly lower than before (the upset). What could be causing the problem? What do you recommend be done?
The flow of fuel gas to the furnace has increased, the air flowrate has also increased, and the ratio of air/fuel has increased slightly. The flow of products and coke production rate are lower than before (the upset). What could be causing the problem? What do you recommend be done?
19. Study the distillation column in Figure P24.19(a), the stream information in Table P24.19, and the additional information. Use the pump/system curve information in Figure P24.19(b) as needed. It is necessary to scale up the throughput of this column without altering the column pressure.

Figure P24.19(a) Process Flow Diagram for Problem 24.19
Table P24.19 Stream Information for Problem 24.19
Stream |
1 |
2 |
3 |
cw |
Mass flowrate (kg/h) |
77,800 |
55,000 |
17,470 |
71,600 |
Density (kg/m3) |
700 |
700 |
910 |
1000 |
Temperature (°C) |
134.4 |
134.4 |
155.6 |
— |
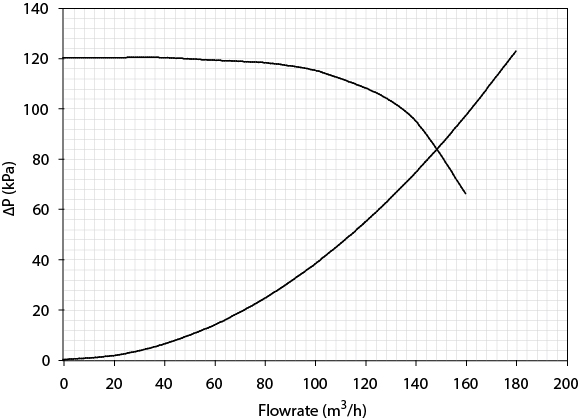
Figure P24.19(b) Pump and System Curve for P-101A/B in Problem 24.19
Identify at least four potential bottlenecks to scale-up you can find, estimate the maximum percent scale-up possible for each, and identify the limiting bottleneck. Quantitative calculations are needed to support your result.
Suggest one method to debottleneck this problem that might possibly be accomplished without shutting the process down. What problem(s) might arise with this solution?
Additional information:
Cooling water supply lines to E-101 are 4-in schedule 40, A = 0.0129 m2
Pump and system curves provided
P-601 A/B not close to cavitation at normal operating conditions
E-102 uses hps desuperheated to 200°C
Column designed to operate at 70% flooding
Cooling water enters at 30°C and design and maximum return temperature are both 40°C
Assume maximum allowable velocity in pipes and tubes is 3.75 m/s
Equal resistances on each side in E-101
Condensation in shell in E-101
20. The distillate stream from a distillation column (flowrate 35 m3/h, fluid has density of water) is recycled. The destination of the recycle stream is 3 m below the fluid level in the reflux drum. First, the recycle passes through a pump to supply sufficient head to overcome frictional losses (20 kPa) and reach the pressure of the stream with which it is mixed (250 kPa above distillate stream). Then, it passes through a heat exchanger in which it is heated from 90°C to 120°C using low-pressure steam at 140°C. Assume that all resistance is on the process-stream side of the exchanger (tube side).
It is desired to scale up the entire plant capacity by 15%. It has been determined that the distillation column can be modified to maintain the recycle stream temperature at 90°C. It has also been determined that, with the required changes in the feed section of the process, the temperature of the recycle stream must be between 119°C and 121°C to satisfy liquid-phase reactor inlet conditions after mixing with fresh feed. Figure P24.20 is the pump curve for the pump in the recycle stream.

Figure P24.20 Pump Curve for Problem 24.20
Can the temperature criterion be satisfied?
Can the flows in this portion of the process be scaled up by 15%?
With a scale-up of 15% desired, what feature must be included in this distillation column so that column operation can be modified to maintain the recycle stream at 90°C?
It is suggested that because a lower temperature of the recycle stream would reduce the reaction rate, if needed, the pumps in the feed section could be used to increase the reactor pressure, and hence the reaction rate. What is your opinion of this suggestion?
21. The distillate stream from a distillation column (flowrate 35 m3/h, density of water) is recycled. The destination of the recycle stream is a point 3 m below the fluid level in the reflux drum. First, the recycle passes through a pump to supply sufficient head to overcome frictional losses (20 kPa) and reach the pressure of the stream with which it is mixed (250 kPa above distillate stream). Then, it is heated from 90°C to 120°C using desuperheated low-pressure steam at 140°C. Assume that all resistance is on the process-stream side of the exchanger (tube side).
It is desired to scale up the entire plant capacity. It has been determined that the distillation column can be modified to maintain the recycle stream temperature at 90°C. It has also been determined that, with the required changes in the feed section of the process, the lowest allowable temperature of the recycle stream is 119°C to satisfy liquid-phase reactor inlet conditions after mixing with fresh feed. Figure P24.20 is the pump curve for the pump in the recycle stream.
What is the maximum possible scale-up percentage based on the heat exchanger?
Can the pump handle the answer in Part (a)?
It is suggested that because a lower temperature of the recycle stream would reduce the reaction rate, if needed, the pumps in the feed section could be used to increase the reactor pressure, and hence the reaction rate. What is your opinion of this suggestion?