Chapter 12: Synthesis of the PFD from the Generic BFD
WHAT YOU WILL LEARN
Design of a chemical process usually starts with a block flow diagram.
Additional information is required to build a process flow diagram from a block flow diagram.
There is a logical order to the synthesis of a chemical process from its component sections.
The evolutionary procedure to create a full process flow diagram (PFD) (as presented in Chapter 1) from the generic block flow process diagram (GBFD) (Chapter 2) is described in this chapter. This full PFD truly defines the process in a chemical engineering sense and is the starting point for chemical and other engineers to design the machines, structures, and electrical/electronic components needed to make the chemical engineer’s vision a reality.
This crucial step in the design of the chemical plant involves all subareas of chemical engineering: reaction engineering, thermodynamics, process control, unit operations, transport phenomena, and material and energy balances. Each is applied to put details into the six general sections of the GBFD—reactor feed preparation, reactor, separator feed preparation, separator, recycle, and environmental control.
In this synthesis, the broader context of the project (e.g., environmental concerns, customer expectations, return on investment) is integrated with the important details such as the type of heat transfer medium or the number of stages in a column. It is crucial to consider as many alternatives as possible in the early stages to try to avoid becoming trapped in a suboptimal design.
It is a common human trait to resist change more strongly as more effort is expended on a task, design, or product. This is described as not wanting to abandon the “investment” in the activity. A good process engineer must be open to new ideas and be prepared to abandon old ones if a better, improved process will be the result.
12.1 Information Needs and Sources
Before the detailed synthesis of the PFD can be completed, basic physical property and kinetics information is needed. It is assumed here that the very basic chemistry of the desired reaction is known, that is, what main feed materials go to what main product. Before PFD synthesis can begin, the marketing personnel should have identified a market need for a specific product, and the chemists have identified at least one way to produce the chemical in the laboratory. Even the marketing and chemistry information, however, will need to be refined. Flowsheet synthesis will uncover the need for more detailed data on the reaction rate, temperature and pressure effects, and market values of products of different purities.
12.1.1 Interactions with Other Engineers and Scientists
Teams of engineers work on the development of the process. For example, the marketing department will find the customer for the plant’s product, and product specifications will be identified. Many chemical engineers are employed as marketing engineers, and they will understand that product purity affects product price, often dramatically so. However, the details of this interplay can be determined only by the process design engineers as the PFD is being developed; only through discussions and negotiations with customers can the marketing engineer determine the relationship between product purity and the product value (i.e., maximum selling price) to the customer.
Similarly, there may be more than one chemical pathway to the product. Pathways of greatest interest to the chemical engineer are not necessarily those of greatest interest to the chemist. The abilities to use impure feed materials and to avoid the production of by-products reduce costs but may not be of interest to a chemist. The costs of small-lot, high-purity laboratory reagents may not even qualitatively correlate to those of multiple tank-car, industrial-grade raw materials. Isothermal operation of small laboratory reactors is common but essentially impossible to achieve on a large scale. It is more economical per unit volume to maintain high pressures on the plant scale than it is in the lab. Simple batch operations are common in laboratory work, but, at plant scale, sophisticated optimization of scheduling, ramp rates, cycle sequencing, and choice of operating mode (batch, semibatch, continuous) is vital. Thus, the chemical process design engineer must be in touch with the chemist to make sure that expensive constraints or conditions suggested by laboratory studies are truly needed.
12.1.2 Reaction Kinetics Data
Before reactor design can begin, the kinetics of the main reaction must be known. However, a knowledge of the kinetics of unwanted side reactions is also crucial to the development of the structure or topology of the PFD, that is, number and position of recycle streams; types, numbers, and locations of separators; batch or continuous operating modes; sterilization operations needed for aseptic operation, and so on. Knowledge of detailed reaction pathways, elementary reactions, and unstable reaction intermediates is not required. Rather, the chemical process design engineer needs to know the rate of reaction (main and by-product reactions) as a function of temperature, pressure, and composition. The greater the range of these independent variables, the better the design can be.
For some common homogeneous reactions, kinetics are available [1–3]. However, most commercial reactions involve catalysts. The competitive advantage of the company is often the result of a unique catalyst. Thus, kinetics data for catalyzed reactions are not as readily available in open literature but should be available within the company files or must be obtained from experiments. One source of kinetics data for catalytic reactions is the patent literature. The goal of someone writing a patent application, however, is to present as little data as possible about the invention while obtaining the broadest possible protection. This is why patent information is often cryptic. However, this information is often sufficient to develop a base-case PFD. The key data to obtain from the patent are the inlet composition, temperature, pressure, outlet composition, and space time. If the data are for varying compositions, one can develop crude kinetics rate expressions. If the data are for more than one temperature, an activation energy can be determined. These data reduction procedures are described in undergraduate textbooks on reaction engineering [4, 5].
Without kinetics data, a preliminary PFD and cost analysis can still be done [6]. In this type of analysis, the differing process configurations and costs for different assumed reaction rates provide estimates of the value of a potential catalyst. If doubling the reaction rate reduces the cost of manufacture by $1 million per year, for example, the value of catalysis research to increase the reaction rate (all other things being equal) is clear. As a guideline, the economic breakpoint is often a catalyst productivity to desired product of ~0.10 kg product/kg catalyst/hour [7]. Another guide is that activation energies are usually between 40 and 200 kJ/mol.
12.1.3 Physical Property Data
In addition to kinetics data, physical property data are required for determining material and energy balances, as well as for sizing heat exchangers, pumps and compressors, and separation units. These data are, in general, easier to obtain and, when necessary, easier than kinetics data to estimate.
For the material and energy balances, pure-component heat capacity and density data are needed. These are among the most widely measured data and are available on process simulators for several thousand substances. (See Chapter 13 for details of process simulators.) There are also reasonably accurate group-contribution techniques for use when no data are available [8]. The enthalpies of mixtures require an accurate equation of state for gases and nonionic liquids. The equations of state available on process simulators are accurate enough for these systems. However, additional heat of solution data are needed for electrolyte solutions, and these data may not be as readily available. For these systems, care should be taken to use accurate experimental data, because estimation techniques are not as well defined (see Chapter 13 for additional information on electrolyte systems).
The design of heat exchangers and the determination of pressure drops across units require thermal conductivity and viscosity data. These data are usually available (often in the databanks of process simulators) and, if unavailable, can be estimated by group-contribution techniques [8].
The most crucial and least available physical property data are for phase equilibrium. Most separators are based on equilibrium stages; thus, these data are usually needed for a process design. For vapor-liquid equilibrium, such as for distillation, either (1) a single equation of state for both phases or (2) a combination of a vapor-phase equation of state, a pure-component vapor pressure, and a liquid-state activity-coefficient model is required. The choice of thermodynamics package for process simulators is explained in Section 13.4. The key experimentally determined mixture parameters for either equations of state or activity-coefficient models are called BIPs (binary interaction parameters), and they have a great effect on the design of separation units. A poor estimation of them (e.g., assuming them to be zero!) can lead to severely flawed designs. The solubilities of noncondensables in the liquid phase are also essential but difficult to estimate.
12.2 Reactor Section
For a process with a reactor, often the synthesis of the PFD begins with the reactor section of the GBFD. (See also Chapter 22.) A base-case reactor configuration is chosen according to the procedures described in reaction engineering textbooks. This configuration (e.g., plug flow, CSTR, batch, semibatch, adiabatic, isothermal) is used at some base conditions (temperature, pressure, feed composition) and some preliminary base specification (e.g., 60% conversion) to calculate the outlet composition, pressure, and temperature. The goal at this stage is to develop a feasible PFD for the process. Optimization of the PFD can begin only after a suitable base case has been developed. If there are obvious choices that improve the process (such as using a fluidized bed instead of a packed-bed reactor, or batch operation instead of continuous), these choices are made at this stage; however, these choices should be revisited later.
To enable later optimization, the general effects of varying the feed conditions should be investigated at this point by using the trend prediction approach of Chapter 22. A list of possible reactor configurations should also be developed. These choices often have dramatic effects on the other parts of the GBFD. The earlier these effects are understood, the better the final design will be.
At this stage, the utility needs of the reactor should be considered. If heating or cooling is required, the design of an entire additional system may be required. The choice of heating or cooling medium must be made based on strategies described in Chapter 15, the heuristics presented in Chapter 11, and the costs of these utilities.
The trade-offs of different catalysts, parallel versus series reactors, and conversion versus selectivity should be considered, even though the optimization of these choices occurs after the base case is developed. Again, early identification of alternatives improves later detailed optimization.
Once the base-case reactor configuration is chosen, the duties of the reactor feed preparation and separator feed preparation units are partially determined.
For the reactor, important questions to be considered include the following:
In what phase does the reaction take place (liquid, vapor, mixed, etc.)? The answer will affect the reactor feed section. For example, if the reaction is in the vapor phase it will determine whether a vaporizer or fired heater is required upstream of the reactor when the feed to the plant is liquid.
What are the required temperature and pressure ranges for the reactor? If the pressure is higher than the feed pressure, pumps or compressors are needed in the reactor feed preparation section. If the required reactor feed temperature is greater than approximately 250°C, a fired heater may be necessary.
Is the reaction kinetically or equilibrium controlled? The answer affects both the maximum single-pass conversion and the reactor configuration. The majority of gas- and liquid-phase reactions in the CPI are kinetically controlled. The most notable exceptions are the formation of methanol from synthesis gas, synthesis of ammonia from nitrogen and hydrogen, and the production of hydrogen via the water-gas shift reaction.
Does the reaction require a solid catalyst, or is it homogeneous? This difference dramatically affects the reactor configuration. For enzymes immobilized on particles, for example, a fluidized bed reactor or packed-bed reactor could be considered, depending on the stability of the enzyme and mass-transfer requirements. The immobilization may also impart some temperature stability to the enzyme, which provides additional flexibility in reactor configuration and operating conditions.
Is the main reaction exothermic or endothermic, and is a large amount of heat exchange required? Again, the reactor configuration is strongly affected by the heat transfer requirements. For mildly exothermic or endothermic gas-phase reactions, multiple packed beds of catalyst or shell-and-tube reactors (catalyst in tubes) are common. For highly exothermic gas-phase reactions, heat transfer is the dominant concern, and fluidized beds or shell-and-tube reactors with catalyst dilution (with inert particles) are used; some examples are given in Chapter 22. For liquid-phase reactions, temperature control can be achieved by pumping the reacting mixture through external heat exchangers (for example, in Figure B.11.1). For some highly exothermic reactions, part of the reacting mixture is vaporized to help regulate the temperature. The vapor is subsequently condensed and returned to the reactor. External jackets and internal heat transfer tubes, plates, or coils may also be provided for temperature control of liquid-phase reactions. (See Chapters 18 and 22.)
What side reactions occur, and what is the selectivity of the desired reaction? The formation of unwanted by-products may significantly complicate the separation sequence. This is especially important if these by-products are formed in large quantities and are to be purified for sale. For high-selectivity reactions, it may be more economical to dispose of by-products as waste or to burn them (if they have high heating values), which simplifies the separation section. However, for environmental reasons, great emphasis is placed on producing either salable by-products or none at all.
What is the approximate single-pass conversion? The final single-pass conversion is determined from detailed parametric optimizations (Chapter 14); however, the range of feasible single-pass conversions affects the structure of the separations section. If extremely high single-pass conversions are possible (e.g., greater than ~98%), it may not be economical to separate and recycle the small amounts of unreacted feed materials. In this case, the feed materials become the impurities in the product, up to the allowable concentration.
For gas-phase oxidations, should the reactor feed be outside the explosive limits? For example, there are many reactions that involve the partial oxidation of hydrocarbons (the acrylic acid process in Appendix B and phthalic anhydride production in Appendix C). Air or oxygen is fed to a reactor along with hydrocarbons at high temperature. The potential for explosion from rapid, uncontrolled oxidation (ignition) is possible whenever the mixture is within its explosive limits. (Note that the explosive limits widen significantly with increased temperature.) An inherently safe design would require operation outside these limits. Often, steam is added both as a diluent and to provide thermal ballast for highly exothermic reactions—for example, in the acrylic acid reactor (Figure B.9.1).
12.3 Separator Section
After the reactor section, the separator section should be studied. The composition of the separator feed is that of the reactor effluent, and the goal of the separator section is to produce a product of acceptable purity, a recycle stream of unreacted feed materials, and a stream or streams of by-products. The ideal separator used in the GBFD represents a process target, but it generally represents a process of infinite cost. Therefore, one step is to “de-tune” the separation to a reasonable level. However, before doing that, one must decide what the by-product streams will be. There may be salable by-products, in which case a purity specification must be met so that the by-products can be sold. For many organic chemical plants, one by-product stream is a mixture of combustible gases or liquids that are then used as fuel. There may also be a waste stream (often a dilute aqueous stream) to be treated downstream; however, this is an increasingly less desirable process feature.
Prior to enactment of current environmental regulations, it was generally thought to be less expensive to treat waste streams with so-called end-of-pipe operations. That is, the process was designed to produce, concentrate, and dispose of the waste in an acceptable manner. As regulations evolved, the strategy of pollution prevention or green engineering has led to both better environmental performance and reduced costs. More details are given in Chapter 27, but the overall strategy is to minimize wastes at their source or to turn them into salable products.
The separation section then generally accepts one stream from the pre-separation unit and produces product, by-product, and (sometimes) waste streams. In the development of the PFD, one must consider the most inclusive or flexible topology so that choices can be made in the optimization step. Thus, each type of stream should be included in the base case.
Next, the minimum number of simple separation units must be determined. Although there are single units that produce multiple output streams (such as a petroleum refining pipe still with many side draws), most units accept a single inlet stream and produce two outlet streams. For such simple separators, at least (N - 1) units are needed, where N is the number of outlet streams (products, by-products, and waste). There are two important questions to answer concerning these units in the separation section: (1) What types of units should be used? (2) How should the units be sequenced?
12.3.1 General Guidelines for Choosing Separation Operations
There are general guidelines concerning choice of separation unit. Table 12.1 gives a set of rules for the most common choices of separation units in process simulators.
Table 12.1 Guidelines for Choosing Separation Units
|
For a base case, it is essential that the separation technique chosen be reasonable, but it is not necessary that it be the best.
For sequencing of the separation units, there is another set of guidelines, given in Table 12.2. In the base case, it is often helpful to consider the same type of separator for each unit. During optimization, one can compare different separator types for the different duties. Again, some separators can do multiple separations in one unit, but these can be found during optimization. Additional heuristics for separation unit sequencing are given in Table 11.13 and in reference [9].
Table 12.2 Guidelines for Sequencing Separation Units
|
As with all sets of heuristics, these can be mutually contradictory. However, in the initial topology of the separation section, the main goal is to follow as many of these heuristics as possible.
Beyond these general guidelines, beware of azeotropes and multiple phases in equilibrium, especially when water and organics are present. Special techniques are available to deal with these problems, some of which are discussed later in this chapter. On the other hand, if a single-stage flash will do the separation, do not use a column with reflux.
For the separation section, other important questions to be considered include the following:
What are the product specifications for all products? Product specifications are developed to satisfy customers who will use these products in their own processes. The most common specification is a minimum concentration of the main constituent, such as 99.5 wt%. Maximum impurity levels for specific contaminants may also be specified, as well as requirements for specific physical properties such as color, odor, and specific gravity. A single separation technique may not be sufficient to meet all the required product specifications, as demonstrated in Example 12.1.
In the production of benzene via the hydrodealkylation of toluene, it is necessary to produce a benzene product stream that contains >99.5 wt% benzene that is water white in color (i.e., absolutely clear). If the feed toluene to the process contains a small amount of color, determine a preliminary separation scheme to produce the desired benzene product.
As a guide, look at the toluene hydrodealkylation process shown in Figure 1.5. Because the volatilities of toluene and benzene are significantly different, the main purification step (the separation of benzene from toluene) can be accomplished using distillation, which is consistent with Figure 1.5. However, it has been found that the compound causing the discoloration of the toluene is equally soluble in benzene and toluene, causing the benzene product to be discolored. It is further found by laboratory testing that the benzene product can be decolorized by passing it through a bed of activated carbon. Thus, a second separation step, consisting of an activated carbon adsorber, will be added to the process after the distillation column to decolorize the benzene product.
Are any of the products heat sensitive? If any of the products or by-products are heat sensitive (i.e., they decompose, deactivate, or polymerize at elevated temperatures), the conditions used in the separations section may have to be adjusted, as in Example 12.2.
It is known that acrylic acid starts to polymerize at 90°C when it is in a concentrated form. Acrylic acid must be separated from acetic acid to produce the required purity product, and the volatilities of both acids are significantly different. This points to distillation as the separation method. The normal boiling points of acrylic acid and acetic acid are 140°C and 118°C, respectively. How should the separation be accomplished to avoid degradation of the acrylic acid product?
The distillation column must be run under vacuum to avoid the problem of acrylic acid degradation. The pressure should be set so that the bottom temperature of the column is less than 90°C. From Figure B.9.1 and Table B.9.1, it can be seen that a column pressure of 0.16 bar at the bottom can accomplish the desired separation without exceeding 90°C.
Are any of the products, by-products, or impurities hazardous? Because separation between components is never perfect, small quantities of toxic or hazardous components may be present in product, fuel, or waste streams. Additional purification or subsequent processing of these streams may be required, depending on their end use.
12.3.2 Sequencing of Distillation Columns for Simple Distillation
Because distillation is still the prevalent separation operation in the chemical industry, it will now be discussed in more detail. Simple distillation can be defined as distillation of components without the presence of any thermodynamic anomalies. The most apparent thermodynamic anomaly in distillation systems is an azeotrope. Azeotropic distillation is discussed in the next section. The remainder of this section is for simple distillation.
As stated earlier, as a general guideline, a minimum of N – 1 separators are needed to separate N components, and this guideline also applies to distillation systems. Therefore, one distillation column is required to purify both components from a two-component feed. This is the type of problem most often studied in separation classes. To purify a three-component feed into three “pure” components, two distillation columns are required. However, there are two possible sequences, and these are illustrated in Figure 12.1(a)(b). Ultimately, the choice of sequence depends upon the economics. However, the results of the economic analysis often follow the guidelines in Table 12.2. For example, if the heavy component (C) is water, it should be removed first due to its high heat of vaporization, so the sequence in Figure 12.1(b) is likely to be more economical for such a situation. This is because the heating and cooling duties in the second column are reduced significantly if the water is removed first. The sequence in Figure 12.1(b) is also likely to be a better choice if component C is present in the largest amount, or if component C is the only corrosive component. This is because in the former case, the second column will be smaller, and in the latter case, the second column may not need the expensive materials of construction needed for corrosion protection used in the first column.

It must be understood that more than N - 1 distillation columns are permissible. There are cases that have been reported where the sequence in Figure 12.1(c) is actually more economical than either of the sequences in Figure 12.1(a)(b). This occurs because the sequence in Figure 12.1(c) has lower utility costs that offset the capital cost of the extra column and peripherals [10]. Actually, the sequence represented in Figure 12.1(c) can be accomplished in one column, a partitioned column with a vertical baffle, as illustrated in Figure 12.1(d) [10]. The presence of the vertical baffle makes the column behave like the three columns in Figure 12.1(c). The lesson learned here is that distillation practice can be very different from distillation theory. Textbooks usually state unequivocally that N - 1 distillation columns are required for separation of N components. However, the two examples presented here demonstrate that the minimum number of columns predicted from theory may not be the distillation sequence used in practice.
Other distillation column configurations are possible [11–13]. In these references, there are column configurations known as Petlyuk-type columns. It should be noted that even though the configuration in Figure 12.1(c) looks like a Petlyuk–type II column, it is not, due to the presence of a reboiler and a condenser on the first column, units that are not present in the Petlyuk–type II column.
Figure 12.1(a)(b) shows the two theoretical simple sequences possible for separating three components in simple distillation. As the number of components increases, so does the number of alternative simple sequences. The number of alternative simple sequences, S, for an N-component feed stream is given by [14]
There are other column arrangements possible for simple distillation. Some of these are illustrated in Figure 12.2. Figure 12.2(a) illustrates distillation with a side stream. It must be understood that in a typical distillation column, a side stream does not contain a pure component; it contains a mixture. In certain petroleum refining operations, side streams are common because a mixture is the desired product. Sometimes a side stream is withdrawn because it contains a maximum concentration of a third component—for example, in the purification of argon from air.

Figure 12.2(a) should not be confused with Figure 12.1(d), because the presence of the vertical baffle in the latter makes that column behave differently. Figure 12.2(b) represents a stripping column (sometimes called a reboiled absorber), and Figure 12.2(c) represents a rectifying column. A stripping column is used when the light components are very dilute and when they need not be purified. A rectifying column is used when the heavy components are very dilute and need not be purified. The performance of the stripping and rectifying columns can be understood from their McCabe-Thiele representations, shown in Figure 12.2(d)(e), respectively.
12.3.3 Azeotropic Distillation
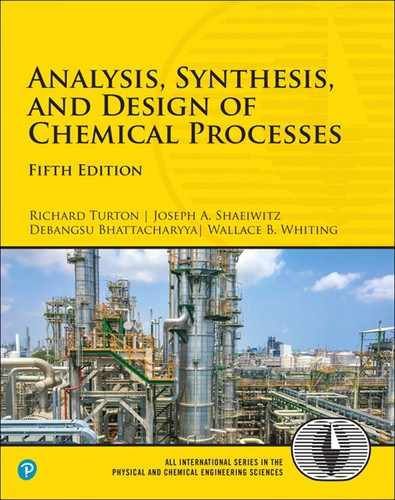
Distillation involving azeotropes does not conform to the guidelines discussed in Section 12.3.2. This is best illustrated by examining the thermodynamic behavior of a binary homogeneous azeotrope, illustrated in Figure 12.3. Clearly, no McCabe-Thiele construction can be made to produce two pure products from the indicated feed. The heavy component can be purified, but an infinite number of stages above the feed would be required just to approach the azeotropic concentration, (xaz, yaz), the point where the equilibrium curve crosses the 45° line. There are minimum- and maximum-boiling azeotropes, although minimum-boiling azeotropes (where the azeotrope is at a lower temperature than either pure-component boiling point) are more common. Minimum-boiling azeotropes arise from repulsive forces between molecules. One way of thinking about azeotropes is that the volatility switches. In Figure 12.3, Component A is more volatile when it is present below the azeotropic composition, but Component B is more volatile when Component A is present above the azeotropic composition. Given that simple distillation exploits the difference in volatility between components, it is easy to understand how the switch in volatility makes simple distillation impossible.
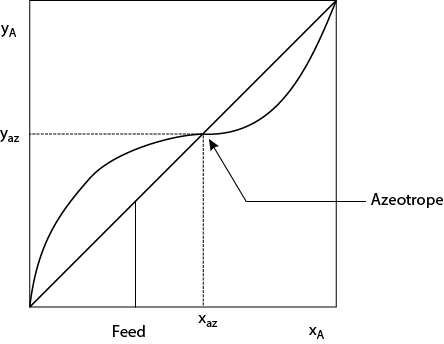
Figure 12.3 X-Y Diagram for Component A Forming a Minimum-Boiling, Binary Azeotrope with Component B (Constant Pressure)
In the next section, methods for accomplishing distillation-based separations in the presence of azeotropes for binary systems are discussed. In the subsequent section, methods for azeotropic distillation involving three components are discussed.
Binary Systems. The methods used to distill beyond azeotropes in binary systems are illustrated using McCabe-Thiele diagrams. Four of the more popular methods are discussed here. A more complete discussion is available in any standard separations textbook [15].
The more popular methods for breaking binary azeotropes include the following:
One distillation column allows separation close to the azeotrope, and then a different separation method is used to complete the purification (Figure 12.4[a]).
If the azeotrope is a binary, heterogeneous azeotrope, that means there is a region where the two components form two mutually immiscible liquid phases (both in equilibrium with the azeotropic vapor composition, which is between the two liquid compositions), and hence a phase separator and a second column are added. The phase separator provides one phase on the other side of the azeotrope from the feed, so that phase can be purified by distillation in a second column (Figure 12.4[b]).
If the azeotrope concentration is pressure sensitive, one column is used to distill close to the azeotrope. One “pure” component is produced from the bottom of this first column. Then the pressure of the distillate is raised so that the azeotropic composition is now below the distillate composition. Then a second column is used to purify the second component. Because the volatility switches as the azeotrope is crossed, the second component is in the bottom stream of the second column (Figure 12.4[c]). This particular sequence assumes that the azeotrope is less concentrated in A at higher pressures.
A third component can be added to change the phase behavior. This method is discussed in the next section.

The first alternative is illustrated in Figure 12.4(a). Here, a distillation column is used that will provide “pure” B in the bottoms and a near-azeotropic mixture in the distillate. The McCabe-Thiele construction for this distillation column is illustrated in Figure 12.5(a). Then a different type of separation is used to purify Component A (not shown on the McCabe-Thiele diagram). The impure stream from the second separator should be recycled, if possible; however, treatment as a waste stream is also possible. The recycle stream will most likely be fed to a different tray from the feed stream, because distillation column feeds should always be near the point in the column with the same concentration as the feed stream.
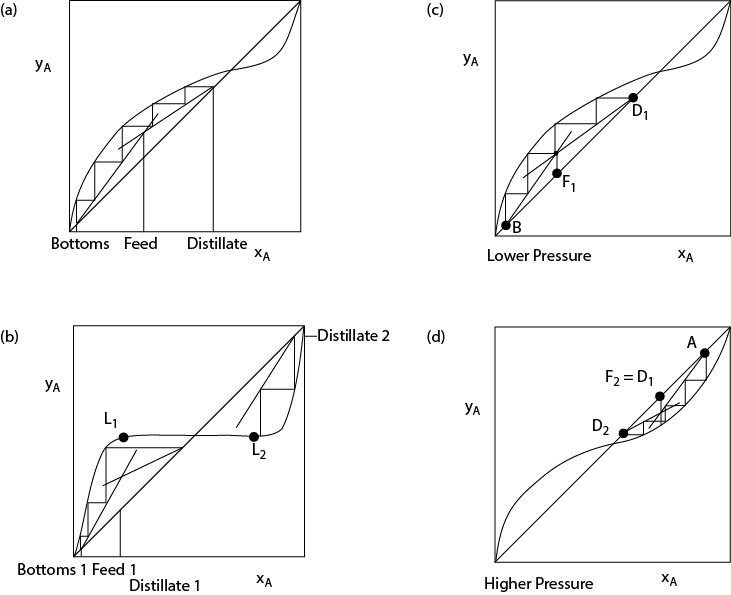
Figure 12.5 McCabe-Thiele Diagrams for Distillation Arrangements in Figure 12.4
An example of this situation is the ethanol-water system, which has a binary azeotrope in the 90–95 mol% ethanol range (depending on system pressure). A relatively recent method for purifying ethanol beyond the azeotropic composition is pervaporation [16]. The following question may arise when considering this method: Why not just use pervaporation (or whatever second separation method is possible) for the entire separation? The answer is that, even with volatile energy prices, the relatively low cost of energy makes distillation a very economical separation method [16]. In most cases, an arrangement like Figure 12.4(a) is far less expensive than using the second separation method alone. This is because separations such as distillation are very economical for producing relatively pure products from roughly equal mixtures. Obtaining ultrapure products from distillation can have unfavorable economics, because large numbers of trays are required for very high purity (think about the McCabe-Thiele construction). Separations like pervaporation (or any membrane separation) have much more favorable economics when removing a dilute component from a relatively pure component. They are also economically unattractive for large processing volumes. Therefore, the combination of distillation and another separation like pervaporation usually provides the economic optimum.
In cases where the two components being distilled form an azeotrope with two immiscible liquid phases, the method illustrated in Figure 12.4(b) can be used to obtain two “pure” components. The McCabe-Thiele diagram is shown in Figure 12.5(b). A characteristic of the equilibrium in this system is the horizontal segment of the equilibrium curve, which is caused by the phase separation into immiscible phases. The equilibrium between the two phases is illustrated by the ends of the horizontal segment of the equilibrium curve marked by L1 and L2. Therefore, in one column, the feed is distilled to near-azeotropic conditions, and “pure” component B is in the bottom stream. The impure distillate is condensed and sent to a phase separator. One immiscible phase is on the other side of the azeotrope, and it is sent to a second column to purify component A in the bottom stream. The impure distillate from the second column is condensed and sent to the phase separator. It is important to understand that this method works only for systems exhibiting this type of azeotropic phase behavior.
If a binary azeotrope is pressure sensitive, the method illustrated in Figure 12.4(c) can be used to produce two “pure” products. The McCabe-Thiele construction is illustrated in Figure 12.5(c)(d). In this illustration, increasing the system pressure lowers the azeotropic composition of A. The McCabe-Thiele construction in Figure 12.5(d) is at a higher pressure than that in Figure 12.5(c). Therefore, for the case illustrated, the feed is distilled in one column to produce “pure” B and a near-azeotropic distillate (D1). This distillate is then pumped to a higher pressure, which lowers the azeotropic composition. At a suitable pressure, the distillate from the first column is now above the azeotropic composition, and a second column is then used to purify A. “Pure” A is the bottoms product of the second column because of the reversal in volatilities caused by the azeotrope. The near-azeotropic distillate (D2) is recycled to the first column.
A related method for pressure-sensitive azeotropes is to run only one column at vacuum conditions. If the equilibrium behavior is favorable, the azeotrope will be at a mole fraction of A approaching unity. Depending on the desired purity of component A, the maximum possible distillate composition may be sufficient.
It is important to remember that pressure-swing methods are applicable only when the azeotropic composition is highly pressure sensitive. Although there are examples of this behavior, it is actually quite rare.
Azeotropes in Ternary Systems. In binary systems, the McCabe-Thiele method provides a conceptual representation of the distillation process. In ternary systems, there is a method that provides a similar conceptual representation. It is called the boundary value design method (BVDM), and it is particularly useful for conceptualizing azeotropic distillation in ternary systems. This method is introduced here; however, the reader seeking a more in-depth treatment of this method and all aspects of azeotropic distillation should consult the definitive reference in the field [17].
In the BVDM, ternary distillation is represented on a right-triangular diagram just as binary distillation is represented on a rectangular plot in the McCabe-Thiele method. Each point on the right-triangular diagram represents the mole fraction of each of the three components on a tray. For example, in Figure 12.6(b), the vertex labeled B is the origin of a rectangular coordinate system. At that point, the mole fractions of A and C are zero, and the mole fraction of B is obtained by subtraction from 1. Hence, the mole fraction of B at the origin is 1. Consider any other point on the diagram, point p, as illustrated. The mole fractions of C and A are obtained using the horizontal and vertical coordinates, respectively, based on B as the origin. The mole fraction of B is obtained by subtraction of the mole fractions of A and C from 1.
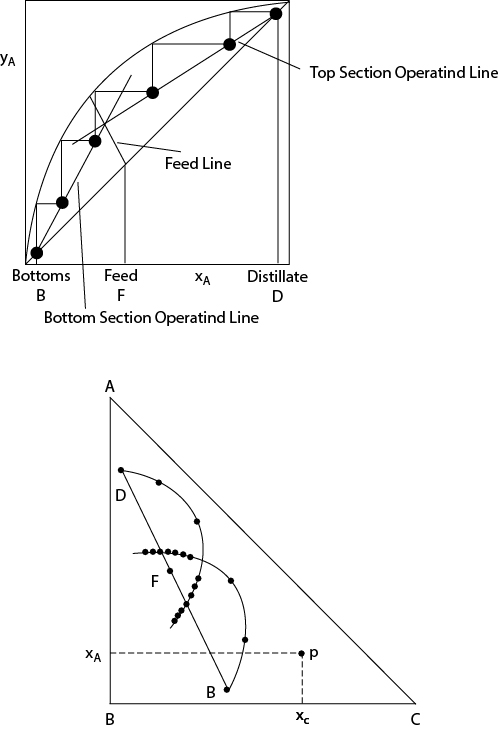
Figure 12.6 Comparison of McCabe-Thiele for Binary Distillation (a) and Triangular Diagram for Ternary Distillation (b)
For a simple ternary distillation process, a curve can be drawn by connecting the compositions on each stage. This is equivalent to the operating line in the McCabe-Thiele method. This is illustrated in Figure 12.6. It is observed that the curves for the rectifying and stripping section intersect. This intersection implies a feasible distillation process, just as intersection of the operating lines for rectifying and stripping implies a feasible binary distillation on the McCabe-Thiele diagram. If the curves do not intersect, then the distillation operation is not feasible.
Each point shown on the curves on the triangular diagram is analogous to the highlighted points on the McCabe-Thiele diagram, where the stepping process intersects the operating lines. In the McCabe-Thiele method, the optimum feed location is determined by the intersection of the operating lines. It is possible to place the feed in a different location; however, the optimum location minimizes the number of stages required. For simple ternary distillation, the feed tray is fixed at the point of intersection of the rectifying and stripping curves on the triangular diagram. To trace the tray-to-tray compositions, one follows a curve for one section and then switches to the curve for the other section at the intersection of the curves. The closely spaced points not in the range of operation are those analogous to the points on a McCabe-Thiele diagram obtained by not switching operating lines in the stepping process and pinching as the equilibrium curve is approached.
It is also observed that the feed point lies on a straight line connecting the distillate and bottoms product concentrations. This is a consequence of the lever rule and is similar to the representation of mixing and separation processes on triangular diagrams in extraction processes [18, 19]. The line connecting points D, F, and B is a representation of the overall material balance on the column. As a consequence of the requirement of the overall material balance, for a column (with only one feed and without side streams) to be feasible, the points D, F, and B must lie on the same straight line.
Instead of using the equilibrium curve, as is done in the McCabe-Thiele diagram, on a triangular diagram, a residue curve is used. A residue curve is a plot of the composition of the liquid residue in a single-stage batch equilibrium still with time at a given pressure (Figure 12.7). In a batch still, as the still pot is heated, the more volatile components are boiled off, and the concentration of the less volatile components increases with time in the still pot. The equation used to calculate the residue curve is the unsteady material balance on the still pot for each component i.
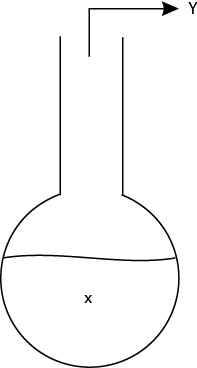
where N is the total moles of liquid in the pot and the form of K depends on the thermodynamics used to represent the phase equilibrium (i.e., Raoult’s Law, equation of state, fugacity, activity-coefficient model, etc.). Most process simulation packages have utilities to perform this calculation, plot the result, and export the data.
Because the more volatile components are being removed with time, the temperature in the still pot increases with time. The residue curves represent this fact with an arrow in the direction of increasing temperature. It is also true that residue curves never cross. Points on the residue curve map are defined as follows:
Stable node: Arrows on all curves point toward this point (highest temperature).
Unstable node: Arrows on all curves point away from this point (lowest temperature).
Saddle point: Arrows point both toward and away from this point (intermediate temperature).
Figure 12.8 shows the residue curve map for a ternary system without azeotropes. Note that the curves seeming to emanate from the A vertex actually represent initial still pot compositions of nearly pure A with an infinitesimal amount of B (the curve on the A-B line), with infinitesimal amounts of both B and C in differing ratios (the interior curves), or with an infinitesimal amount of C (the A-C line). Each point anywhere on the triangular diagram is at a different temperature. Because the diagram represents liquid compositions, the temperature is the bubble point of the mixture at the given pressure. Therefore, the vertices of the triangular diagram are at the boiling points of the pure components. In Figure 12.8, Component A is the most volatile, and Component C is the least volatile. In the discussion that follows, the convention of decreasing volatility for components A-B-C will be followed.

There are many possible representations of azeotropes on triangular diagrams. Four are shown in Figure 12.9. In Figure 12.9(a), there is a binary, minimum-boiling azeotrope between Components A and B. In Figure 12.9(b), there is a binary, minimum-boiling azeotrope between Components B and C that boils above pure Component A. In Figure 12.9(c), there is a binary, minimum-boiling azeotrope between Components A and C that boils below pure Component A. In Figure 12.9(d), there are two binary, minimum-boiling azeotropes. One is between Components A and B that boils below pure Component A, and the other is between Components A and C that also boils below pure Component A.

There are three key rules to using residue curves to conceptualize distillation processes:
Because the temperature increases from top to bottom in a distillation column, the time variable can be replaced with a height variable in Equation (12.2). This is true only for a packed column; however, the equivalence of a certain column height and a tray (HETP, height equivalent to a theoretical plate) makes generalization to tray columns possible.
The residue curve is the composition profile in a continuous, packed distillation column at total reflux.
The BVDM (residue curves on triangular diagrams) is useful only for conceptualization, not numerical calculations, in contrast with the McCabe-Thiele method, which can be used for numerical calculations.
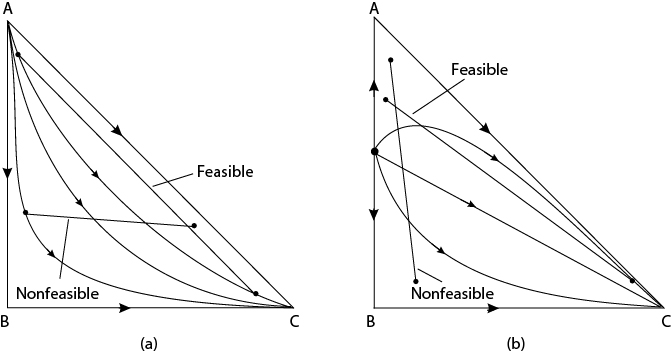
Therefore, to represent a feasible distillation process qualitatively, the second point combined with the material balance criterion illustrated in Figure 12.6 (feed, distillate, and bottoms product must lie on the same straight line) means that there must be a straight line connecting the feed, distillate, and bottoms that intersects the same residue curve, with one end at the distillate and the other end at the bottoms. It must be remembered that there are an infinite number of residue curves on a triangular plot, even though only two or three are actually drawn. Figure 12.10 shows examples of feasible and nonfeasible distillation processes. Figure 12.10(a) is for a system without azeotropes, and Figure 12.10(b) is for a system with a minimum-boiling azeotrope between Components A and B.
In the preceding section, a method for breaking binary azeotropes was mentioned that involved adding a third component to break the azeotrope. A key question is how to pick the added component. One answer is to pick an intermediate-boiling component that does not create a new azeotrope and has a residue curve map without any boundaries like Figure 12.9(c). The distillation column sequence and the representation of the sequence on the boundary value diagram are shown in Figure 12.11. The residue curve map suggests a feasible, intermediate-boiling component to break the azeotrope and also suggests the method for column sequencing and recycles to accomplish the separation. It should be noted that finding an intermediate-boiling component to break an azeotrope can be a difficult task given the narrow boiling point range required. Quite often, high-boiling components are used to break azeotropes. One of the most common examples is the use of ethylene glycol to break the ethanol-water azeotrope. An analysis of this situation is beyond the scope of this discussion. However, it is important to mention that the details of the boundary value design method require that the high-boiling component be added as a separate feed to the column and not be mixed with the process stream feed [17].

On residue curve maps, a boundary is defined as the curve that separates two regions within which simple distillation is possible. In Figure 12.9, plots (b) and (d) have boundaries. A boundary separates two regions with residue curves not having the same starting and ending point. Therefore, plots (a) and (c) have no boundary. No simple distillation process in a single column may cross a straight boundary. Also, if a boundary is straight, the product streams from a multiple-column arrangement may not cross the boundary.
When the boundary is curved, there are more options for separation sequences. This is because the only requirement is that the distillate and bottoms product from a column be in the same region. The feed can lie in a different region. Also, if a boundary is curved, the product streams from a multiple-column arrangement may lie in a region across the boundary. Therefore, a column such as the one illustrated in Figure 12.12 is feasible. Example 12.3 shows how this feature can be exploited.

For the system illustrated in Figure 12.9(b), with a feed mixture of B and C (denoted F), conceptualize a distillation sequence that produces “pure” B and C using a light entrainer, A.
One possible sequence is illustrated in Figure E12.3.
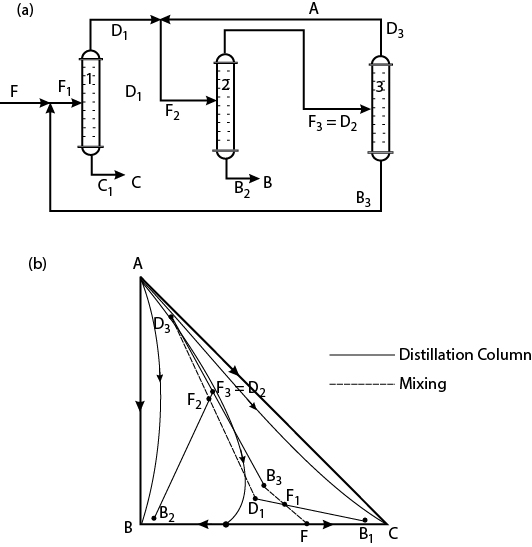
Figure E12.3 Process Configuration and Residue Curve Map for Example 12.3
It is also observed that the distillate D3 is not very pure. This is because of the layout of the residue curves. Therefore, another feature of the residue curves map is that it suggests when concentration of a component is possible and when it is not possible to achieve a high-purity product.
In summary, the BVDM or residue curve plots can be used to conceptualize feasible distillation sequences. It is particularly useful for azeotropic systems involving three components, either when there are three components in the feed or when an entrainer is added to break a binary azeotrope. This method has only been introduced in this section, so care must be taken when applying this method without additional reading. Reference [17] is suggested for further reading.
12.4 Reactor Feed Preparation and Separator Feed Preparation Sections
The purpose of these sections is to match the temperature and pressure desired for the inlet streams to the reactor section and to the separation section. If the reactor operates at high temperature (a common occurrence because this increases reaction rate), the reactor feed preparation and separator feed preparation sections are often combined in a single process-process heat exchanger. Such heat integration can be built into the base-case flowsheet, but, if not, it should be caught during the heat integration step of optimization (see Chapter 15).
Pressure may also need to be increased for the reactor (or, infrequently, decreased), and this requires a pump for liquids or a compressor for gases. When there is a choice, pumps are preferable to compressors, because the operating, capital, and maintenance costs are all lower for pumps. If pressure is reduced between the reactor and the separator sections (or anywhere else in the process), an expander can be considered (for gases), but often it is not economical both because of its high cost and also because it reduces the controllability of the process. A valve allows control at a modest cost, but energy is not recovered.
In these temperature and pressure matching sections, the lowest-cost utility should always be used. For heating the feed to an exothermic reaction, heat integration can be used with the reactor effluent. For low-temperature heating, low-pressure steam or another low-temperature utility is used. For safety reasons, exothermic reactions (when reactor runaway is possible) should be run, with the reactor feed coming in at a temperature high enough to ensure a significant reaction rate. This avoids the buildup of large inventories of unreacted feed materials, which can happen if cold material enters the reactor and quenches the reaction. When sufficient heat is later provided, the entire contents of the reactor could react very rapidly, a process called ignition.
When possible, consider operation between 1 and 10 bar. High pressures increase pumping, compression, and capital costs, whereas low pressures tend to increase the size and cost of vessels. The temperature of the feed to the separation unit (at least for the base case) is usually set between the boiling points of the top and bottoms product for distillation, or based on similar considerations for the other separation options.
12.5 Recycle Section
This section is relatively straightforward. The stream or streams of unreacted raw materials are sent back to the reactor to reduce feed costs, to reduce impurities in the product, or to improve the operation of the process. If the conditions of the recycle streams are close to those of the raw material feed, then the recycle stream should mix with the raw materials prior to the reactor feed preparation section. Otherwise, any heating/cooling or pressure increase/decrease should be done separately. Thus, the recycle stream is combined with the raw material streams when they are all at a similar temperature. Example 12.4 involves a recycle in a biochemical process.
A recycle is used to return enzyme to the reactor. What particular concerns must be addressed in the recycle section?
The enzyme must be protected from deactivation and from degradation by microbes during the recycle, which might include storage times between batches. The recycle must be maintained in aseptic conditions, at the appropriate temperature and pH.
12.6 Environmental Control Section
As stated previously and in Chapter 27, this section should be eliminated or minimized through pollution prevention and green engineering. However, especially if the contaminant has little or no value if concentrated, there will be relatively dilute waste streams generated and sent to the environmental control section. Here, they are concentrated (by the separation techniques discussed earlier) and then disposed of (by incineration, neutralization, oxidation, burial, or other means). The keys are to concentrate the waste and to make it benign.
12.7 Major Process Control Loops
During the initial synthesis of the PFD, the major control loops are developed. These control loops affect more than just one unit of a process. For example, the level control in the condensate tank of a distillation column is necessary for plant operation. On the other hand, a reactor temperature controller that changes the flowrate of molten salt through the cooling tubes of a reactor is a major loop and should be shown on the PFD.
It is through the early development of major control loops that significant design improvements can be made. In the high-temperature exothermic reactor, for example, failure to consider the control loop might lead one to propose an integrated heat-exchanger network that is difficult or impossible to control.
Beyond the importance of the control loops in maintaining steady-state material balance control, assurance of product purity, and safety, they provide focal points for the optimization that will follow the initial PFD synthesis. As described in Chapter 14, the controlled variables are the variables for which there is a choice. The best values of these variables are found through optimization. These loops also provide early clues to the flexibility of the process operation. For example, if the feed to the reactor is cut in half, less heat needs to be removed. Therefore, there must be an increase in the temperature of the cooling medium, which occurs when the coolant flowrate is reduced. Process control may be very difficult but is extremely important in biological processes, as demonstrated in Example 12.5.
In biological waste treatment, microbes that eat the waste and produce benign products are used. In one class of such processes, called activated sludge, the culture is separated from reactor output and recycled. What specfic process control issues arise in such a process?
The culture must maintain sufficient activity throughout the recycle. The recycle conditions may become nutrient poor if nearly all the waste nutrient is consumed, leading to loss of activity. The activity of the culture might be adversely affected by upsets in the feed conditions to the reactor, such as pH extremes or high concentrations of compounds toxic to the culture. Therefore, feed-forward control using measurements of the feed conditions should be considered, as well as control of a reserve of the culture to be used in case an uncontrolled process upset leads to culture death. Immediate, on-line analysis of culture activity is difficult, but off-line measurements can be incorporated into the control scheme.
12.8 Flow Summary Table
The format for the flow summary table is given in Chapter 1. Each of the conditions (temperature, pressure, flowrate, composition, and phase) should be estimated early in the flowsheet development. All are needed to get preliminary costs, for example. Even estimates based on perfect separations can provide sufficient data to estimate the cost of a recycle versus the value of burning the impure, unreacted feed material as a fuel.
Completeness of the estimates, not their accuracy, is important at this stage. For example, an early determination of phase (solid versus liquid versus gas) is needed to help choose a separation scheme or reaction type (see Table 12.1).
12.9 Major Equipment Summary Table
Chapter 1 explains the requirements of a major equipment summary table. In the context of initial PFD development, the process of creating the table forces the process design engineer to question the size (and cost) of various units for which there may well be other options. If, early on, one must specify a large compressor, for example, the process can be changed to a lower pressure or it can be modified to use liquid pumping followed by vaporization rather than vaporization followed by compression. The early consideration of materials of construction provides the clue that normal temperatures and pressures usually result in less expensive materials.
12.10 Summary
The inclusion of enough detail and the freedom to look at the big picture without the burden of excessive detail are the keys to successful PFD synthesis. One must remain fully aware of the broadest goals of the project while looking for early changes in the structure of the flowsheet that can make significant improvements. Particular attention must be paid to the separations and reactor sections. The formation of azeotropes between components to be separated greatly affects the separation sequence. These must be identified early in the synthesis.
The beginning of the process is the generic block flow process diagram. Although the flow summary table at this stage is based on crude assumptions and the equipment summary table is far from the final equipment specifications, they help keep the chemical engineer cognizant of key choices that need to be made.
WHAT YOU SHOULD HAVE LEARNED
To synthesize a process flow diagram from a block flow diagram, the following key information is needed:
Physical property data
Reaction kinetics
The reactor section and the separation section are synthesized first.
The reactor feed preparation section and the separator feed preparation section are synthesized either along with or immediately following their corresponding sections.
If needed, the recycle section is synthesized next.
The final items synthesized are the environmental control section and the major control loops.
References
1. Tables of Chemical Kinetics: Homogeneous Reactions, National Bureau of Standards, Circular 510, 1951; Supplement 1, 1956; Supplement 2, 1960; Supplement 3, 1961. Now available as NIST Chemical Kinetics Database at www.NIST.gov.
2. Kirk, R. E., and D. F. Othmer, Encyclopedia of Chemical Technology, 5th ed. (New York: John Wiley & Sons, 2007).
3. McKetta, J. J., Encyclopedia of Chemical Processes and Design (New York: Marcel Dekker, 1997).
4. Fogler, H. S., Elements of Chemical Reaction Engineering, 5th ed. (Upper Saddle River: Prentice Hall, 2016).
5. Levenspiel, O., Chemical Reaction Engineering, 3rd ed. (New York: John Wiley & Sons, 1999).
6. Viola, J. L., “Estimate Capital Costs via a New, Shortcut Method,” Modern Cost Engineering: Methods and Data, Vol. II, editor J. Matley (New York: McGraw-Hill, 1984), 69 (originally published in Chemical Engineering, April 6, 1981).
7. Cropley, J. B., Union Carbide Technical Center, South Charleston, WV, personal communication, 1995.
8. Poling, B. E., J. M. Prausnitz, and J. C. O’Connell, The Properties of Gases and Liquids, 5th ed. (New York: McGraw-Hill, 2000).
9. Rudd, D. F., G. J. Powers, and J. J. Siirola, Process Synthesis (Englewood Cliffs, NJ: Prentice Hall, 1973).
10. Becker, H., S. Godorr, H. Kreis, and J. Vaughan, “Partitioned Distillation Columns—Why, When and How,” Chem. Eng. 108, no. 1 (2001): 68–74.
11. Petlyuk, F., V. M. Platonov, and D. M. Slavinskii, “Thermodynamically Optimal Method for Separating Multicomponent Mixtures,” Int. Chem. Eng. 5 (1965): 555–561.
12. Kaibel, G., “Distillation Columns with Vertical Partitions,” Chem. Engr. Technol. 10 (1987): 92–98.
13. Agrawal, R., and T. Fidkowski, “More Optimal Arrangements of Fully Thermally Coupled Distillation Columns,” AIChE J. 44 (1998): 2565–2568.
14. Seider, W. D., J. D. Seader, D. R. Lewin, and S. Widagdo, Product and Process Design Principles: Synthesis, Analysis, and Evaluation, 3rd ed. (New York: John Wiley & Sons, 2009).
15. Wankat, P., Separation Process Engineering, 4th ed. (Upper Saddle River: Prentice Hall, 2017), ch. 8.
16. Humphrey, J. L., and G. E. Keller II, Separation Process Technology (New York: McGraw-Hill, 1997), 99–101, 271–275.
17. Doherty, M. F., and M. F. Malone, Conceptual Design of Distillation Systems (New York: McGraw-Hill, 2001).
18. Wankat, P., Separation Process Engineering, 4th ed. (Upper Saddle River: Prentice Hall, 2017), ch. 13.
19. Felder, R. M., Rousseau, R.W., and L.G. Bullard, Elementary Principles of Chemical Processes, 4th ed. (New York: John Wiley & Sons, 2016), ch. 6.
General Reference
Stichlmair, J. G., and J. R. Fair, Distillation: Principles and Practice (New York: Wiley-VCH, 1998).
Problems
1. Choose one of the cases from Appendix B. Identify
All required physical property data
Sources for all data needed but not provided
2. Search the patent literature for kinetics information for one of the processes in Appendix B. Convert the provided data to a form suitable for use on a process simulator.
3. Develop five heuristics for reactor design.
4. For design of an exothermic reactor with cooling, one needs to choose an approach temperature (the nominal temperature difference between the reaction zone and the cooling medium). One engineer claims that the temperature difference across the tube walls should be as small as possible. Another claims that a large temperature difference is better for heat transfer.
Describe the advantages and disadvantages of these two choices from the point of view of capital costs.
Describe the advantages and disadvantages of these two choices from the point of view of operating costs.
Describe the advantages and disadvantages of these two choices from the point of view of operability of the process.
5. Are there any safety considerations in the choice of heat transfer driving force (ΔT) in Problem 12.4? Explain.
6. From the flowsheets in Appendices B and C, identify four examples of each of the following types of recycles described in this chapter:
Recycles that reduce feed costs
Recycles that reduce impurities in products
7. Recycles are also used for the following purposes. Identify four examples of each.
Heat removal
Flowrate control
Improvement of separation
Reduction of utility requirements
8. From your previous courses and experience, identify four process recycle streams that serve different purposes from those identified in Problem 12.7(a) through (d).
9. What information is needed about the available utilities before a choice between them can be made for a specific heating duty?
10. Take a flowsheet for one of the processes in Appendix B and identify the reactor feed preparation, reactor, separator feed preparation, separator, recycle, and environmental control sections. Is there any ambiguity concerning the demarcation of these sections? Explain.
11. How many simple distillation columns are required to purify a stream containing four components into four “pure” products? Sketch all possible sequences.
12. How many simple distillation columns are required to purify a stream containing five components into five “pure” products? Sketch all possible sequences.
13. Illustrate a system (PFD and McCabe-Thiele diagrams) to purify two components (A and B) from a binary, homogeneous, minimum-boiling azeotrope that is pressure sensitive. The feed concentration of A is greater than the azeotropic composition at the pressure of the column receiving the feed. The azeotropic composition of A decreases with increasing pressure.
14. In the production of dimethyl carbonate from methanol, it is necessary to separate methanol from formal (also known as methylal—C3H8O2). However, an azeotrope exists between these two components. Using a process simulator, examine the equilibrium curves (x-y plots) between 100 kPa and 1000 kPa to determine a strategy for purifying these two components. Compare your results for the following thermodynamic packages for the K-value:
Ideal
NRTL
UNIFAC
SRK
What do you learn from this comparison?
15. In the production of diethyl ether, it is necessary to purify a stream of equimolar diethyl ether and water that is available at 1500 kPa. Suggest a method for achieving this separation. Use the UNIQUAC model for the K-value. Would your answer be different if, for example, only 99 mol% purity were needed instead of 99.9 mol%? What do you learn and how does your answer change if the four models for K-values in Problem 12.14 are used? What do you learn from this comparison?
16. In the production of diethyl ether, assume that it is necessary to purify a stream at 1500 kPa containing 75 mol% diethyl ether, 20 mol% ethanol, and 5 mol% dimethyl ether. Assume that the UNIQUAC model adequately predicts the thermodynamics of this system.
Use the residue curve plotting routine on your simulator to plot the residue curves.
Suggest a method for separating this mixture into three relatively pure components.
How would your answer to Part (b) change if the stream contained 85 mol% diethyl ether, 10 mol% ethanol, and 5 mol% dimethyl ether?
Examine the effect of changing the pressure of the distillation columns. Suggest a much simpler method for achieving the necessary separation.
17. When your parents or grandparents were in college, it was not uncommon to “borrow” some “pure” ethanol (grain alcohol) from the university to add to a party punch. However, because of the azeotrope between ethanol and water, “pure” ethanol is not easy to manufacture. At that time, it was not uncommon for benzene to be added as an entrainer to break the azeotrope. Of course, this means that all “pure” ethanol contained trace amounts of benzene, which was later identified as a carcinogen. By plotting both residue curves and TPxy diagrams for the ethanol-water system, suggest a method for purifying ethanol by adding benzene as an entrainer. Assume that the UNIQUAC model applies and that the feed stream of ethanol and water is equimolar and at atmospheric pressure.
18. Does Equation (12.1) give the number of alternative sequences for separation processes other than distillation? If so, give two examples. If not, why not?
19. What constraints on the separation process and on the sequence are assumed in the derivation of Equation (12.1)?
20. Figure 12.1(d) shows a nonsimple separation unit. When one says that the minimum number of simple separation units is (N – 1), these nonsimple units are not considered. Identify four other examples of nonsimple separation units. For each, discuss how it might affect
Capital cost
Operability and safety
Operating costs
21. Does Equation (12.1) apply to batch or semibatch separation processes? Why or why not?
22. The residue curve map of Figure 12.9(a) shows that batch distillation of a mixture at the azeotropic composition for the system (A + B) with a small amount of C added will result in a very pure liquid C residue in the still. Is this a good separation unit choice to obtain “pure” C? Analyze the advantages and disadvantages.
23. On a residue curve map, will the composition of a ternary, minimum-boiling azeotrope always be a stable node, an unstable node, a saddle point, or none of the above?
24. As noted in Section 12.1.1, laboratory studies often involve batch or semi-batch reactors for convenience. Develop four heuristics for choosing whether to use batch, semibatch, or continuous reactors for the commercial plant.
25. Semibatch or batch reactors are common in biochemical operations. What characteristics of biological systems, materials, and products lead to the choice of batch over continuous reactors? To what extent do these characteristics also lead to unsteady operations of other GBFD sections?
Reactor feed preparation
Separator feed preparation
Separator
Recycle
Environmental control
26. The unique characteristics of an azeotrope make it ideal for some applications. Find three applications of azeotropic products. How is the production of an azeotropic composition different from the production of “pure” A and B when (A + B) forms an azeotrope? Does the process differ for a minimum-boiling and a maximum-boiling azeotrope?
27. For biological systems (which often have a very narrow range of acceptable temperatures), describe the advantages and disadvantages of large and small DT ′s in reactor temperature control systems.
28. Biological systems often require sterilization as a step before inoculation with the appropriate microbial culture. Sterilization can be considered a reaction process in which organisms are killed, often through cell lysis, using thermal or chemical routes. Consider both batch and continuous sterilization. Which has advantages for sterilizing process equipment? Which has advantages for sterilizing reactor feedstock? (Note: For some biochemical processes, sterilization is neither required nor desired, e.g., waste treatment.)