Chapter 22: Reactors
WHAT YOU WILL LEARN
The important roles of reaction kinetics, equilibrium, and heat transfer in determining the correct design for chemical reactors
The hierarchy of configurations for removing heat from exothermic, gas-phase catalytic reactions
That exothermic, gas-phase reactions may give rise to temperature hot spots in the reactor that can lead to dangerous conditions
That the performance of existing reactors is complex and requires numerical solutions when temperature effects are taken into account
As for other chapters in this section of the book, the intention of this chapter is not to replace a textbook on a specific topic, reaction engineering in this case, but rather to highlight some basic equations relating to chemical reactor design and then to investigate specific issues relating to equipment design and the performance of such equipment. For many industrially relevant reactions, there is a significant enthalpy change between the reactants and products, and this gives rise to the need to transfer energy (heat) to or from the reaction zone. Moreover, the forms of the reaction kinetics are most often dependent on an inverse exponential of absolute temperature (Arrhenius form). Therefore, most reactions are not isothermal, and the kinetics are strong functions of temperature, which leads to nonlinear behavior that cannot easily be formulated and solved by analytical methods. For many real, industrial processes, sophisticated models must be developed to predict the performance of the reactor accurately. However, in this chapter, only the basic equations are presented and some simple examples (with analytical solutions) are solved. Following this approach, some case studies are covered that investigate more complex situations. Where appropriate, the reader is referred to additional references that cover more complex analyses.
22.1 Basic Relationships
22.1.1 Kinetics
Consider a basic chemical reaction of the form
where a, b, r, and s are the stoichiometric coefficients for the reaction.
The reaction rate for species i (A, B, R, or S), ri, is defined as
The reaction rate is an intensive property. This means that the reaction rate depends only on state variables such as temperature, concentration, and pressure and not on the total mass of material present.
For solid catalyzed reactions, the reaction rate is often defined on the basis of the mass of catalyst present, W:
where ρb is the bulk catalyst density (mass catalyst/volume reactor). The density of solid catalyst is defined as ρcat (mass catalyst particle/volume catalyst particle). So the bulk density of the catalyst, ρb, is defined as
where ε is the void fraction in the reactor, and hence (1 – ε) is ratio of the volume of catalyst to the volume of the reactor.
If a reaction comprises an elementary step, the kinetic expression can be obtained directly from the reaction stoichiometry. For example, in Equation (22.1), if the first reaction occurs via an elementary step, the rate expression is
For catalytic reactions, the rate expressions are often more complicated, because the balanced equation is not an elementary step. Instead, the rate expression can be obtained by an understanding of the details of the reaction mechanism. The resulting rate expressions are often of the form
Equation (22.6) describes a form of Langmuir-Hinshelwood (L-H) kinetics. The constants (k1 and Kj) in Equation (22.6) are catalyst-specific. All the constants in Equation (22.6) must normally be obtained by fitting reaction data.
In heterogeneous catalytic reacting systems, reactions take place on the surface of the catalyst. Most of this surface area is internal to the catalyst pellet or particle. The series of resistances that can govern the rate of catalytic chemical reaction are as follows:
Mass film diffusion of reactant from bulk fluid to external surface of catalyst
Mass diffusion of reactant from pore mouth to internal surface of catalyst
Adsorption of reactant on catalyst surface
Chemical reaction on catalyst surface
Desorption of product from catalyst surface
Mass diffusion of product from internal surface of catalyst to pore mouth
Mass diffusion from pore mouth to bulk fluid
Each step offers a resistance to chemical reaction. Reactors often operate in a region where only one or two resistances control the rate. For a good catalyst, the intrinsic rates are so high that internal diffusion resistances are usually controlling. This topic is discussed in more detail in Section 22.1.3.
The temperature dependence of the rate constants in Equations (22.5) and (22.6) is given by the Arrhenius equation:
where ko is called the pre-exponential factor, and E is the activation energy (units of energy/mol, always positive). Equation (22.7) reflects the significant temperature dependence of the reaction rate. For gas-phase reactions, the concentrations can be expressed or estimated from the ideal gas law, so ci = pi/RT. This is the origin of the pressure dependence of gas-phase reactions. As pressure increases, so does concentration, and so does the reaction rate. The temperature dependence of the Arrhenius equation usually dominates the opposite temperature effect, that is, a decrease in the concentration.
For a simple first-order reaction, determine the relative change in reaction rate due to a change in temperature from 320°C to 350°C for the following reactions. Assume for Parts (a) and (b) that the concentration is unaffected by temperature.
Elementary first-order reaction rate with an activation energy = 20 kJ/mol
Elementary first-order reaction rate with an activation energy = 80 kJ/mol
By how much would the answer change to Parts (a) and (b) if the effect of a change in temperature on concentration was taken into account?
Solution
Use the ratios of the rates from Equations (22.5) and (22.7), and use subscript 1 to represent the base case at 320°2 and subscript 2 to represent the new case at 350°a. After cancelling terms, the following expression is found:
Assuming the ideal gas law,
Therefore, for Parts (a) and (b),
Thus, the effect of temperature on the rate constant is significantly greater than the effect on concentration. Note that when the activation energy is high, a small change in temperature can have a dramatic effect on the rate of reaction.
22.1.2 Equilibrium
Thermodynamics provides limits on the conversion obtainable from a chemical reaction. For an equilibrium reaction, the equilibrium conversion may not be exceeded. The limitations placed on conversion by thermodynamic equilibrium are best illustrated by Example 22.2.
Methanol can be produced from synthesis gas (syngas) by the following reaction:
For the case when no inerts are present and for a stoichiometric feed, the equilibrium expression has been determined to be
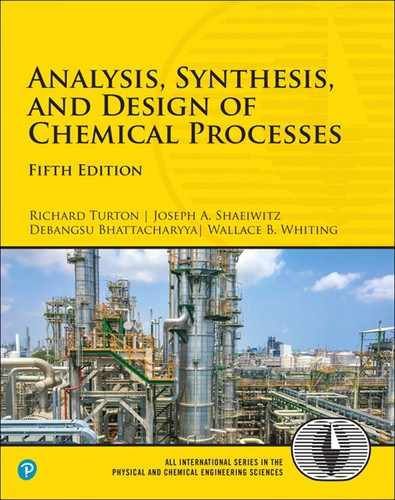
where X is the equilibrium conversion, P is the pressure in atmospheres, and T is the temperature in Kelvin. Construct a plot of equilibrium conversion versus temperature for four different pressures: 15 atm, 30 atm, 50 atm, and 100 atm. Interpret the significance of the results.
Solution
The plot is shown on Figure E22.2. By following any of the four curves from low to high temperature, it is observed that the equilibrium conversion decreases with increasing temperature at constant pressure. This is a consequence of Le Chatelier’s principle, because the methanol formation reaction is exothermic. By following a vertical line from low to high pressure, it is observed that the equilibrium conversion increases with increasing pressure at constant temperature. This is also a consequence of Le Chatelier’s principle. Because there are fewer moles on the right-hand side of the reaction, increased conversion is favored at high pressures.
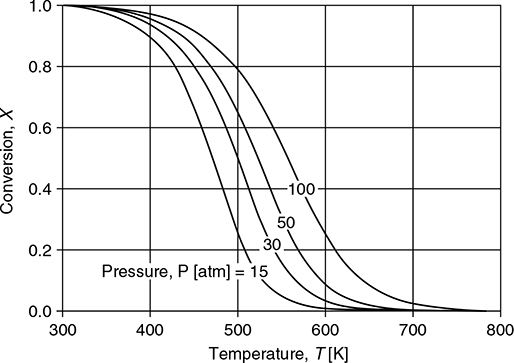
Figure E22.2 Temperature and Pressure Dependence of Conversion for Methanol from Syngas
From thermodynamic considerations alone, it appears that this reaction should be run at low temperatures in order to achieve maximum conversion. However, as shown in Example 22.1, the rate of reaction is a strong function of temperature. Therefore, this reaction is usually run at higher temperatures, with low single-pass conversion, in order to take advantage of the faster kinetics. As will be discussed in Section 22.1.4, despite a low single-pass conversion in the reactor, a large overall conversion is still achievable by recycling unused reactants.
22.1.3 Additional Mass Transfer Effects
Up to this point, only the reaction kinetics and the limiting thermodynamics of equilibrium have been considered. These phenomena are often sufficient for quantifying simple, homogeneous reacting systems. However, for heterogeneous systems such as those involving a fluid and catalyst particle, additional effects such as heat and mass transfer within the catalyst may be important. Unlike simple mass transfer, these resistances act both in series and parallel and cannot be combined simply. Figure 22.1 illustrates the processes involved. In order for a reaction to occur, reactant (component A) must first diffuse through an external gas film to reach the catalyst particle’s surface. Once at the surface, A reacts but also continues to diffuse into the porous particle and simultaneously reacts inside the particle.
22.1.3.1 No Resistance to External Mass Transfer
First, consider the case when the resistance to external mass transfer is small, and the concentration of gas at the particle’s surface is the same as in the bulk, cAs = cA0. For a first-order reaction with no change in the number of moles, the reaction rate is expressed in terms of the rate at the surface multiplied by an effectiveness factor, η. The derivation of the catalyst effectiveness is similar to the fin effectiveness for heat transfer that was covered in Chapter 20.
where the triple prime (¢¢¢)signifies a quantity based on a unit volume of catalyst, and
where ε is the voidage of the catalyst bed defined as the volume of the void spaces between the particles divided by the total volume of gas and particles, and the effectiveness factor is given by
where
The term MT is the Thiele modulus, which is a ratio of the rate of surface reaction to the rate at which reactant diffuses through the catalyst; L is the characteristic length of the catalyst particle (L = Dp/6 for a sphere and L = Dp/4 for a cylinder); and Dcat is the effective diffusion coefficient within the porous catalyst particle that takes account of the pore structure in the catalyst (tortuosity) and the contributions of both Fickian and Knudsen diffusion.
The expression in Equation (22.10) is strictly correct for flat-plate geometry but works very well for cylinders and spheres if the appropriate characteristic length, L, is used. Equation (22.10) is plotted in Figure 22.2.

From Figure 22.2, when the value of MT is < 0.4, the catalyst effectiveness factor is 1, and the interior of the particle is bathed in gas with the same concentration as at the surface, cAs. For this region, the resistance to pore diffusion is negligible. For values of MT > 4.0, the concentration of gas within the porous catalyst drops rapidly from the surface concentration. For this condition, there is strong pore resistance, and the effectiveness factor is essentially equal to the inverse of the Thiele modulus. In the intermediate regime, the effect of pore diffusion resistance increases with increasing MT. Expressions for the Thiele modulus for reaction kinetics different from simple first order can be found in the common texts on reaction engineering.
22.1.3.2 Including External Resistance to Mass Transfer
To account for mass transfer effects, an external mass transfer coefficient, km, must be introduced, thus
where NA is the flux of reactant A transported from the bulk to the surface of the catalyst. NA can be related to the reaction rate in Equation (22.8) as follows:
where a is the ratio of the volume of catalyst to the external surface area or L, the characteristic length.
Equating the terms in Equation (22.13) in terms of concentration gives
where Ω is the overall effectiveness including internal and external mass transfer,
For the case when the surface reaction is so fast that the external mass transfer resistance becomes limiting (km << k), the second term in the denominator becomes very large compared to 1. Combination with Equation (22.11), then, yields
For this condition, the concentration of reactant A at the surface of the particle cAs → 0, and the effective reaction rate is given by
For more complex reaction kinetics such as Langmuir-Hinshelwood, analytical solutions for the overall effectiveness are not available. However, in practice, over quite a wide range of operating conditions, it is usually possible to approximate the reaction kinetics by a first-order process, and the development given here can be applied over that range of conditions.
22.1.3.3 Temperature Effects
For highly exothermic reactions, significant temperature variations may occur within the catalyst particle and across the external gas film surrounding the particle. In extreme cases, the particles may be much hotter in the center than the surrounding gas, causing catalyst sintering and rapid catalyst decay. The analysis of such systems is not covered here, but the interested reader is referred to Levenspiel [1] for a practical method of determining the temperature effects in catalyst systems.
22.1.3.4 Choosing a Catalyst
In practice, it does not make sense to operate far to the right of Figure 22.2 (large MT), because so much of the internal catalyst surface area is unavailable for reaction. For very active catalysts where k''' is very high, it does makes sense to reduce the size of the catalyst particle in order to reduce the value of MT or to dilute the active material within the particle, that is, reduce the loading of active material. Small catalyst particles also tend to be isothermal with little external mass transfer resistance. However, at some point, the pressure drop through a packed bed of small particles becomes excessive and, unless fluidized bed operation can be used, this sets a practical limit to the catalyst particle size.
Consider the reaction of methanol to dimethyl ether (DME) via the gas-phase catalytic reaction using an amorphous alumina catalyst treated with 10.2% silica.
There are no significant side reactions at temperatures less than 400°C, and the equilibrium conversion at these temperatures is greater than 99%. At temperatures greater than 250°C, the rate equation is given by Bondiera and Naccache [2] as
where is the rate of reaction of methanol in mol/m3 catalyst/s, ko = 3.475 × 10⁶ m3 reactor/m3 catalyst/s, E = 84.06 kJ/mol, and cMeOH = concentration of methanol in mol/m3 reactor. A typical feed to a packed bed reactor is 98% methanol at a pressure of approximately 14 atm. This reaction is exothermic and the temperature is expected to rise from 250°C to 350°C across the reactor bed with an expected conversion of methanol across the reactor of 80%.
For this system, determine if there are any pore diffusion effects at the
Reactor inlet
Reactor outlet
For Part (b) determine the overall effectiveness including external mass transfer, and comment on the influence of external mass transfer to the overall reaction rate.
The internal diffusion coefficient for the porous catalyst is estimated to be 8 × 10⁻⁸ m2/s, and the minimum catalyst particle size to avoid excessive pressure drop is estimated to be 3 mm diameter spheres. The mass transfer coefficient for methanol at 350°C and 14 atm pressure for this size of catalyst is approximately km = 2.41 × 10⁻³ m/s.
Solution
At the reactor inlet, the temperature is 250°C = 523.2 K, and
From Equation (22.11), the Thiele modulus is
and
So approximately 1.4% of the total surface area in the catalyst is not “used” because of the reduction in reactant concentration due to diffusion, and therefore, pore diffusion resistance is negligible at the front end of the reactor.
At the reactor outlet, the temperature is 350°C = 623.2 K, and
From Equation (22.11), the Thiele modulus is
and
This location in the reactor is in the intermediate pore diffusion resistance region.
At the reactor outlet, compare the overall catalyst effectiveness Ω to the internal effectiveness η using Equation (22.15):
From this result, it can be seen that the overall effectiveness decreases by only 4.7% (from 0.765 to 0.729); therefore, external mass transfer does not play an important role at these conditions.
22.1.4 Mass Balances
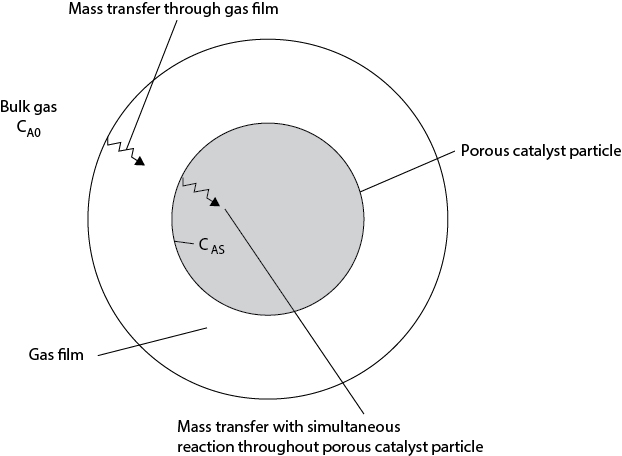
Consider a stream (F0 [mole/s]) containing several chemical species i (1 → n) entering a control volume (CV) of volume V [m3]. The conditions within the control volume are such that some of the species j will react to form products. In order to keep the formulation simple, it is assumed that the products are a subset of 1 → n. In general, the rate at which a given species is created may be expressed by a reaction rate per unit volume as ri [mole/s/m3]. The stream leaving the control volume (F [mole/s]) will have a different composition than the stream entering because some species will have reacted, and if the system is not operating at steady state, then the total number of moles within the control volume (N) will change with time. The situation described here is shown in Figure 22.3. Writing a material balance for species i gives the following relationship:
In words, Equation (22.18) means input of component i + reaction of component i − output of component i = accumulation of component i. So, this is nothing more than a straightforward material balance. The integral term on the left-hand side takes account of the changing conditions within the control volume. It should be noted that if multiple input and output streams existed, then Equation (22.18) should be expanded to include all the input and output streams. The overall mole balance would then be given by Equation (22.19).
At this point, it is convenient to introduce some terms that are commonly used to describe the behavior of reactors. In general, there is more than one reaction taking place in any reactor, and only a subset of those reactions produce the desired product. The other reactions produce undesired products (that have no value or that have to be removed at a cost) or by-products (products with some value that may be sold).
If the process does not involve separation and recycle of unused reactants, then these two measures of conversion are identical. However, in the majority of cases, recycle of unused reactant does take place, and this leads to higher values for overall conversion than for single-pass conversion.
The yield is a measure of how effectively the limiting reactant is converted to the desired product. The yield is affected by the selectivity, defined as follows:
It should be noted that the yield has an upper bound of 1, but selectivity is unbounded. In optimizing chemical processes with an economic objective function, the economics of separating and recycling reactants plays an important role. Therefore, in real processes, the optimal configuration for a reactor is rarely (never) one that maximizes any of the four parameters discussed previously. However, high values of the parameters defined in Equations (22.21–22.23) are usually desirable.
22.1.5 Energy Balances
In a similar way to the derivation of Equation (22.19), the general formulation for the energy balance for a reacting flow system can be written as
where is the rate of heat input into the CV, is the rate of shaft work done by the CV on the surroundings, h is the specific molar enthalpy of the stream, and U is the internal energy of the control volume. In most cases, the work term is negligible, but if a stirrer is required to mix reactants, then this work would be included in the energy balance. In Equation (22.24), work is defined as negative when done on the system. For steady-state operations, the right-hand side of Equation (22.24) (and Equations [22.18] and [22.19]) is zero. The enthalpy terms in Equation (22.24) are usually broken up into terms that contain the heat of reaction and the change in enthalpy of a stream due to reaction. To illustrate this concept, the reaction given in Equation (22.1) is used:
One additional parameter is defined as
Using the stoichiometry and the definition of Θi given in Equation (22.25), the molar flows of each chemical species may be related to the conversion of A, X, as
where νi is the stoichiometric coefficient for reactant i using a basis of unity for reactant A.
For the four species in the reaction, the following relationships hold:
By substituting these relationships into Equation (22.24) and simplifying, the following relationship for steady-state operations with all reactants entering the reactor at the same temperature may be derived [3]:
where is the molar specific heat capacity of species i, T0 is the inlet temperature, T is the outlet temperature, TR is a reference temperature, and ΔHR is the heat of reaction evaluated at the reference temperature (TR). In the first form of Equation (22.27), the heat of reaction is specified at some reference temperature (often 25°C). In the second form of Equation (22.27), the reference temperature (TR) is taken as the outlet temperature (T) of the reactor, and a more compact version of the energy balance is obtained.
22.1.6 Reactor Models
In order to determine the size (usually volume of reactor or mass of catalyst) required for a certain amount of material to react to produce a specified amount of product, certain assumptions must be made about the way material flows through the reactor. When there is more than one phase present (heterogeneous systems), the flow patterns for each phase may be very complicated and simple models are often not accurate. Even for the case of a single phase (homogeneous systems), only idealized flow patterns give rise to analytical solutions. However, despite these limitations, it is still useful to review the idealized flow models for reactors, because they often represent limiting conditions for reactor behavior.
22.1.6.1 Continuous Stirred Tank Reactors
A continuous stirred tank reactor (CSTR) refers to a system in which the fluid (almost always liquid or a mixture of liquid and gas or solid) is mixed so well that there are no concentration differences (gradients) anywhere in the vessel. A CSTR is illustrated in Figure 22.4(a). Because the contents of the reactor are well mixed, it is also assumed that the temperature is constant everywhere and thus the system is isothermal. Therefore, the outlet is identical to the conditions in the reactor. By analogy, since the concentration and temperature everywhere in the reactor are the same, the rate of reaction is the same everywhere in the reactor. Using these assumptions, for a single-input and single-output reactor, operating at steady state, Equation (22.18) gives

where the reaction rate is evaluated at the conditions (concentration) in the reactor, which for a stirred tank are identical to the exit conditions. For reactant A in terms of conversion, Equation (22.28) can be written as
Equation (22.29) is the design equation for a CSTR.
22.1.6.2 Plug Flow Reactor (PFR)
In a plug flow reactor (PFR), all the fluid is assumed to move in plug or piston flow. Therefore, the velocity profile is flat, and each element of fluid stays in the reactor for the same amount of time. This situation is close to that of a single fluid flowing in a pipe under fully-developed turbulent conditions, where the velocity profile is relatively flat across the cross-section of the pipe. A PFR is illustrated in Figure 22.4(b). The concentration of reactants (and products) changes along the length of the reactor, and for steady-state operation, Equation (22.18) gives
The differential form of Equation (22.30) for reactant A is
This leads to the design equation for plug flow reactors as
Equation (22.32) is the design equation for a PFR. Integration of this equation requires knowledge of both the temperature and concentration dependence of the rate expression. For isothermal systems with simple rate laws, analytical expressions are available. However, for nonisothermal reactors, integration of Equation (22.32) must be performed simultaneously with the appropriate energy balances and, in general, this requires the numerical solution of coupled ordinary (or partial) differential equations.
Consider a simple liquid phase reaction in which reactant A is converted to product B. The reaction is second order in A and the kinetics are given by the equation
A stream of material A of concentration 10 mol/L is fed to an isothermal reactor at a rate of 8 L/s. Determine the volume of the reactor to obtain 95% conversion of A assuming
A CSTR is used
A PFR is used
Solution
For a CSTR, use Equation (22.29) and note that the concentration in the CSTR is the same as at the outlet conditions ⇒
For a PFR, use Equation (22.32):
This result shows that the PFR requires significantly less volume (1/20) than the CSTR to achieve the same conversion. This result is true for all reactions of an elementary form. This result should not be surprising either, since in the CSTR, the reaction rate everywhere in the reactor is evaluated at the exit concentration of A. However, in the PFR, the concentration everywhere in the reactor is greater than at the exit condition, and hence the reaction rate is also greater than at the exit concentration.
22.1.6.3 Batch Reactor
As the name implies, a batch reactor operation consists of loading reactants into a reactor, allowing them to react for a period of time t, and then removing the unused reactants and products. The design equation for a batch reactor may be derived from Equation (22.18), under the assumption that the conditions in the reactor are the same everywhere at any given point in time. This implies that the reaction rate, ri, is a function of time but not a function of position. Therefore, for reactant A,
When there is negligible volume change in the reacting mixture, V is constant, and Equation (22.33) may be rewritten in terms of concentrations:
Either Equation (22.33) or Equation (22.34) may be considered the design relationship for a batch reactor. The independent variable is the time spent in the reactor, while the volume dictates how much material is charged to the reactor in a given batch. It should be noted that the batch reactor is an unsteady-state operation, unlike the CSTR and PFR discussed previously.
A mixture of 5 moles of reactant A are introduced into a batch reactor by dissolving them in 100 L of solvent. The reaction of A to product B occurs by a first-order reaction of the form
Determine the time required to react 90% of A to give B. You may assume that there is no change in density of the reaction mixture during the reaction process.
Solution
cA0 = 5/100 = 0.05 mol/L
Conversion = 0.9
Using Equation (22.34),
The time for reaction is ~64 minutes.
22.1.6.4 Other Reactor Models (Laminar Flow)
The PFR and CSTR models represent two idealized flow patterns within reactors. In reality, reactors often have flow patterns that are somewhere between these two models. However, in some cases, especially in heterogeneous systems such as fluidized beds and slurry reactors, the flow patterns of the fluids are very complex and lie outside the bounds provided by these two ideal cases. Needless to say for these complex flow patterns, complex modeling techniques and experimental verification are required to obtain the size of the reactor.
An example of a reactor model that is more complex than either a CSTR or a PFR, but for which analytical solutions exist, is the laminar flow reactor, which is illustrated in Figure 22.5.
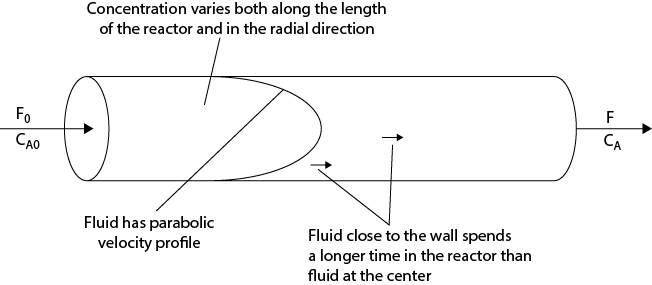
As the name suggests, the flow of liquid in the reactor (usually a long pipe) is in the laminar flow regime, meaning that the velocity profile is parabolic. If the flow regime was turbulent, then a PFR would probably be a good representation of the reactor, since the velocity profile for turbulent flow is quite flat. However, with a parabolic flow profile, elements of fluid at the center of the reactor move at twice the average velocity, and those elements close to the wall move much slower than the average. Thus, there is a wide distribution of times that fluid elements spend in the reactor, so the amount of conversion that each of these elements achieves differs widely. The formulation for the conversion of reactant A in such a reactor requires a knowledge of the residence time distribution (RTD) in the reactor, which is outside the scope of this text, but the interested reader is referred to Levenspiel [4] and Fogler [3] for fuller coverage of this and a variety of other topics in reactor design. The conversion within a laminar flow reactor is simply stated here without proof and is given by
where E(t) is the RTD of fluid elements in the vessel or reactor, is the average time spent in the reactor, and the first term in the integral is the expression for the ratio of the concentration in a batch reactor to the initial concentration after time t. For laminar flow, E(t) is given by
The lower bound of /2 for the integral in Equation (22.35) is needed because the centerline velocity for laminar flow is twice the average velocity, so the least amount of time a fluid element can stay in the reactor is /2. For known kinetics and a given reactor size V, = V / F,(cA/cA0) are known, and Equation (22.35) may be solved to find the conversion X. In effect, Equation (22.35) is the design equation for a laminar flow reactor, but to find the reactor volume V (equivalent to finding ) requires an iterative solution.
Using the results from Example 22.4, Part (b), determine the conversion in the reactor if the flow pattern is laminar and not plug flow.
Solution
From Equation (22.34) for a batch reactor,
From Equation (22.35),
After integration and simplification, this gives
For this problem,
Substituting in Equation (E22.6) gives
This conversion is a little less than that for a PFR with the same volume (X = 0.95). The main reason is that some of the fluid elements pass through the reactor in a time less than the average time, and these elements have a lower conversion than those elements that spend more time in the reactor. The net result is that when the conversion is averaged, a lower overall conversion compared to plug flow is obtained.
Another important practical reactor configuration is the fluidized bed that is often used for highly exothermic reactions because of its favorable, near isothermal, operation. The flow patterns in this type of reactor are very complex and difficult to characterize. Fluidized bed reactors are covered separately in Section 22.2.3.
22.1.6.5 Selectivity and Yield for Parallel and Series Reactions
Consider the following general reaction scheme:
Equation (22.37) shows three reactions involving five species A, B, P, U, and V, with stoichiometric coefficients a, b, p, u, β, and v, respectively. It is assumed that P is the desired product and that U and V are unwanted by-products. The reaction scheme in Equation (22.37) can be used to illustrate the effects commonly observed in many industrial reaction systems.
A single reaction produces a desired product. Here, k2 = k3 = 0, and only the first reaction proceeds. An example is the catalytic dealkylation of toluene to benzene, where the catalyst suppresses the side reactions:
Parallel (competing) reactions produce desired products and unwanted by-products. Here k2 = 0, and no U is formed. Species B reacts to form either P or V. In the phthalic anhydride reaction sequence, the reaction of o-xylene to form either phthalic anhydride, maleic anhydride, or combustion products is an example of a parallel reaction (R-1, R-2, and R-3).
Series (sequential) reactions produce desired products and unwanted by-products. Here k3 = 0, and no V is formed. Species A reacts to form desired product P, which further reacts to form unwanted by-product U. In the phthalic anhydride reaction sequence, shown previously, the reaction of o-xylene to phthalic anhydride to combustion products (R-1 and R-4) is an example of a series reaction.
Series and parallel reactions produce desired products and unwanted by-products. Here, all three reactions in Equation (22.37) occur to form desired product P and unwanted by-products U and V. The entire phthalic anhydride sequence (R-1 through R-5) is an example of series and parallel reactions.
Consider the reaction scheme given in Equation (22.37) where P is the desired product, with both U and V as undesired by-products. Here it is assumed that the reactions occur in the gas phase. Assume that Equation (22.37) represents elementary steps, that a = b = p = u = v = 1, that β = 2, and that the activation energies for the reactions are as follows: E1 > E2 > E3.
For the case where k2 = 0, what conditions maximize the selectivity for P?
For the case where k3 = 0, what conditions maximize the selectivity for P?
Solution
For this case, from Equation (22.23), the selectivity, S, is written as
There are several ways to maximize the selectivity. Increasing cA/cB increases the selectivity. This means that excess A is needed and that B is the limiting reactant. Many reactions are operated with one reactant in excess. The reason is usually to improve selectivity, as shown here. Because, for gas-phase reactions, pressure affects all concentrations equally, it is seen for this case that pressure does not affect the selectivity. Temperature has its most significant effect on the rate constant. Because the activation energy for reaction 1 is larger than that for reaction 3, k1 is more strongly affected by temperature changes than is k3. Therefore, increasing the temperature increases the selectivity. In summary, higher temperatures and excess A maximize the selectivity for P.
For this case, the selectivity is written as
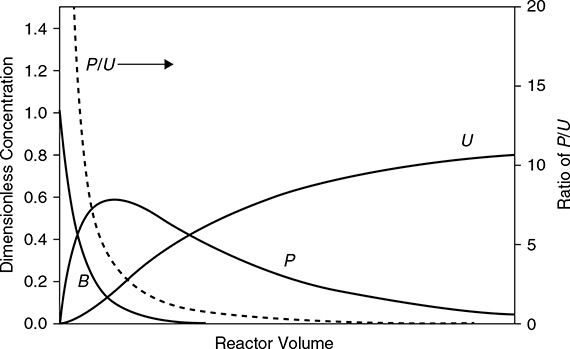
Because the concentration and hence pressure appears to the second power in the numerator and to the first power in the denominator, increasing the pressure increases the selectivity. Because the activation energy for reaction 1 is larger than for reaction 2, increasing the temperature increases the selectivity. Increasing both reactant concentrations increases the selectivity, but increasing the concentration of Component P decreases the selectivity. The question is how the concentration of Component P can be kept to a minimum. The answer is to run the reactions at low conversion (small reactor volumes for a given feed rate). Quantitatively, the selectivity in Equation (E22.7b) is maximized by running at conditions where the concentration of P is very low. Thus, for a series reaction with the desired product intermediate in the series, a low conversion maximizes the intermediate product and minimizes the undesired product. This is illustrated by the concentration profiles obtained by assuming that these reactions take place in a PFR, as shown in Figure E22.7. It is seen that the ratio of P/U is at a maximum at low reactor volumes, which corresponds to low conversion. Therefore, increasing the temperature or the pressure or both increases the selectivity for Component P. Running at low conversion probably does more to increase the selectivity than can be accomplished by manipulating temperature and pressure alone. However, there is a trade-off between selectivity and overall profitability, because low conversion per pass means very large recycles, more difficult separations, and larger equipment.
22.2 Equipment Design for Nonisothermal Conditions
In the previous section, design equations were introduced that allow the calculation of the volume needed for a few ideal reactor types. In practice, the assumption of isothermal behavior is often not valid and more rigorous sizing calculations need to be carried out. In this section, some of the basics of real reactor behavior are covered, and the approaches needed to perform preliminary sizing estimates are described.
22.2.1 Nonisothermal Continuous Stirred Tank Reactor
The design of a CSTR for an exothermic reaction may require the removal of heat from the reactor through an internal or external heat exchanger. For most practical situations, CSTRs are only used for liquid-phase reactions, and the discussion here focuses on these types of reactions. When the heat of reaction is small or when there is a difference between the feed temperature and the reaction temperature, adiabatic operation may be possible. This is true, in part, because the mass of the inventory in the reactor is usually quite high, and a significant amount of cooling can be absorbed in sensible heat by heating the contents from the inlet temperature to the reaction temperature. However, as reaction temperatures increase, so do the reaction rates, and this may lead to excessive temperatures when operating adiabatically, so such conditions require some form of additional heat transfer or cooling.
Some configurations for heat removal in CSTRs are shown in Figure 22.6. The use of an external heating loop, Figure 22.6(a), allows easier maintenance of heat transfer equipment and gives more precise control of reactor temperature, as both the circulation rate and coolant rate may be used as control variables. However, the use of cooling coils within the CSTR (Figure 22.6[b]) is also a viable method. When the temperature of the reactor is high enough, partial vaporization of the reactor contents and their subsequent condensation and recycle provides another means of cooling (Figure 22.6[c]), which can be modeled in an identical way as for the case shown in Figure 22.6(a).
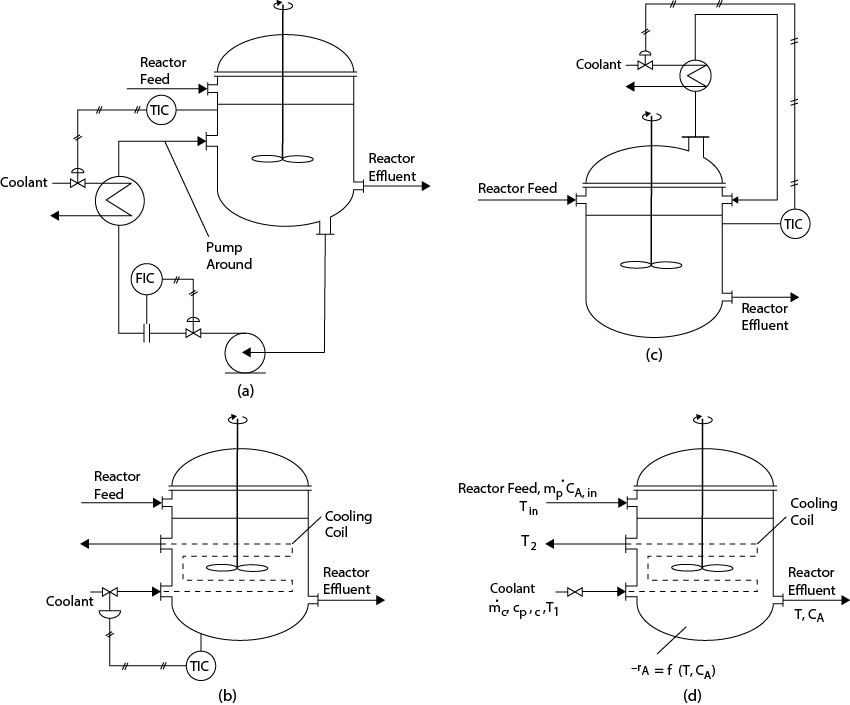
Figure 22.6 Configurations for Heat Removal from CSTRs: (a) Pump Around with External Heat Exchange, (b) Internal Cooling Coils, (c) Partial Vaporization and Subsequent Condensation of Reactor Contents in an External Heat Exchanger; (d) Notation for Configuration (b) Used in Model Development
The equations describing the situations in Figure 22.6 are different depending on which configuration is modeled. Only the equations describing Figure 22.6(b) are given here. Note that the well-mixed assumptions mean that both the temperature and concentration in the reactor are the same as at the exit conditions.
An energy balance on the reactor gives
where the subscripts c and p refer to coolant and process streams, respectively. In words, Equation (22.40) reads, Energy removed by coolant = Energy generated in reactor − Energy required to heat feed. Notation for this case is shown in Figure 22.6(d).
In Equation (22.40), the left-hand side is simply the heat removed by the coolant in changing temperature as it passes through the coils in the reactor. The right-hand side represents the energy produced by the reaction (−ΔHr is evaluated at the reactor outlet temperature, T) minus the energy needed to heat the contents from the feed temperature to the reactor temperature. Since, in general, the feed enters the reactor at a lower temperature than the reactor (outlet) temperature, the two terms on the right-hand side are of opposite sign. The condition for adiabatic operation is then also described by Equation (22.40) with the left-hand side set to zero. For the case of heat removal, the heat exchanger design equation must also be solved in conjunction with the energy balance. This requires the following to be true:
For a given reactor volume, heat exchanger area, process throughput, process stream inlet temperature, and coolant flowrate and inlet temperature, the only unknowns are the reactor temperature and coolant outlet temperature, and these can be solved using Equations (22.40) and (22.41).
For the case when the coolant flow is very high or when the coolant undergoes a phase change (boils), then the coolant temperatures into and out of the reactor are essentially the same, that is, T1 ≅ T2 = Tc. Then, Equations (22.40) and (22.41) may be combined to give the following:
where QC represents the term on the left-hand side of Equation (22.42) and is the heat removed by the cooling medium and QR is the net energy produced in the reactor. The value of QR is a strong function of conversion, which is a strong function of the reactor temperature. Therefore, as the reactor temperature increases, QR slowly increases and then rapidly rises as the conversion starts to “take off” and then slows down as the conversion approaches 100%. The T-Q diagram for the reactor, shown in Figure 22.7, shows the relationships for QC and QR as a function of temperature, and the point(s) of intersection of the two curves represents a mathematical solution(s) to Equation (22.42).
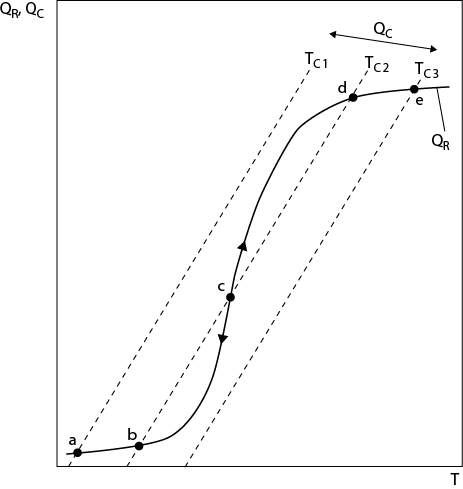
Figure 22.7 Graphical Solution of Equation (22.42)
From Figure 22.7, it is clear that for low coolant temperatures (TC1), there is only a single low-temperature solution (Point a) to Equation (22.42). As the coolant temperature is increased (to TC2), there are three solutions (Points b, c, and d) to Equation (22.42). However, the intermediate-temperature solution (Point c) is unstable. Therefore, if the reactor were designed to operate at Point c, it would be impossible to control the temperature, because any positive deviation in temperature would drive the solution to Point d because the energy balance for the reactor lies above the energy balance for the coolant, and any negative deviation would drive the solution to Point b using a similar reasoning. However, both solutions b and d are stable and can be controlled. For still higher coolant temperatures (TC3), a single high-temperature solution (Point e) is found. Therefore, it is important not to design the reactor to maintain an intermediate temperature.
An exothermic, liquid-phase reaction is to take place in a stirred tank reactor. The feed to the reactor (F) is pure A at 500 mol/min with a concentration of 10 mol/L. The volume of the reactor is 100 L, and the feed temperature is 30°C. A reaction takes place in which A is converted to B (A ® B) by a first-order reaction:
The heat of reaction (−ΔHr) is 75,240 J/mol, and it is approximately constant from 30°C to 200°C. Other data for the process and coolant are as follows:
Data:
For this system, calculate the following:
If the reactor is to be run adiabatically (no coolant), at what temperature and conversion will the reactor run?
If it is desired to obtain 80% conversion, at what temperature must the reaction run?
For the case in Part (b), what must be the flow of coolant fed to the cooling coil in the reactor?
What heat transfer area is required for Part (c)?
Solution
Using Equation (22.40) and setting the left-hand side of the equation to 0, the following expression must be solved for the unknown variable T:
The integrated form for the design equation for a stirred tank reactor can be written in terms of the space time,
where
and
Substituting Equations (E22.8c) and (E22.8d) into the right-hand side of Equation (E22.8a) along with the other parameters gives
Simplifying gives
where T is in °C. Solving Equation (E22.8f) gives
For 80% conversion,
At T = 93.5°C, the right-hand side of Equation (22.40) is 2.711 × 10⁵ W. An energy balance on the cooling medium gives
For the design of the heat transfer surface,
The performance aspects of the reactor in Example 22.8 are considered in Section 22.3.2.
22.2.2 Nonisothermal Plug Flow Reactor
22.2.2.1 Hierarchy for Exothermic Reactions
The design of a reactor for a set of exothermic reactions must include consideration of the extent of reaction and the amount of heat generated. For reactions with low to moderate heats of reaction, the reactor may be designed without the need to add heat transfer surfaces within the reactor. Such configurations are inherently simpler, less expensive, and easier to operate. As the heat generated by the reactions increases, some form of internal heat transfer must be included in the reactor design. Since most industrially relevant reactions include the need for a catalyst and often these reactions are performed in the gas phase, the emphasis given here is on heterogeneous gas-phase reactions. A diagram illustrating the hierarchy of reactor design for increasingly exothermic reactions is shown in Figure 22.8. It should be noted that the direction of gas flow is always downward through a packed bed to avoid the possibility of unwanted fluidization. For fluidized beds, the direction of gas flow is always upward.
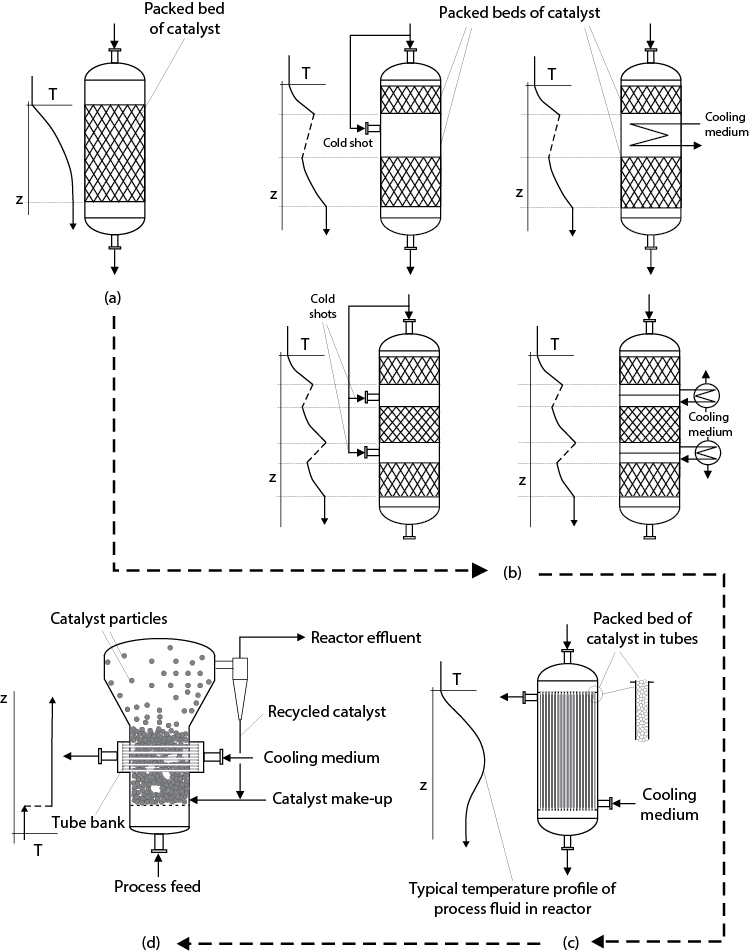
Figure 22.8 Reactor Configurations for Increasingly Exothermic Reactions (Shown by the Direction of the Dotted Line): (a) Single Packed Bed, (b) Multiple Packed Beds with Intermediate Cooling or the Additions of Cold Shots, (c) Shell-and-Tube Arrangements, and (d) Fluidized Beds
In Figure 22.8(a), the reactions of interest are only slightly exothermic, and a simple packed bed of catalyst is used. The gas temperature increases across the bed of catalyst, and this increase should be relatively small (≤50°C), which limits the amount of conversion within a single reactor. For higher conversions or more exothermic reactions, a series of packed beds with either intermediate cooling or the addition of supplemental cool feed material (cold shots) can be used, as shown in Figure 22.8(b). In practice, not more than three or four packed beds in series are normally used. In Figure 22.8(b), internal and external intermediate cooling coils are shown. These coils or heat exchangers serve the same function of cooling the gas prior to its being fed to the next catalyst bed. This differs from the type of heat exchange that is required in Figure 22.8(c)(d), where heat must be removed at the same location at which reactions are taking place. Therefore, for more exothermic reactions, the use of some form of integrated heat exchanger is employed, as shown in Figure 22.8(c). A common configuration for highly exothermic catalyzed reactions is to load the catalyst into tubes through which the process gas flows. The heat generated by the reactions is then transferred out of the catalyst, through the reacting process gas and the walls of the tube, and into a cooling medium on the shell side of the reactor. The cooling medium may be a liquid such as Dowtherm™, a molten salt, or boiler feed water that is turned into steam. The temperature profiles along the length of the tube (and possibly across the tube diameter) are not linear and are discussed in more detail in the following section.
For extremely exothermic reactions, such as the partial combustion of certain hydrocarbons (e.g., the production of acrylic acid, maleic anhydride, and phthalic anhydride), the control of the temperature within the tubes of a shell-and-tube type reactor becomes difficult or leads to excessively large reactor volumes due to the need for significant dilution of the catalyst. For such cases, the use of a fluidized bed with internal heat removal may be required. Fluidized beds are usually more complicated than other forms of reactors, they need a solids handling and recycle system, and they often require the continuous make up of catalyst. They are generally more expensive than other reactor types, but they are capable of near isothermal operation and provide very stable operating conditions for highly exothermic reactions. The behavior and fluid flow patterns within a fluidized bed depend on the ratio of the superficial velocity to the minimum fluidizing velocity (us/umf) and the density and size of the particles being fluidized. The modes of operation of these reactors depend on the value of the preceding parameters and, for increasing gas flowrate, vary between bubbling bed, turbulent bed, fast fluidization, and transport reactor. An example of a bubbling fluidized bed with heat removal is shown in Figure 22.8(d). It should be noted that the solids act like a well-stirred tank and remain at a constant temperature. The inlet gas stream is usually cooler than the reactor temperature but undergoes a very rapid temperature change when entering the bed and essentially passes through the bed at isothermal conditions. However, it should be noted that the flow pattern for the gas is generally not plug flow, and for the case shown in Figure 22.8(d), gas bubbles are formed that do not contact the catalyst efficiently. Therefore, the flow pattern of gas is quite complex and not well described by a simple flow model. Thus, models for fluidized beds are complex and often require experimental verification to determine all the parameters needed in the model. Usually the choice of a fluidized bed is a necessity because of extremely high heats of reaction that require very good temperature control and may often require the use of very small catalyst particles or catalyst that must be regenerated often. For such cases, the pressure drop in a packed bed and the heat transfer surface area requirements would be prohibitively high. Fluidized beds are covered in more detail in Section 22.2.3.
22.2.2.2 Hierarchy for Endothermic Reactions
The same configurations shown in Figure 22.8 can be used for endothermic reactions. If the reaction(s) is very endothermic, for example, the catalytic reformation of naphtha or the dehydrogenation of ethylbenzene to form styrene, then as the reaction proceeds, the temperature drops, the rate decreases, and the reaction may quench out. In such cases, some form of heat transfer (heat transferred to the reactant stream from a hot source) may be required. The normal configurations for endothermic reactions are shown in Figure 22.8(a)(b). If heat addition is required to prevent the quenching of the reactions or to reduce the size of the reactor then the normal approach is to use a series of staged packed beds with intermediate heating. “Hot shots” to the feed of sequential packed beds may also be used but is less common. The degree of endothermicity of commercial reactions is generally less than the exothermicity for partial oxidation reactions, and as a result, the configurations shown in Figure 22.8(c)(d) are not usually employed for endothermic reactions.
22.2.2.3 Understanding Reactor Concentration and Temperature Profiles
In Figure 22.8(a)(b), the exothermicity of the reactions taking place is generally low enough that a given catalyst particle may be assumed to be isothermal. This means that there are no radial temperature gradients within a catalyst particle and that temperature gradients across the diameter of the reactor are small. Thus, it is justified to model such reactors using a simple one-dimensional model in which temperature and concentration vary only in the z-direction, that is, along the length of the reactor. These are the models that process simulators typically employ in their standard libraries. For more sophisticated (higher-dimensional models), custom written operations are usually needed. For more exothermic reactions, such as shown in Figure 22.8(c), these assumptions must be carefully reevaluated and checked. When reactions are extremely exothermic, radial temperature variations within the catalyst pellet and within the tube carrying the catalyst are possible. A typical situation for a single catalyst tube in a shell-and-tube type reactor is shown in Figure 22.9.

Figure 22.9 How Temperature Variations May Occur within Catalyst-Filled Tube and Catalyst Pellet for Highly Exothermic Reactions
From the illustration in Figure 22.9, it should be clear that temperature and composition may vary with both the location within the catalyst pellet and with the location of the pellet in the tube. Clearly, a simple one-dimensional model is incapable of determining these radial variations and modeling these types of reactors accurately; therefore, some form of coupled set of partial differential equations (for both material and energy balances) will be required.
The potential complexities of temperature and concentration profiles in the tubes of a shell-and-tube reactor were identified in the previous discussion. In many cases, it is possible to minimize these radial variations and reduce the analysis to one in which temperature and concentration variations need to be considered for only the z-direction. The discussion of these reactors starts with a qualitative consideration of the profiles that are shown in Figure 22.10.

Figure 22.10 Temperature and Concentration Profiles in a Shell-and-Tube Reactor for Increasing Heat of Reaction
In Figure 22.10, the direction of the cooling medium is shown to be countercurrent to the flow of process gas in the tubes. This does not have to be the case, and cocurrent arrangements may be advantageous in some circumstances, especially when a hot spot needs to be reduced at the entrance to a reactor by using a large temperature driving force. Also shown (as a dotted line) is an alternative curve for the cooling medium that actually crosses over the temperature curve for the reacting process fluid. Such behavior is obviously impossible in simple recuperating heat exchangers, discussed in Chapter 20. However, unlike the simple heat exchangers covered previously, heat is generated within the process fluid because of the chemical reactions that take place. Therefore, it is possible for the cooling medium to be heated above the temperature of the process fluid at a certain location in the reactor. This situation does not have to occur and is usually undesirable for controlling the reactor, but it does not violate any physical laws if it does take place.
Returning to the temperature profiles in Figure 22.10(b), as fluid enters the reactor, it is exposed to catalyst in the tubes and starts to react. Simultaneously, heat is transferred from the process gas, through the tube wall into the cooling medium. Therefore, there are two opposing terms in the energy balance: generation through chemical reaction and heat exchange to the coolant. At the entrance of the reactor, the concentration of reactants is high and the heat generated by the chemical reaction is higher than the transfer of heat to the coolant. As a result, the process gas heats up. Because the rate constant is a strong function of temperature, the increase in reaction rate due to the increase in temperature is relatively large and causes the process gas temperature to increase as it flows down through the tubes. Considering Curve B in Figures 22.10(b)(c), initially the reaction rate and temperature increase quickly. Therefore, the concentration of reactant A decreases quickly, and this decrease opposes the increase in reaction rate due to the increasing temperature. Simultaneously, the temperature driving force for heat transfer between the process gas and the cooling medium increases. Therefore, as the gas moves down the tube, at some point the rate of heat generation by the reaction is exactly equal to the rate of heat removal through the tube wall. At this point, a maximum temperature is seen in the tube (often called the hot spot). As the process gas moves further down the tube, the rate of heat transfer to the cooling medium is greater than the rate of heat generation due to chemical reaction, and the gas decreases in temperature. Since reaction is still taking place, the concentration continues to decrease until the gas leaves the reactor. Curves C, D, and E represent cases in which the heat of reaction is smaller than for Curve B. For these cases, the same description of the processes telling how the gas temperature and concentration profiles change along the length of the reactor applies, except that the magnitude of the hot spot temperature decreases and its location shifts further down the reactor.
Consider now the case given in Curve A, for which the heat of reaction is greater than for Curve B. The same initial processes as described for Curve B still take place, but now the rate of heat generation due to the chemical reactions is too great for the cooling medium to counterbalance the temperature increase. Therefore, the temperature continues to increase rapidly, and a condition is reached at which the reactions “run away,” that is, the temperature increases unbounded. This is a condition that must be avoided at all costs, because material failure within the reactor may very well occur, and some form of catastrophic event (explosion or vessel rupture) may happen. In addition, the catalyst will undergo sintering, the active material comprising the catalyst may evaporate or will certainly agglomerate, and virtually all catalytic activity will be destroyed.
The sequence of curves shown in Figures 22.10(b)(c) is labeled to show the effect of increasing heat of reaction (from E to A), but the same set of curves could be obtained in other ways. For example, a change in cooling medium flow, a change in inlet temperature for the cooling medium, or a change in process gas inlet temperature could all cause similar effects. In the next section, the equations describing these types of reactors and the importance of the heat transfer process are discussed.
22.2.2.4 The Role of Heat Transfer in Reactor Design
From the preceding section, it should be clear that, for shell-and-tube reactors, the role of heat transfer is critically important. It was also pointed out that, in general, radial temperature profiles within the catalyst pellets and also in the tubes holding the catalyst pellets will exist. However, Levenspiel [1] points out that for commercial heterogeneous (gas-solid) catalyzed reactions, temperature variations within the catalyst pellet are usually not significant. Froment, Bischoff, and De Wilde [5] note that radial temperature variations within the catalyst tubes may be present for some commercial reactions. In such cases, a two-dimensional model of the reactor is required to capture correctly the heat transfer and reaction processes, but this level of analysis is not covered here, and interested readers are referred to Froment et al. [5] for a detailed discussion on the different approaches to modeling packed bed reactors with and without heat exchange.
In the discussion given here, a one-dimensional approach to solving the equations for packed beds with heat exchange is covered. In the one-dimensional approach, it is assumed that temperature and concentration are only functions of the axial position in the reactor and that radial variations within the tubes and between tubes at the same axial position do not exist. With these assumptions, it is only necessary to consider the processes occurring in a single packed tube of catalyst, shown in Figure 22.11.
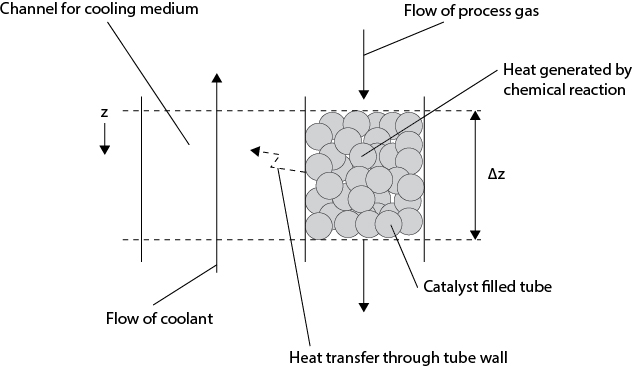
Figure 22.11 shows a slice of the reactor tube and accompanying cooling medium. Heat is generated in the catalyst filled tube due to reaction, and some of this heat is removed by the cooling medium (shown flowing countercurrently to the process gas flow) by heat transfer through the wall of the tube. The amount of heat transferred through the tube wall is a function of the temperature difference between the process gas and the coolant at the same axial location in the reactor. This transfer of heat will, in general, not equal the amount of heat generated in the tube; therefore, the gas leaving the slice of the bed will not be equal to the temperature entering. The following assumptions are made to simplify the analysis:
The overall heat transfer coefficient between the tube wall and cooling medium, U, is constant over the length of the reactor.
The heat capacities for process gas and coolant do not change appreciably over the length of the tubes.
The heat of reaction does not change appreciably over the length of the tubes.
The equations describing these processes for a reaction involving species A are
The terms in Equation (22.43) are explained by the following word equation:
Energy flowing in with the process gas + Energy generated by chemical reaction = Energy flowing out with process gas + Energy transferred to cooling medium through the tube wall
Simplifying terms, dividing by Δz, and taking the limit, the following differential equation is obtained:
where the subscripts p and c refer to the process gas and coolant, respectively, the term G is the superficial mass velocity, that is, , and the rate is given per unit volume of catalyst. The process mass flowrate in the above relationship for Gp is the mass flow per tube and not the total mass flow rate of the process gas. In order to integrate Equation (22.44), an expression for the rate of reaction of Component A must be known and, in addition, a mole balance on A is required to keep track of the composition and/or partial pressure of A as the gas moves down the tube.
A mole balance on A is as follows:
To obtain the concentration of A or the partial pressure, an overall mole balance based on the stoichiometry of the reaction is required and the ideal gas law (or another appropriate equation of state). Therefore,
where X = 1 − FA/FA0 and
Cooling Medium
An energy balance on the cooling medium gives
Simplifying terms, dividing by Δz, and taking the limit, the following differential equation is obtained:
For cocurrent flow of the cooling medium and process gas, a negative sign would be added to the term on the left-hand side of Equation (22.49).
Pressure of Process Gas
From Chapter 19, the pressure drop for the process gas flowing through the packed bed of catalyst in the tubes is given by the differential form of the Ergun equation:
The set of equations ([22.44–22.47], [22.49], and [22.50]) must be solved simultaneously to obtain the concentration and temperature profiles in a shell-and-tube reactor. For the case illustrated in Figure 22.11, the set of equations is a split boundary problem, because the conditions of the entering process gas are known at z = 0, but the inlet conditions for the cooling medium are known at the end of the reactor at z = L. For cocurrent flow of the cooling medium and the process gas, the conditions of both streams are known at the beginning of the reactor, which makes the solution more straightforward.
Overall Heat Transfer Coefficient
The overall heat transfer coefficient U used in Equations (22.44) and (22.49) can be calculated in the same way described in Chapter 20. However, for the heat transfer from a gas flowing inside a catalyst packed bed, no correlation was given in Chapter 20. In all cases, the limiting heat transfer coefficient will be on the tube side of the reactor, since the shell-side heat transfer coefficients are expected to be one to two orders of magnitude greater than the tube-side coefficient for a liquid cooling medium, the resistance of the metal tube wall will be small, and fouling should also be small. A large body of work is available in the literature on effective tube-wall heat transfer coefficients for gas flowing in packed beds. The majority of this work has been for air at ambient conditions. According to Li and Finlayson [6], the following heat transfer correlations may be used for particle-air systems:
Spherical Catalyst Particles (diameter = Dp) in Tubes (diameter = Dtube):
Cylindrical Catalyst Particles (diameter = Dp) in Tubes (diameter = Dtube):
where Re is the particle Reynolds number, .
The preceding correlations are insensitive to the material properties of the solid particles, and in practice, this has been shown to be an oversimplification. A more comprehensive and complicated approach is given by Dixon and Cresswell [7]. They define an effective radial thermal conductivity in the bed that is a function of both the properties of the solid and the gas and the gas flowrate, and then they define a wall Biot number that correlates with the particle Reynolds number. In addition, an overview of heat and mass transfer processes in packed beds is given by Wakao and Kaguei [8]. The interested reader is referred to these works for more details on this subject. For the sake of simplicity, Equations (22.51) and (22.52) are used in this text to calculate the overall heat transfer coefficient for shell- and catalyst-packed-tube reactors.
Example 22.9 illustrates the use of the equations developed in this section to solve a shell-and-tube reactor problem.
The synthesis of phthalic anhydride from o-xylene is considered. The following parameters and pseudo-first-order reaction rate may be used for an approximate preliminary design of a shell-and-tube reactor.
The autoignition temperature of o-xylene = 465°C and lower explosion limit (LEL) = 0.9% at room temperature.
Data (taken from Froment et al. [5]):
Tube length, L > 1 m; Dtube = 0.0254 m; catalyst is V2O5 on promoted silica gel; diameter of catalyst particle, Dp = 3 mm; catalyst bulk density, ρbulk = 1300 kg/m3; bed voidage, ε is 0.45; the acceptable operating range for the catalyst is 335°C to 415°C; and reactor pressure ~ 1 atm. A typical gas mass velocity in the tubes, Gg, is 4680 kg/m2/h (1.3 kg/m2/s), and the average specific heat of the gas, cpg, is 1107 J/kg/K. The properties of the gas at 350°C are μ = 30.78 × 10⁻⁶ kg/m/s and kg = 0.0469 W/m/K. Assume physical properties are constant over the temperatures used in the simulation. To find the overall heat transfer coefficient, Equation (22.51) is used.
and
which are in the correct range to use Equation (22.51),
The reaction rate can be approximated by a pseudo-first-order equation:
where Component A is o-xylene, k = 4.122 × 10⁸e−13,636/T[K] mol/h/bar2/kg (catalyst), and Component B is oxygen with an initial partial pressure, pB,0 = 0.21 bar. The average heat of reaction for this temperature range −ΔHr is 1150 kJ/mol.
For illustration purposes, it is assumed that cooling takes place by heat exchange with a cooling medium flowing through the shell side at 335°C that vaporizes at constant pressure and temperature. With this assumption, the shell-side temperature, Tcool, is fixed at 335°C.
Determine the temperature profiles in the tube for partial pressures of o-xylene in the feed ranging from 0.01 to 0.02. Assume that the effect of changing pressure is small; that is, assume constant pressure conditions and a process gas inlet temperature of 335°C.
Solution
The energy balance Equation (22.44) can be written
The material balance is given by Equation (22.45):
In order to relate FA and pA, the stoichiometry of the reaction needs to be considered. Assume that the inlet gas to the reactor contains y mole of o-xylene per 100 moles of air. Using Equation (22.46), a mole balance for any conversion is

The result in Equation (E22.9c) is obvious from the stoichiometry, as there is no net change in the number of moles during the reaction. The relationship between pA and FA in Equation (22.47) is also used to close the two equations. Finally, Equation (22.49) is not required because Tcool does not change with z. By integrating these equations, the plots shown in Figure E22.9 are obtained. It can be seen that for partial pressures above approximately 0.0165 bar, the temperature bump or spike starts to increase significantly, and with a partial pressure of 0.0175, the reaction becomes uncontrollable resulting in a runaway. The conversions of o-xylene are also shown on this figure, and as expected, the conversions increase rapidly when runaway occurs.

Figure E22.9 Temperature and Conversion Profiles in the Shell-and-Tube Reactor from Example 22.9
When the cooling medium does not change phase, the temperature profile will change because Tcool changes down the length of the reactor. Examples for such cases are given in the problems at the end of this chapter.
A note about process safety: The lower explosion limit (LEL) for o-xylene in ambient air is about 0.90 mol%, and this drops to about 0.66 mol% at the temperature of the reactor inlet used in this example (335°C). The inlet concentrations shown in Figure Figure E22.9 are all above the LEL (and well below the upper explosion limit), so these are dangerous conditions at which to operate the reactor. Special design considerations must be employed if operation in the flammable region is unavoidable. These include containment, explosion venting, and explosion suppression. The idea behind containment is that the reactor is built to withstand the explosion pressure if it were to occur. Explosion venting allows the rapid release of vapor if an explosion were to occur, while explosion suppression would include the removal of all sources of ignition, suppression of flames, and flame propagation. All of these techniques require significant additional capital investment and should be carefully analyzed and other alternatives considered prior to the final design. For more information on these topics, the interested reader is referred to Mannan [9].
It should also be noted that as the temperature increases, the total combustion of the organic compounds will start to take place, giving water and carbon dioxide as products. The heat of combustion for o-xylene is 4375 kJ/mol, which is 3.8 times the heat of reaction to produce phthalic anhydride. Therefore, when the reaction starts to run away, the heat generated will be extremely large and the temperature profiles would be even steeper than those shown in Figure E22.9.
Example 22.9 considered the system to be at a constant pressure of approximately 1 atm. The pressure drop can be calculated using the Ergun equation. To account for the changes in gas properties along the length of the reactor, the differential form of the Ergun Equation, Equation (22.50), can be solved simultaneously with Equations (E22.9a) and (E22.9b). However, if the pressure does not change very much, then the integral form of the Ergun equation can be used. This is shown in Example 22.10.
For the reactor given in Example 22.9, determine the pressure drop across the reactor. Assume that the gas has the properties of air at the inlet conditions.
Solution
For air, the density at 1 atm and 335°C is 0.5778 kg/m3 and the viscosity is 30.85 × 10⁻¹ kg/m/s. Integrating Equation (22.50) and assuming the fluid properties remain unchanged gives
This pressure drop is significant when compared to the absolute pressure of the system (~101.3 kPa). An air blower would be required to push the air through the reactor, and the other process equipment and the reactor would operate at a pressure slightly above ambient.
The temperature profiles shown in Example 22.9 are very sensitive to the overall heat transfer coefficient, and this and alternative operating conditions are considered in the problems at the end of this chapter.
In reviewing the temperature profiles in Example 22.9, it is tempting to consider that perhaps an adiabatic bed operating at low inlet o-xylene concentrations might be a possible alternative configuration. For example, calculations show that when pA = 0.01 bar, the temperature across the reactor only changes by about 12°C or 13°C, so would it be possible to operate without cooling? This case is considered in Example 22.11.
Repeat Example 22.9 for the case when catalyst is placed in a packed bed without internal cooling, as shown in Figure 22.8(a). Determine the temperature and conversion profiles within such a packed bed for inlet partial pressures of o-xylene from 0.008 to 0.002 bar. Assume that the maximum allowable temperature to avoid catalyst sintering is 410°C.
Solution
The same equations given in Example 22.9 are used, except the value of the overall heat transfer coefficient, U, is set to 0.
The calculated results are shown in Figure E22.11. Clearly, the cooling of the process gas is significant in Example 22.9, and only very dilute feeds can give high conversions and still not exceed the maximum catalyst temperature of 410°C. From Figure E22.11, it is clear that a partial pressure of o-xylene around 0.002 bar and a bed length of around 3 m will satisfy these criteria.

Figure E22.11 Temperature and Conversion Profiles for Adiabatic Packed Bed Reactor for Example 22.11
The solution using pA = 0.002 bar may be technically feasible from a reaction standpoint, but the feed is approximately one-eighth the concentration of that required in a shell-and-tube reactor (0.002 bar vs. 0.0165 bar), which means that the front end of the process will have to handle eight times the flowrate of gas and that the equipment will be much larger. Moreover, when the phthalic anhydride is separated from the reactor effluent stream, the separation will be more difficult (lower partial pressure driving force) and more expensive (larger equipment and more utilities). Therefore, it is easy to see why a shell-and-tube reactor is favored in practice for this process.
22.2.2.5 Matching Volume and Heat Transfer Area
Often when designing a shell-and-tube reactor using a simulator, it is necessary to specify the heat exchanger configuration (cocurrent, countercurrent, number of tubes, and tube diameter) prior to simulation. However, in practice, it is the desired conversion of limiting reactant that is usually known (or a range of conversions that might be investigated is known), and the amount of catalyst and the heat exchanger surface area must be determined. Because the catalyst is contained within the tubes, the ratio of the heat transfer area to the volume of catalyst is always equal to . This constrains the problem and may lead to many infeasible solutions. For example, for pressure drop considerations, it might be necessary to use a large catalyst particle and hence fairly large tubes. Note that it is common practice for the ratio of Dtube/Dp to be ≥10. With a given cooling medium, it may be impossible to find a configuration that will prevent a runaway condition in the reactor. One solution is to dilute the feed stream to the reactor by adding an inert gas (e.g., steam or nitrogen) that would reduce the partial pressure of the reacting gases and slow the reaction rate. This solution has the disadvantage of requiring that extra material flow through the process, which will increase equipment size, increase heating/cooling utilities, and require more difficult product separation, because of the lower concentration of products in the reactor exit (effluent) stream. An alternative method is to “turn-down” the reaction rate by diluting the catalyst. For example, the catalyst could be mixed with similar sized particles of carrier material; that is, the same catalyst particles without the active catalytic material. Alternatively, it may be possible to dope the particles with less catalytic material. In both cases, the reaction rate per unit volume (or per unit weight) of catalyst would be decreased, and a solution avoiding temperature runaway may be found. In a similar manner, it is sometimes effective to dilute the catalyst at the beginning of the reactor (where the concentration is the highest) to avoid a runaway condition. Thus, the first few feet of a packed tube might be packed with a mixture of active catalyst and inert material, while the remainder of the tube would be packed with just active catalyst. Example 22.12 illustrates the concept of catalyst dilution.
Consider the reactor in Example 22.9 using an inlet o-xylene partial pressure of 0.0175 bar. Without dilution, this feed concentration leads to a runaway condition in the reactor. Explore the possibility of diluting the catalyst.
Solution
The reaction rate used in Example 22.9 was where
. The reaction rate is expressed in terms of per unit volume of catalyst, so if the catalyst were mixed with, say, 5% of inert material, then the effective rate of reaction of this mixture would be 95% (f = 0.95) of the rate given previously, and the value of k would be f times that of the undiluted catalyst, that is, .
The results for different dilution rates (f) are shown in Figure E22.12.
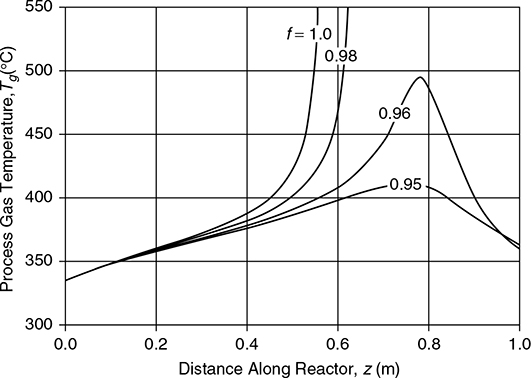

Figure E22.12 Process Gas Temperature and Conversion Profiles for Different Levels of Catalyst Dilution (f)
With a dilution factor of only 5%, the process gas temperature can be kept below the catalyst sintering temperature of 410°C with close to 80% conversion in a 1 m length of tube. For a 4 m long tube, the conversion increases to approximately 90%.
22.2.3 Fluidized Bed Reactor
The term fluidized bed reactor is used to describe a wide variety of gas-solid (and sometimes liquid-solid) reactor configurations in which the upward flow of fluid (gas) through a bed of catalyst particles exceeds the minimum fluidizing velocity. The type of fluidization is determined by the ratio of the superficial velocity to the minimum fluidizing velocity (us/umf) and the size of the particles. Several flow regime maps describing fluidized flow behavior have been published, and the one that is attributed to Grace [10] is probably the most widely used. A simplified version of this flow map was presented in Chapter 19, Figure 19.11. Pictorial representations of the four most common flow regimes are shown in Figure 22.12 and are discussed here:

Figure 22.12 Common Flow Regimes and Corresponding Voidage Profiles for Fluidized Beds: (a) Bubbling Bed, (b) Turbulent Bed, (c) Fast Fluidized or Circulating Bed (Showing High and Low Solids Circulation Rates), and (d) Transport (Pneumatic Conveying) Reactor (Adapted from Kunii and Levenspiel [13])
Bubbling fluidized bed (Figure 22.12[a]): For relatively low values of us/umf and small particles, the system behaves as a bubbling fluidized bed. According to the two-phase theory of fluidization first introduced by Toomey and Johnstone [11], the bed can be separated into two distinct phases: the emulsion phase and the bubble phase. The majority of the bed containing the solids is at or slightly above the minimum fluidizing velocity and comprises the emulsion phase. The excess gas, above that required for minimum fluidization, passes through the bed in the form of distinct bubbles. The two-phase theory was extended by the pioneering work of Davidson and Harrison [12] who proposed the first accurate hydrodynamic model of bubbling fluidized beds. The exchange of the gas between the emulsion and the bubble phases means that at times the gas will see regions of high catalyst loading (emulsion) and at times it will see low catalyst loading (bubbles). If the particles are small, then Davidson and Harrison showed that a bubble is surrounded by a cloud of circulating gas that stabilizes the bubbles that rise through the emulsion and also limits the exchange of gas between the two regions or phases. When this is the case, it leads to significant bypassing of gas through the bed with a corresponding reduction in conversion compared to pure plug flow. Conversely, when the particles are large, the gas bubbles tend to have very thin clouds and gas from the emulsion tends to “short-circuit” through the bubbles and back into the emulsion phase.
Turbulent fluidization (Figure 22.12[b]): For higher values of us/umf and all but the largest particles, the system behaves as a turbulent fluidized bed. In this regime, the gas no longer flows through the bed as distinct bubbles. Turbulent bed behavior is characterized by elongated voids of gas and streamers or strands of solid particles moving about the bed in a rather violent and haphazard fashion, making it difficult to identify individual phases. The bed surface also becomes somewhat indistinct. Pressure fluctuations across the bed are large, and the general form of the bed is unstructured and chaotic. Due to the violent nature of the fluidization, solids are flung upward into the freeboard region of the bed and tend to overflow with the gas stream. For this reason, internal cyclones are usually employed to help return the catalyst particles to the reactor.
Fast fluidization (Figure 22.12[c]): As the value of us/umf continues to increase, solids start to be transported from the top of the bed and out of the reactor. For such conditions, much of the reaction takes place above the dense bed formed at the bottom of the equipment. Reactors operating in this fast fluidization regime are constructed with a long riser configuration that discharges into an external cyclone. Solids disengage from the gas in the cyclone and are circulated back to the base of the reactor where they are reinjected into the bed and get transported back up through the riser and into the cyclone. In this way, solids circulate in a loop and sometimes these reactors are referred to as circulating fluid-bed reactors. The height of the dense bed at the bottom of the riser is a function of the solids circulation rate and increases with increasing circulation rate. The solids moving up in the riser form clusters and may move toward the wall and fall downward before being re-entrained. The net movement of solids is up, but significant solids recirculation exists in the riser.
Transport (pneumatic conveying) reactors (Figure 22.12[d]): When the gas velocity exceeds about 20 times the terminal velocity for small particles and the mass loading of solids-to-gas is also about 20:1, then particles move upward in a lean state with little interaction with each other. Thus, both solids and gas move essentially in plug flow upward through the reactor.
The type of fluidized bed reactor chosen for a given process depends on many factors, including the flowrate of gas and the size of catalyst particles. For example, in a bubbling bed, bubbles drag catalyst particles upward and provide good solids circulation that leads to near isothermal conditions in the bed. The disadvantages are that relatively low values of us/umf are needed, and to obtain such velocities, it may lead to beds that have large diameters and small heights. If higher gas velocities are required, circulating fluidized beds or transport reactors are normally used but do not act isothermally, although they still provide stable temperature control. A good review of the practical application of fluidized beds to a wide number of processes is given by Kunii and Levenspiel [13].
22.2.3.1 Reactor Models
As stated previously, reactor models for fluidized beds are generally complex and vary widely depending on the flow regime. The simplest models are phenomenological in nature, whereby a picture of the flow patterns of gas and solids is assumed (based on experimental observations), and then a model is developed around this picture of the reactor. At the complex end of the modeling spectrum, rigorous hydrodynamic models for each phase are postulated along with appropriate closure equations that describe the interactions between the phases. These models are then integrated with the material and energy balances along the length of the reactor to give concentration and temperature profiles. For details of the different models, the interested reader is referred to Kunii and Levenspiel [13] for phenomenological models and Gidaspow [14] for rigorous computational models of gas-solid hydrodynamics.
One very simple model is presented here to illustrate the approach used with phenomenological models. The model is the two-phase model given by Froment et al. [5] that is based on the work of May [15] and van Deemter [16], which may be used as a first approximation for a bubbling fluidized bed reactor. The model is illustrated in Figure 22.13, where the fluidized bed is split into an emulsion region and a bubble region. The incoming flow is split between the two regions with the gas required for minimum fluidization going into the emulsion region and the remainder of the feed gas going to the bubble region. There is an interchange of gas between the two regions that is characterized by kI (m3 gas/m3 total reactor/s).
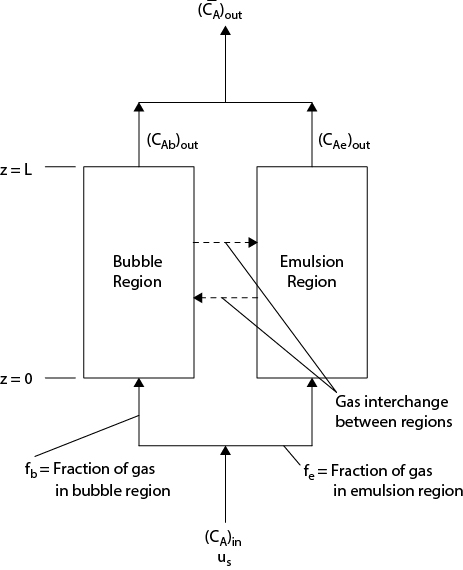
The equations describing the change in concentration in each phase are given as
and the exit gas concentration is given by the average of the gas leaving both regions as
where ue is the interstitial velocity in the emulsion phase (umf /εmf), ub is the rise velocity of the bubbles, fb is the fraction of the bed volume taken up by bubbles, and fe is the fraction of the bed volume taken up by the gas in the emulsion. kI is an interchange coefficient between the two phases and is expressed in m3/(m3 total reactor volume)/s. Values of kI must be found through experimentation using tracer techniques and are strong functions of the system parameters (particle size, fluidizing velocity, etc.). The term De is a dispersion parameter to describe the flow of gas in the emulsion phase. Expressions for De exist in the literature but are defined for only narrow ranges of operating and bed parameters, such as particle size, bed height, and us/umf. However, if plug flow or mixed flow of the gas are assumed in the emulsion phase, then De equals 0 or ∞, respectively. Van Swaaij and Zuiderweg [17] concluded that the simple two-phase model gave an adequate description of the mass transfer and reaction taking place in the ozone decomposition reaction occurring in a bubbling fluidized bed of silica. A problem based on this system is given at the end of this chapter.
22.3 Performance Problems
22.3.1 Ratios for Simple Cases
Most reactions and reactors of industrial importance do not operate isothermally and cannot be described with simple reactor models (PFR or CSTR). Therefore, analytical solutions for reactor problems in the real world are rare. Nevertheless, when changes in the process occur, then simple models may often be used to determine the direction of the expected trends and methods to mitigate (if needed) the process change that has occurred. Example 22.13 illustrates this point.
Consider the reaction in Example 22.4, which described the isothermal liquid-phase conversion of feed A to product B in a plug flow reactor. The reactor volume was found for a given temperature, and a conversion of 95% to be 304 L. The following data were provided:
, CA0 = 10 mol/L, the feed to the isothermal reactor was FA0 = 80 mol/s, and the design equation (Equation [22.32]) was
Now consider the case when the reactor is up and running, but the throughput to the reactor is increased by 20%. It may be assumed that heat generation within the reactor is negligible, that is, the heat of reaction is small. For this reactor, consider the following:
What will the new conversion be (assuming the temperature remains constant)?
If the original temperature of the reactor was 150°C, what should the temperature in the reactor be adjusted to so that the same conversion is achieved with the new throughput? The activation energy for this reaction is E = 20 kJ/mol.
Solution
The form of the reaction rate does not change, so the integrated form of the design equation is
Using ratios with subscript 1 representing the base case and 2 representing the new case and noting that k1 = k2 and CA0,1 = CA0,2 gives
Solving Equation (E22.13b),
In order to keep the conversion at 95%, the ratio k2/k1 must = FA0,2/FA0,1 = 1.2. Therefore,
There are two takeaways from Example 22.13. First, when the feed flowrate to the reactor increases and conditions of temperature (and pressure) remain constant, then the conversion goes down. This should be intuitively obvious, since the time spent by the reactants in the reactor (space time) is decreased giving less time for A to react to form B. Second, by increasing the reactor temperature (from 150°C to 164°C), the conversion can be maintained at 95% with the new throughput. Again this result should agree with intuition in that a shorter time in the reactor may be compensated by a higher rate of reaction caused by a higher reactor/reaction temperature.
22.3.2 More Complex Examples
As stated previously, when the operation of the reactor involves significant temperature changes, then the energy balance must be considered in conjunction with the material balance, and the solution of such problems involves the simultaneous solution of two (or more) algebraic (CSTR) or ordinary differential (PFR) equations. To illustrate a more complicated (nonisothermal) problem, Example 22.8 is revisited.
The problem statement for Example 22.8 was given as follows: An exothermic, liquid-phase reaction is to take place in a stirred tank reactor. The feed to the reactor (F) is pure A at 500 mol/min with a concentration of 10 mol/L. The volume of the reactor is 100 L, and the feed temperature is 30°C. A reaction takes place in which A is converted to B (A → B) by a first-order reaction:
The heat of reaction (−ΔHr) is 75,240 J/mol, and it is approximately constant from 30°C−200°C. Other data for the process and coolant are as follows:
Data:
cp,p = 4150 J/kg/°C, cp,c = 4180 J/kg/°C, TC,2 = 30°C, TC,1 = 20°C, U = 1000 W/m2/°C, ρp = 1050 kg/m3, and
In Example 22.8, the conversion was controlled at 80% by maintaining the reactor temperature at 93.5°C using cooling water entering the reactor at 20°C and leaving at 30°C. The mass flowrate of cooling water was calculated to be 6.486 kg/s, and the required area for heat transfer was 3.96 m2.
The reactor designed in this example was implemented and runs as predicted. However, it has been decided to increase the flow of reactant to 600 mol/min keeping the inlet concentration at 10 mol/L. What must the cooling water’s flowrate and exit temperature be in order to maintain the conversion at 80%?
Solution
With the new flowrate, the time spent in the reactor will decrease, so the reactor temperature must be increased to maintain the desired conversion. Referring to Part (b) of Example 22.8,
but now the value of τ has changed to
The energy balance on the reactor and the heat exchanger design equations (Equations [22.40] and [22.41]) must now be solved simultaneously to determine the new coolant flowrate and exit temperature. Using ratios with subscript 1 representing the design case and 2 representing the new case gives
To evaluate how the overall heat transfer coefficients change, the relative contributions to the inside and outside coefficients must be determined. For the sake of this example, it is assumed that the resistances are equal for the base-case design. The inside (cooling water flow) resistance will change by Re0.8, but the outside resistance will remain approximately constant assuming that the stirring speed does not change. Therefore,
Substituting this equation into Equation (E22.14h) gives
Solving equations (E22.14g) and (E22.14j) simultaneously gives
By decreasing the cooling water flow to 6.35 kg/s, the exit temperature increases to 32.25°C and the reactor temperature increases to 109°C (from 93.5°C). This allows the flow to the reactor to increase by 20% and still maintains 80% conversion.
Example 22.14 illustrates the need to solve the material balances, energy balances, and the design equation simultaneously when considering the behavior of reactors with heat exchange (or nonisothermal) behavior. In the case considered, the reactor was a CSTR and the equations are relatively simple to solve, since they are algebraic. For a PFR, the energy balance and material balances are in the forms of differential equations, and their solution is more complicated, but the same principles apply. Performance problems involving nonisothermal PFRs are considered in the problems at the end of this chapter.
WHAT YOU SHOULD HAVE LEARNED
Reaction kinetics, equilibrium, and heat transfer all play important roles in determining the correct design for chemical reactors.
There is a hierarchy of reactor configurations for removing heat from gas-phase exothermic (and endothermic) reactions.
Exothermic, gas-phase reactions may give rise to temperature hot spots in the reactor that can lead to dangerous conditions.
Simultaneous removal of heat from gas-catalyzed, reacting systems occurring in shell-and-tube reactors is necessary for highly exothermic reactions. Design of such systems often requires the solution of simultaneous coupled ordinary differential equations (ODEs).
Simultaneous removal of heat from liquid-phase reactions occurring in stirred tank reactors may be necessary. The design of such systems requires the solution of a set of coupled, nonlinear algebraic equations.
The role of mass transfer in determining reaction rates for heterogeneous (gas-solid catalyzed) systems is important and may dominate the kinetics at high temperatures.
The performance of simple reactor systems without temperature effects may be accomplished by comparing ratios.
References
1. Levenspiel, O. The Chemical Reactor Omnibook (Corvallis, OR: Distributed by OSU Book Stores, 1989).
2. Bondiera, J., and C. Naccache. “Kinetics of Methanol Dehydration in Dealuminated H-mordenite: Model with Acid and Basic Active Centres,” Appl. Catal. 69 (1991): 139–148.
3. Fogler, H. S. Elements of Chemical Reaction Engineering, 4th ed. (Upper Saddle River, NJ: Prentice Hall, 2006).
4. Levenspiel, O. Chemical Reaction Engineering, 3rd ed. (New York: Wiley, 1999).
5. Froment, G. F., K. B. Bischoff, and J. De Wilde. 2011. Chemical Reactor Analysis and Design, 3rd ed. (New York: Wiley, 2011).
6. Li, C.-H., and B. A. Finlayson. “Heat Transfer in Packed Beds—A Reevaluation,” Chem. Eng. Sci. 12 (1977): 1055–1066.
7. Dixon, A. G., and D. L. Cresswell. “Theoretical Prediction of Effective Heat Transfer Parameters in Packed Beds,” AIChE J. 25 (1979): 663–676.
8. Wakao, N., and S. Kaguei. Heat and Mass Transfer in Packed Beds. (New York: Gordon and Breach, 1982).
9. Mannan, S. Lees’ Process Safety Essentials: Hazard Identification, Assessment and Control. (Amsterdam: Elsevier, 2014).
10. Grace, J. R. “Contacting Modes and Behavior Classification of Gas—Solid and Other Two-Phase Suspensions,” Can. J. Chem. Eng. 64 (1986): 353–363.
11. Toomey, R. D., and H. F Johnstone. “Gas Fluidization of Solid Particles,” Chem. Eng. Prog. 48(5): 220–226, 1952.
12. Davidson, J. F., and D. Harrison. Fluidised Particles. (New York: Cambridge University Press, 1963).
13. Kunii, D., and O. Levenspiel. Fluidization Engineering, 2nd ed. (Boston: Butterworth-Heinemann, 1991).
14. Gidaspow, D. Multiphase Flow and Fluidization. (London: Academic Press, 1994).
15. May, M. G. “Fluidized Bed Reactor Studies,” Chem. Eng. Prog. 55 (1959): 49.
16. Van Deemter, J. J. “Mixing and Contacting in Gas-Solid Fluidized Beds,” Chem. Eng. Sci. 13 (1961): 143–154.
17. Van Swaaij, W. P. M., and F. J. Zuiderweg. “Investigation of Ozone Decomposition in Fluidized Beds on the Basis of a Two-Phase Model,” In Proc. 5th Eur. and 2nd Int. Symp. Chem. React. Eng., (Amsterdam: Elsevier, 1972): B9-25-36.
Short Answer Questions
1. A reaction between two components occurs in the gas phase and produces a single third component according to the following reaction:
Write the form of the reaction kinetics for the forward and reverse reactions assuming the reactions are elementary in form.
If the reaction in the forward direction is highly exothermic, and the reaction is at equilibrium at a given temperature T1, what is the effect on equilibrium of increasing the temperature?
2. Comment on the following statement: “For reactions in equilibrium, if the forward reaction is exothermic, then an increase in temperature reduces the conversion, which means that the forward reaction rate decreases with temperature.”
3. Comment on the following statement: “For highly exothermic reactions, some form of heat exchange should be integrated within the reactor.”
4. Comment on the following statement: “For an exothermic reaction, if the temperature is increased at constant pressure with a fixed reactor size, the conversion decreases.”
5. Sketch the T-Q diagram for an endothermic reaction in a PFR for
Countercurrent flow of HTM (heat transfer medium)
Cocurrent flow of HTM
What are the consequences on reactor size of choosing each configuration? Explain your answer by examining and discussing trends.
Problems
6. It is known that for a certain third-order, gas-phase reaction, the rate of reaction doubles when the temperature goes from 250°C to 270°C. The form of the rate equation is
If the rate of reaction is 10 moles/m3/s at the base conditions, which are 20 atm pressure and 250°C, and an equal molar flow of A and B are in the feed (no inerts), answer the following questions:
Compared to the base case, by how much does the rate of reaction (at inlet conditions) change if the temperature is increased to 260°C?
Compared to the base case, by how much does the rate of reaction (at inlet conditions) change if the pressure is increased by 15%?
7. Consider the following reactiona for the production of benzene via the homogeneous thermal dealkylation of toluene in the temperature range 700°C to 950°C:
where the concentrations of reactants are in mol/L reactor and the temperature is in K. The heat of reaction is −52.0 kJ/mol (at 900°C) and −50.5 kJ/mol (at 700°C), and the average specific heats of the reactor feed and effluent are 3.3216 kJ/kg/K (at 950°C) and 3.042 kJ/kg/K (700°C).
If feed enters the reactor at 700°C and 25 bar, solve the material and energy balances for a plug flow reactor to determine the volume of reactor needed to give 90% conversion of toluene. The feed to the reactor comprises 80 kmol/h of toluene and 320 kmol/h of hydrogen. Plot the conversion and temperature profiles in the reactor.
Compare your results for Part (a) with the results from a commercial simulator. Use the Soave-Redlich-Kwong and latent heat methods for the vapor-liquid equilibrium and enthalpy packages, respectively.
8. For the solution to Problem 22.7(a), and assuming that the reactor is packed with inert ceramic spheres, 5 mm in diameter with a voidage of 0.45, and that the reactor has a Length/Diameter ratio of 8:1, determine the pressure drop across the reactor. For this problem use an average viscosity of the process gas of 26.8×10⁻⁶ kg/m/s and an average gas density calculated from the ideal gas law. Comment on the accuracy of using these average property values to determine the pressure drop across the reactor.
9. Consider the production of cumene (c) from the catalytic alkylation reaction of benzene (b) using propylene (p)—Reaction 1. A second undesirable reaction (Reaction 2) between propylene and cumene occurs to produce p-diisopropyl benzene (DIPB):
where r1 = k1cpcb and r2 = k2cpcc and the rates of reaction are given in mol/L/s and the rate constants are and . These reactions are quite exothermic, and typical reactor temperatures are in the range 350°C to 410°C. The heats of reaction per mol of product in this temperature range are −100.6 kJ/mol and 121.3 kJ/mol for Reactions 1 and 2, respectively. The heat capacities for the reactant and product streams may be taken to be the same and equal to 2.44 kJ/kg/K in this range. For this system, do the following:
Determine the conversion of an equimolar feed of propylene and benzene (feed conditions are 350°C, 3 MPa, and 100 mol/s) if the reactor is run as an adiabatic packed bed with a maximum outlet temperature of 425°C.
Based on the results from Part (a), is it feasible to obtain an overall conversion of 80% of the benzene using a series of staged packed beds with cooling between stages to bring the temperature back to 350°C at the inlet of the next reactor stage? Note: In practice, no more than four stages would be used.
10. Reexamine Problem 22.9 for the following cases:
Design a packed bed reactor with intercooling (shell-and-tube design) using a cooling medium with a phase change (Tboil = 350°C) to obtain 80% overall conversion of benzene. Assume that the catalyst tubes have a 2-in diameter and are 3 m in length packed with 5 mm diameter spherical catalyst particles of density 2350 kg/m3 and voidage = 0.5. The properties of the process gas may be taken as constant with the viscosity as 17 × 10−6 kg/m/s and the thermal conductivity as 0.0525 W/m/K. For this case, you need to determine the number of tubes needed to give the desired conversion of benzene. For your design, the hot spot in the reactor must not exceed the maximum value of 425°C.
Repeat Part (a) above using a process simulator.
11. For the stirred tank reactor in Example 22.8, determine whether the chosen operating/design point (T = 93.5, X = 80%, TC,1 = 20°C, TC,2 = 30°C, and A = 3.96 m2) represents a stable operating condition.
12. For the case of methanol synthesis discussed in Example 22.2, determine the appropriate expression for the equilibrium constant K(T) for the case when inerts are present in the feed along with the stoichiometric amounts of CO and hydrogen. What is the effect of adding 50% inerts to the feed for the case when the temperature is 500 K and the pressure is 100 bar?
13. Using the data from Example 22.3, determine the volume of catalyst needed to convert 80% of a feed of pure methanol (at a rate of 12,500 kg/h) at 14 atm and 250°C in an adiabatic packed bed reactor for the following conditions:
When pore diffusion effects are ignored
Taking account of pore diffusion—note that the value of MT and the catalyst effectiveness should be evaluated along the length of the reactor
Hint: You may assume that the following gas properties (except gas density) are constant along the length of the reactor: cp = 2.10 kJ/kg/K, µ = 1.85 × 10⁻⁵ kg/m/s, k = 0.049 W/m/K, ρin = 10.93 kg/m3, −ΔHr = 12,000 J/mol, Dp = 3 mm, and voidage, ε = 0.45.
14. In Example 22.9, the temperature and conversion profiles along the length of a plug flow reactor were generated for the production of phthalic anhydride from o-xylene assuming an overall heat transfer coefficient of 88.9 W/m2/K. The accuracy of heat transfer correlations is known to vary significantly. Assuming that the reactor was designed for an inlet partial pressure of o-xylene of 0.0165 bar, determine the following:
The temperature and conversion profiles for a catalyst-filled reactor tube 1 m long when the heat transfer coefficient is 10% greater than predicted by the correlation.
The temperature and conversion profiles for a catalyst-filled reactor tube 1 m long when the heat transfer coefficient is 10% lower than predicted by the correlation.
Based on these results, how would you determine the actual reactor design needed to avoid a temperature runaway?
15. In Example 22.9, the temperature and conversion profiles along the length of a plug flow reactor were generated for the production of phthalic anhydride from o-xylene assuming a tube diameter of 1 in (25.4 mm). Repeat the problem for an inlet partial pressure of o-xylene of 0.0165 bar and a 2-in tube. Compare your results to those for the 1-in tube and discuss the differences.
16. In Example 22.9, the temperature and conversion profiles along the length of a plug flow reactor were generated for the production of phthalic anhydride from o-xylene assuming a particle size of 3 mm. Repeat this problem for an inlet partial pressure of o-xylene of 0.0165 bar using the following catalyst particle sizes, and determine the pressure drop across the bed. You may assume the same average gas properties as given in the example.
5 mm
2 mm
17. In Example 22.9, the secondary combustion reaction of o-xylene was ignored. If this reaction can be approximated by the following reaction rate, rework the example for inlet partial pressures of o-xylene (Component A) of 0.015, 0.016, 0.0170, and 0.0175 bar.
Do the results change significantly from those given in Example 22.9? Are your conclusions surprising, and could you have determined these results by simply comparing the basic kinetic equations?
18. One technique to control the generation of a hot spot at the beginning of a reactor is to load the front end of the reactor with a diluted catalyst and then to load the remainder of the reactor with the undiluted catalyst. For the phthalic anhydride example given in Examples 22.9, 22.10, and 22.11, it has been decided to load the front end of the reactor tubes with a catalyst containing 5% inactive material (f = 0.95) and the remainder with fully active catalyst (f = 1.0). For a 1 m length, 25.4 mm diameter tube, what is the maximum conversion of o-xylene (pA,in = 0.0175 bar) that can be achieved without exceeding the maximum catalyst temperature of 410°C?
19. In the production of cumene from propylene, the following elementary, vapor-phase, irreversible reaction takes place:
The reaction rate is given by
The feed to a fluidized bed reactor consists of an equal ratio of benzene and propylene. The reaction takes place in a fluidized bed reactor operating at 300°C and 3 MPa pressure. For this problem, the fluidized bed may be assumed to be a constant-temperature CSTR reactor.
At design conditions, you may assume that side reactions do not take place to any great extent and the conversion is 68%.
It is desired to scale up production by 25% and all flows to the reactor will increase by 25% at the same feed concentration. Determine the following:
What is the single-pass conversion if the process conditions and amount of catalyst remain unchanged?
What percentage change in catalyst would be required to achieve the scale-up assuming that the pressure, temperature, and conversion were held constant?
Estimate how much the temperature would have to be changed (without changes in catalyst amount, operating pressure, or conversion) to achieve the desired scale-up.
By how much would the pressure have to be changed (without changes in catalyst amount, operating temperature, or conversion) to achieve the desired scale-up?
20. Consider a liquid-phase reaction occurring in a constant-volume, isothermal, batch reactor.
For a first-order decomposition, what is the ratio of the time to reach 75% conversion to the time to reach 50% conversion?
For a first-order decomposition, what is the ratio of the time to reach 90% conversion to the time to reach 50% conversion?
Repeat Parts (a) and (b) for a second-order reaction between reactants initially in equimolar quantities.
Explain the results for Parts (a), (b), and (c).
21. In an isothermal batch reactor, a first-order, irreversible, liquid-phase reaction, A → B, occurs. The initial concentration is CAo.
By what percentage must the reaction time be increased to raise the conversion of A from 0.9 to 0.95?
If the initial conversion is 0.8, what will the final conversion be if the reaction time is increased by 50%?
22. Repeat Problem 22.21 for a catalytic/enzymatic reaction with a rate expression of the form
where cA0 = 10 mol/L, k1 = 3.5 s−1, and k2 = 0.45 L/mol
23. It is known that for a certain second-order, elementary, gas-phase reaction (first order in A, first order in B), the rate of reaction increases by 50% when the temperature goes from 250°C to 280°C. In a laboratory setup, a plug flow reactor operates at essentially isothermal conditions (250°C) and at an operating pressure of 20 atm. For a fixed inlet flowrate (equal molar flows of A and B in the feed with no inerts), the measured conversion of A is 57%.
Compared to the base case, by how much does the conversion change if the temperature is increased to 265°C?
Compared to the base case, by how much does the conversion change if the pressure is increased by 20%?
24. Consider a liquid-phase reaction occurring in a constant-volume, isothermal CSTR.
For a first-order decomposition, what is the ratio of the volume of reactor needed for 75% conversion to the volume needed for 50% conversion?
For a first-order decomposition, what is the ratio of the volume of reactor needed for 90% conversion to the volume needed for 50% conversion?
Repeat Parts (a) and (b) for a second-order reaction between reactants initially in equimolar quantities.
Explain the results of Parts (a), (b), and (c).
25. Consider the dehydration of isopropyl alcohol (IPA) to yield acetone and hydrogen:
This reaction is endothermic, with a heat of reaction of 57.2 kJ/mol. The reaction is kinetically controlled and occurs in the vapor phase over a catalyst. The reaction kinetics for this reaction are first order with respect to the concentration of alcohol and can be estimated from the following equation:b,c
where Ea = 72.38 MJ/kmol, k0 = 1.931×10⁵ m3 (gas)/m3 (reactor)/s, and cIPA has units of kmol/m3 (gas).
The feed to the reactor is 87 wt% IPA in water at 240°C and 2 bar. Spherical catalyst particles (5 mm in diameter) are placed in 50 mm ID tubes of length 6 m. The heat transfer coefficient on the tube side of the reactor is limiting. A heat transfer medium (HTM) is available as part of a heating loop that supplies the HTM to the reactor shell at 400°C.
Properties of the heat transfer fluid are
Properties of the process gas are
Properties of the catalyst are
Determine the conversion of alcohol to acetone assuming that the HTM flows cocurrently with the process gas. Assume that the HTM flows at a rate of 200,000 kg/h, the inlet flowrate to the reactor is 8,000 kg/h of IPA and water, and the reactor has a total of 1600 tubes arranged on a square pitch with the tube centers 75 mm apart.
Sketch the temperature concentration profiles in a single reactor tube.
26. For the setup in Problem 22.25, do the following:
Reconfigure the utility flow to be countercurrent with the process gas and determine the conversion of IPA.
Sketch the temperature concentration profiles in a single reactor tube.
27. For the setup in Problem 22.25, do the following:
Determine the change in IPA conversion if the flowrate to the reactor increases by 25% but the utility flow does not change.
Determine the change in utility flowrate that must accommodate the change in feed gas rate in order to maintain the same conversion of IPA as in Problem 22.25.
28. Determine the pressure drop across the reactor tubes for Problem 22.25.
29. The catalytic decomposition of ozone in fluidized beds of silica particles impregnated with Fe2O3 was studied by Van Swaaij and Zuiderweg.d The decomposition reaction for a given temperature and catalyst loading was shown to follow a simple first-order model:
These researchers report the following experimental results:
For the case where the interchange coefficient between the bubble and emulsion phase is zero (i.e., gas in bubbles does not interact with the catalyst), determine the conversion of pure ozone feed when the emulsion phase is completely well mixed.
30. Repeat Problem 22.29 for the case when the gas flows through the emulsion phase in plug flow.
31. For the laminar flow reactor problem given in Example 22.6, determine the volume of the reactor needed to obtain a conversion of 95%.
32. For the laminar flow reactor problem given in Example 22.6, determine the flowrate of feed needed to increase the conversion to 95%.
33. For the laminar flow reactor problem given in Example 22.6, determine conversion in the reactor when the flowrate of feed is increased by 25%.
a Zimmerman, C. C., and R. York, “Thermal Demethylation of Toluene,” Ind. Eng. Chem. Proc. Des. Dev. 3 (1964): 254–258.
b McKetta, J. J., and W. A. Cunningham (Ed.), Encyclopedia of Chemical Processing and Design, vol. 1 (New York: Marcel Dekker, 1976), 314–362.
c Sheely, C. Q., Kinetics of Catalytic Dehydrogenation of Isopropanol, Ph.D. Thesis, University of Illinois, 1963.
d van Swaaij, W. P. M., and F. J. Zuiderweg, “Investigation of Ozone Decomposition in Fluidised Beds on the Basis of a Two-Phase Model,” Chem. React. Eng., Proc. Eur. Symp. B, B9-25-36, 1972.