Debugging is the task of analyzing the application’s execution flow and investigating it for errors. Therefore, debugging is one of the most important tasks in your developer life.
Debugging can be a painful experience if a development platform does not offer powerful analysis tools. Luckily, both Xamarin and .NET Core provide powerful debuggers, and Visual Studio for Mac ships with unified visual tools that dramatically simplify the way you debug your code and focus on productivity. If you are familiar with Xamarin Studio or Visual Studio on Windows, you will feel at home with what Visual Studio for Mac has to offer. If you instead come from Xcode, you will be surprised about how amazing the debugging experience is with Visual Studio.
Meeting the Debuggers
Visual Studio for Mac leverages debuggers that ship with the two major frameworks it relies on.
For .NET Core, Visual Studio relies on the Microsoft .NET Core Debugger, which is included in the .NET Core SDK you installed in Chapter 1. This is the same debugger used by environments such as Visual Studio Code and Visual Studio on Windows for .NET Core apps. For Xamarin, Visual Studio leverages the Mono Soft Debugger ( http://bit.ly/2p4MwHc ), a specific debugger for Mono whose main characteristic is that it is a cooperative debugger built into the Mono framework, which is different from most debuggers that are stand-alone processes.
The goal of this chapter is not explaining what happens behind the scenes of the debuggers; rather, I will explain the powerful, unified tools that the IDE provides to debug applications regardless of the backing debugger. Obviously, Android and iOS are two different systems, and therefore the Mono Soft Debugger will send different kinds of messages depending on the current platform. The same concept applies to the Microsoft .NET Core Debugger, whose behavior is totally different from the Mono Soft Debugger; it will show its own messages, and it has its own characteristics.
Preparing an Example
For a better understanding of all the available debugging tools, a good idea is to prepare an example that contains intentional errors. So, following the lessons learned in the previous chapter, create a new .NET Core console project and assign a name of your choice.
When ready, edit the Main method as follows:
static void Main(string[] args){// Show a welcome message. This is stored in a variable// to demonstrate how to use some debugging toolsstring welcomeMessage = "Reading a file...";Console.WriteLine(welcomeMessage);string content;// Attempt to open a text file from diskFileStream fileStream = new FileStream("file.txt",FileMode.Open);using (StreamReader reader = new StreamReader(fileStream)){content = reader.ReadLine();}// Show the file contentConsole.WriteLine(content);}
The sample code is simple: it shows a welcome message stored in a variable and then tries to read the content of a text file that will be shown on the screen. Notice that I’ve intentionally stored a message inside a variable rather than passing it directly as an argument to Console.WriteLine, and I missed a try.. catch block to handle input/output (I/O) exceptions; this is required to demonstrate how to leverage some of the debugging tools in the IDE.
Note
When you start debugging an application, Visual Studio shows a number of debugging pads, all discussed in detail in this chapter. However, these are displayed a few seconds after the application starts. If you select View ➤ Debug, all the debugging pads will be displayed before you start the application and will be populated with debugger information from the app startup. You can then revert to the previous layout by selecting View ➤ Code.
Debugging an Application
As you learned in Chapter 2, you debug an application by first selecting the Debug configuration and then selecting Run ➤ Start Debugging. Depending on the current development platform, Visual Studio will attach either the Microsoft .NET Core Debugger or the Mono Soft Debugger for Xamarin.
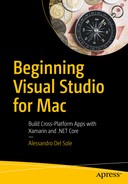
During the whole application life cycle, Visual Studio shows any messages that the debugger sends in the Application Output pad. Figure 3-1 shows an example based on the sample code provided previously, where you can also see how the debugger captured an exception.
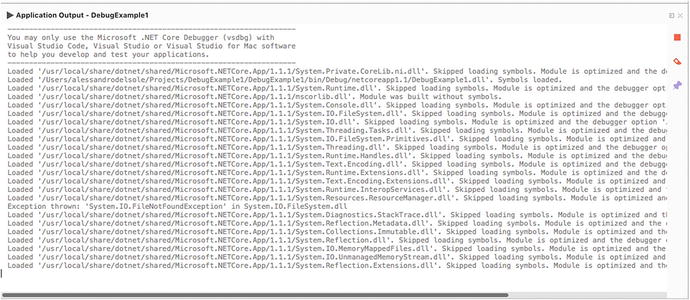
Figure 3-1. The Application Output pad
The Application Output pad is of crucial importance when debugging because it shows the flow of information that the debugger sends. This is particularly important in the case of runtime problems and exceptions raised by your application or errors that the system might encounter when hosting your application. Like the other pads, the Application Output pad can autohide, and it can be docked to a different position in the IDE for your convenience. You will use the Application Output pad many times in this chapter, so take the time to familiarize yourself with it.
Using Breakpoints and Data Visualizers
Breakpoints are probably the debugging tool you will use most frequently. They basically allow you to control the execution flow of your applications. A breakpoint causes an application to break its execution at the point where the breakpoint was placed.
Note
Whether the application execution breaks because of a breakpoint or because of a runtime error, it enters into break mode.
When a breakpoint is hit and the application execution stops, you can take any necessary actions, such as investigating variable values at that point of the execution or executing the code line by line. The easiest way to add a breakpoint is to click the leftmost column in the code editor corresponding to the line of code that you want to be the point in which the application execution breaks. A breakpoint is easily recognizable because it highlights in red the line of code, as shown in Figure 3-2.
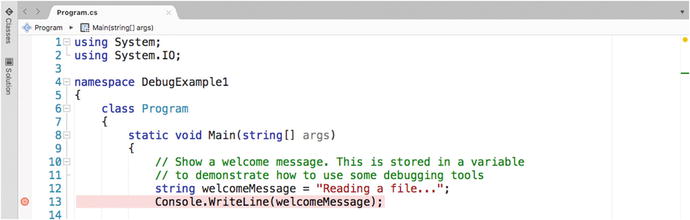
Figure 3-2. Adding a breakpoint
You can add multiple breakpoints in different code files to control the execution flow. Now start debugging the application to see how breakpoints work. When the application is running and the debugger encounters a breakpoint, it breaks the execution and highlights in yellow the line of code that is being debugged, before the line is executed. Figure 3-3 shows an example.
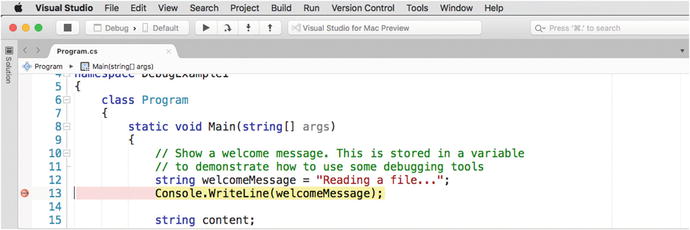
Figure 3-3. A breakpoint being hit before the line of code is executed
Once the breakpoint has been hit and the line of code is highlighted in yellow, you can perform many actions such as debugging in steps (discussed shortly) or investigating the content of objects and variables with the data visualizers. Data visualizers are small pop-ups that appear when you hover your mouse over a local variable, field, or property. For example, if you hover your mouse over the welcomeMessage variable, you will see a data visualizer that shows its value (see Figure 3-4).
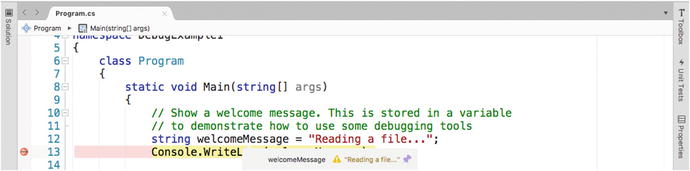
Figure 3-4. Investigating variables with data visualizers
In this case, the value for welcomeMessage has been supplied in code, but data visualizers are extremely useful when variables contain the result of a calculation or the evaluation of an expression, and they allow you to see whether the actual value is the expected result. If not, you can perform additional investigations to see what the problem is. You can also pin a data visualizer to the code editor by clicking the icon at its right side. Data visualizers are also available in the Locals pad, discussed shortly.
You will use data visualizers many times while debugging because they quickly help you understand if objects are populated as expected. For now, just click the Start button in the toolbar to resume the application execution. In the next section, you will learn more about executing code in steps.
Configuring Breakpoints with Settings and Actions
Breakpoints can be configured so that you can decide when and how they should condition the application execution. If you right-click the red glyph of a breakpoint and then select Edit Breakpoint, you will access the Edit Breakpoint dialog.
Here you can specify conditions and actions. Conditions determine when the debugger should break the application execution when it encounters a breakpoint, whereas actions allow special tasks to occur when a breakpoint is hit. They can work together for maximum control over the execution flow. Figure 3-5 shows the Edit Breakpoint dialog.
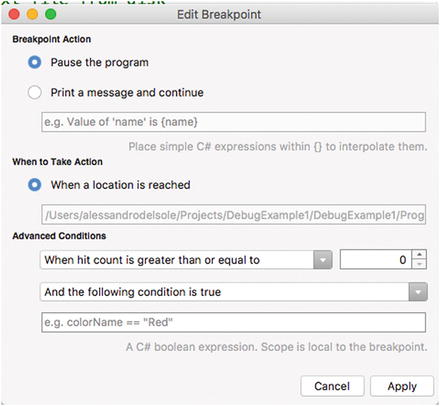
Figure 3-5. Editing action and conditions for a breakpoint
Let’s start with actions. In the Breakpoint Action group, the default selection is “Pause the program,” which simply causes the debugger to break the application execution when a breakpoint is hit. This is the behavior you saw when running the sample code after placing a breakpoint. As an alternative, the “Print a message and continue” option will not break the application execution. Instead, it will show a message in the Application Output pad. The interesting thing is that, in the message, you can interpolate any C# expression within curly braces, which is useful to evaluate the value of a variable or of an object’s properties. In the When to Take Action group, there is only one option, called “When a location is reached.” The value of this setting is the file name and line of code where the breakpoint is currently placed; this is a read-only setting, so you cannot change it.
Regarding conditions, by default the application enter breaks mode every time it encounters a breakpoint. However, sometimes you might want to place breakpoints but break the application execution only if a certain condition is true. For example, if you are iterating a collection with a foreach loop, you might want to break the application execution only after a certain number of iterations. To accomplish this, you can select one of the available conditions from the Advanced Conditions combo box (see Figure 3-5). You can see how the name of each condition starts with “When hit count is.” With the “hit” word, I mean each time a breakpoint is encountered; therefore, the application execution should stop. In other words, conditions allow you to control a hit’s behavior. For example, the “When hit count is greater than or equal to” condition will cause the application execution to break only after a breakpoint has been hit for a number of times that is greater than or equal to the number that you can specify with the selector on the right. Other condition names are self-explanatory, and the behavior of each condition is similar, except that the condition will be “less than” or “greater to.”
You can specify additional conditions with the “And the following condition is true” and “And the following expression changes” options. The first option allows you to specify a C# expression that must be evaluated to true to break the application execution, whereas the second option allows you to decide that an application should enter break mode when the value of the supplied C# expression changes.
In summary, conditions and actions are useful when you want a breakpoint to be hit only under certain circumstances, and they allow for a better execution flow.
Adding Function Breakpoints and Exception Catchpoints
Previously, you saw how to add a breakpoint the easy way, and then you saw how to edit a breakpoint with conditions and actions. Visual Studio for Mac also allows you to specify conditions and actions, as well as other options, directly when adding a new breakpoint by right-clicking the leftmost column in the code editor and then selecting New Breakpoint.
This will open the Create a Breakpoint dialog, which looks like Figure 3-6.
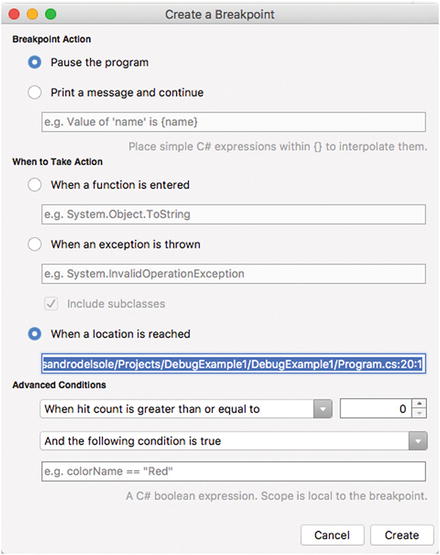
Figure 3-6. Adding function tracepoints and exception catchpoints
Most of the options are the same as discussed for the Edit Breakpoint dialog. Additionally, you will find the following two actions in the When to Take Action group: “When a function is entered” and “When an exception is thrown” (the default action is hitting the breakpoint when it’s encountered). The first action is also referred to as a function breakpoint, whereas the second option is also referred to as an exception catchpoint. A function breakpoint will cause the debugger to break the application execution when the specified method call is invoked, regardless of its position in the code. An exception catchpoint will cause the debugger to break the application execution when the specified exception is thrown at runtime, regardless of where it happens. The interesting thing is that both options are unrelated to any line of code. Therefore, they will act as breakpoints, but they really do not need a breakpoint in the code editor. Visual Studio keeps track of function breakpoints and exception catchpoints and allow you to control them in the Breakpoints pad, as you will discover in a moment. When ready, simply click Create, and a breakpoint will be placed on the current line of code.
Investigating Runtime Errors
A runtime error is an error that occurs during application execution. Runtime errors are typically because of programming errors that are not visible at compile time and that might involve unpredictable situations. For example, if an application gives users the ability to write a file name but then the file is not found on disk, a runtime error will occur.
As an additional example, if an application attempts to connect to a database that is unreachable for network connectivity issues, a runtime error will occur. Obviously, in real-life applications, it is your responsibility, as the developer, to predict such possibilities and implement the appropriate try.. catch blocks. However, for various reasons, unhandled runtime errors might occur, and the debugger in Visual Studio for Mac offers the proper tools to help understand the cause of the problem. If you run the sample code provided at the beginning (with no breakpoints), after a few seconds a runtime error will cause the debugger to break the application execution because the code is searching for a file that does not exist. At this point, Visual Studio highlights the line of code that caused the error and will show a tooltip that contains the exception name and the error description, as shown in Figure 3-7.
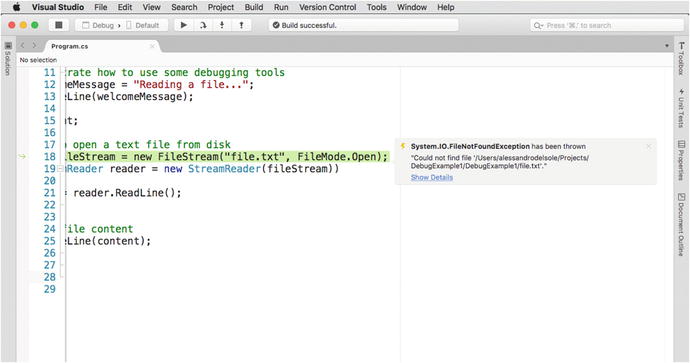
Figure 3-7. Adding function tracepoints and exception catchpoints
In this case, the code failed because it was searching for a file that does not exist, so a FileNotFoundException error was thrown and was not handled by any try.. catch block; therefore, the execution of the application was broken. So, Visual Studio shows the name of the exception that was raised and the file name that was not found (this is included in the exception message). Actually, Visual Studio allows you to investigate an exception further and retrieve all the details that the debugger was able to collect. To accomplish this, click Show Details, which opens the Exception Caught dialog (see Figure 3-8).
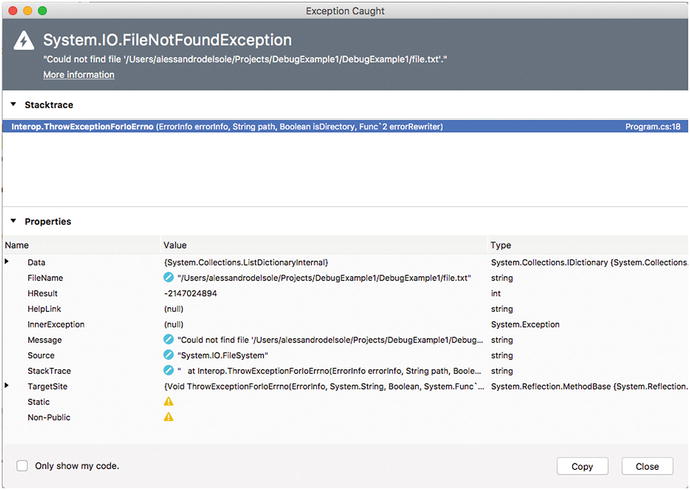
Figure 3-8. Investigating an exception’s details
Exception Caught shows all the information about the exception, and because an exception is a .NET type that inherits from System.Exception, you will see the list of exception properties depending on the specialized exception type (in the case of a FileNotFoundException, you will see the FileName property showing the file that was not found). At the top of the dialog, the Stacktrace item shows the hierarchy of calls to classes and methods that effectively produced the error. By default, Stacktrace only shows information from your code, so if you want to see the entire call hierarchy, you need to disable the “Only show my code” option at the bottom. Also useful is the InnerException property. In our particular example, it is set to null, but it’s not unusual for this item to show an exceptions tree that enables you to better understand what actually caused an error. The Exception Caught dialog also allows you to investigate property values further with data visualizers, so you can hover your mouse over a property name or its value and enable the proper visualizer, as you learned previously in the “Using Breakpoints and Data Visualizers” section.
Debugging Instrumentation
Visual Studio for Mac provides sophisticated tools for debugging code and analyzing the behavior of an application. With these tools, you can control the execution flow and retrieve detailed information about variables and object instances. They are explained in this section.
Debugging in Steps
When the application execution breaks, such as when the debugger encounters a breakpoint, you have different options to continue the execution. For instance, you can completely resume the execution or you can just execute one line of code per time or small sets of lines of code per time. To accomplish this, you use a number of commands that are available in the Run menu and in the debugging toolbar (and through the related keyboard shortcuts). Table 3-1 describes these commands. For some of them, you can use button shortcuts from the Debug toolbar, which you can see in Figure 3-7 between the configuration options and the build status bar.
Table 3-1. Debugging in Steps
Command | Description |
|---|---|
Continue Debugging | Resumes the application execution from the point at which it broke. A shortcut in the Debug toolbar is available via the first button on the left. |
Step Into | Executes one instruction per time. This is similar to Step Over, but if the instruction to be executed is a method, the method is executed one instruction per time; when finished, the execution goes back to the caller. A shortcut in the Debug toolbar is available through the third button from the left. |
Step Over | Executes one instruction per time. The difference with Step Into is that if the instruction to be executed is a method, the debugger does not enter the method and completes its execution before going back to the caller. This can be useful when you need to debug a portion of code that invokes several methods you already tested and that you do not need to delve into each time. A shortcut in the Debug toolbar is available through the second button from the left. |
Step Out | Executes all lines of a method next to the current one, until the method completes. Step Out does not work outside of methods. A shortcut in the Debug toolbar is available through the fourth button from the left. |
Run To Cursor | Allows running all the code until the selected line. You call it by right-clicking a line of code and then selecting Run To Cursor. |
Set Next Statement | Within a code block, allows setting the next statement to be executed when resuming the application execution after a breakpoint or stop. |
Show Next Statement | Moves the cursor to the next executable statement. This can be useful if you have long code files and breakpoints are not immediately visible. |
Show Current Execution Line | Moves the cursor to the current statement. This is useful when, with long code files, the cursor is in a totally different place. |
Run To Cursor, Set Next Statement, Show Next Statement, and Show Current Execution Line are not available in the Debug toolbar, and you can find them in the Run menu or by right-clicking the code editor.
Stepping Into Framework Code
By default, the debugger steps into your code, not into system code. However, sometimes it would be useful to investigate further into the full code stack, which involves stepping into the code of the Mono and .NET Core libraries.
To accomplish this, you can select Visual Studio ➤ Preferences ➤ Debugger and deselect the check box called “Debug project code only; do not step into framework code.” With this option disabled, Visual Studio will allow you to step into the source code of a system library by opening new editor windows where you will be able to use most of the debugging tools described in this chapter.
Debugging Pads
To make it easier to analyze an application’s behavior, Visual Studio for Mac provides special pads that you can use while debugging. Visual Studio automatically shows these pads when you start debugging an application. If you decide to close one or more pads while debugging, you can always reenable them individually with View ➤ Debug Pads, and you can enable them all with View ➤ Debug.
The Breakpoints Pad
The Breakpoints pad provides a visual representation of all the breakpoints in a solution, plus a number of shortcuts that make it easier to add, edit, and remove breakpoints. Figure 3-9 shows an example where you can see a breakpoint and an exception catchpoint.
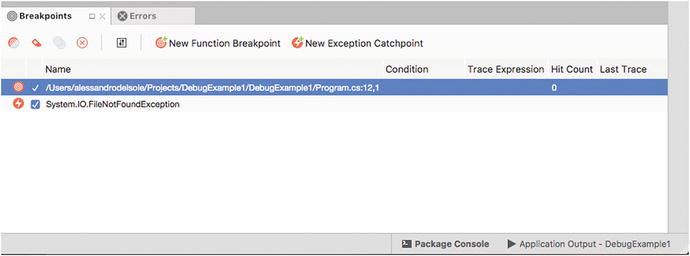
Figure 3-9. The Breakpoints pad
The Breakpoints pad shows the list of breakpoints, function breakpoints, and exception catchpoints, each recognizable by a specific icon. For breakpoints, it shows the code file and line number and the hit count if a condition has been specified. While debugging, the hit count will increase every time the breakpoint is encountered. You can double-click a breakpoint, and the code editor will move the cursor to the line where the breakpoint is. You can also disable one or more breakpoints using the check box at the left side. The pad’s toolbar has buttons that allow you to disable, remove, edit, and add breakpoints.
The Locals Pad
The Locals pad shows the active local variables and their values while debugging. Figure 3-10 shows an example where you can see active variables for the sample code provided previously, when stepping into the Main method. For example, you can see how the value for the welcomeMessage variable is "Reading a file...". This is useful especially with local variables whose value is the result of an evaluation or of an assignment.
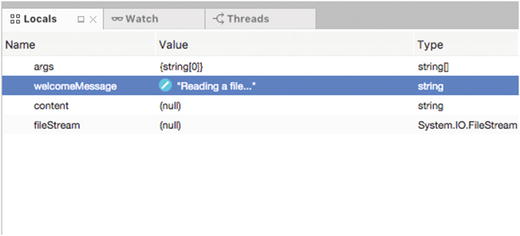
Figure 3-10. The Locals pad
For each variable, the Locals pad shows not only the name and value but also the type. When a variable has not been initialized yet, it shows the default value (such as null for reference types or zero for integers). In addition, you can hover your mouse over a variable and view its content with data visualizers, and you can even change a variable’s value by double-clicking each one.
Note
In the Locals pad, data visualizers also show an appropriate preview based on the variable type. For instance, if a variable represents a color, the data visualizer will show a box that depicts the color and that shows the RGB properties, not just the C# value. Specific previews are available for types that represent location coordinates, images, size, points, Bezier curves, collections that implement the IEnumerable interface, and of course strings.
The Watch Pad
The Watch pad allows for monitoring object variables, methods, or expressions so that you can monitor what a variable is doing. When in break mode, you can enter the Watch pad and type in the name of a variable. Visual Studio will show the value for the variable at that specific time (see Figure 3-11).
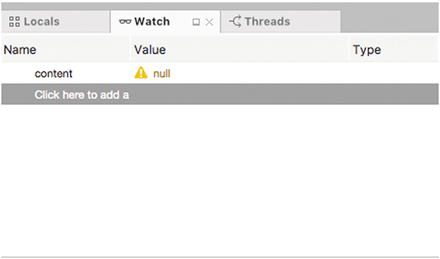
Figure 3-11. The Watch pad
You need to step into the code and wait for an expression to be evaluated and assigned to the variable you entered in the Watch pad. The pad will be updated every time the result of the evaluation changes.
The Call Stack Pad
The Call Stack pad allows you to view the hierarchy of method calls. By default, Call Stack shows calls in your code, but you can right-click and select Show External Code to see calls to external code such as native functions. Figure 3-12 shows an example based on the application code, with no external code.
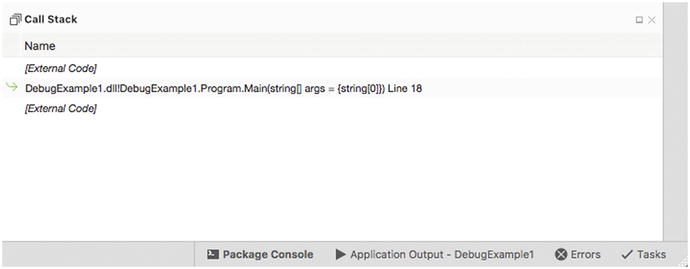
Figure 3-12. The Call Stack pad
You can right-click the view and select a number of options such as Show External Code to visualize calls to native functions, or you can select Columns ➤ Language to see the programming language with which a method was written. Call Stack is particularly useful with exceptions because it helps walk you through the hierarchy of method calls so that you can understand the actual origin for the exception.
The Threads Pad
As you now, any applications can run multiple threads , and this is true for .NET Core and Xamarin applications too. To get a view of running threads, you can open the Threads pad. It shows a list of running threads with summary information such as the thread ID, the name (where available), and a reference to the code that is related to that thread (see Figure 3-13).
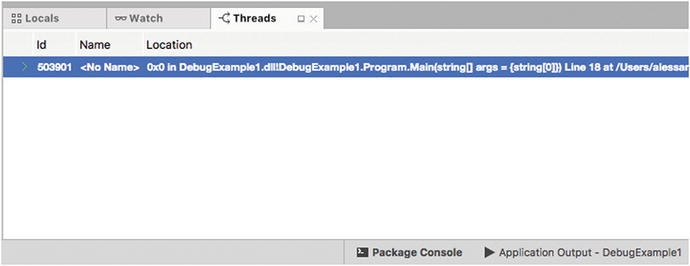
Figure 3-13. The Threads pad
This pad can be useful with multithreaded applications when you need to understand what thread a specific code block is referring to.
Debugging in Code
Both Mono and .NET Core allow interacting with their debuggers via C# code . You can verify variables and expressions in code and make the proper decisions if the application is not working as expected. To accomplish this, you use the Debug class from the System.Diagnostics namespace.
Of course, you also need to select the Debug configuration. Using the class is really simple since you invoke one of the methods it exposes, and the result of the evaluation will be shown in the Application Output pad. For example, the following code waits for the user input from the command line and then displays a formatted string that contains the text entered by the user and its length:
string userInput = Console.ReadLine();Debug.WriteLine($"String {userInput} is {userInput.Length} characters long");
The Application Output pad will display the result shown in Figure 3-14.
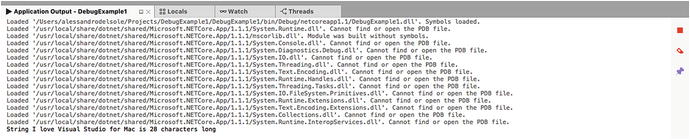
Figure 3-14. The output of the Debug class in the Application Output pad
Table 3-2 summarizes the most common methods from the Debug class.
Table 3-2. Methods Exposed by the Debug Class
Method | Description |
|---|---|
Assert | Checks for a condition and shows a message if the condition fails, including the stacktrace |
Equals | Checks two object instances for equality and returns a Boolean value |
Fail | Generates an error message |
Write | Writes the specified message without a line terminator |
WriteIf | Writes the specified message if a condition is true, without a line terminator |
WriteLine | Same as Write but adds a line terminator |
WriteLineIf | Same as WriteIf but adds a line terminator |
With the Debug class, you can evaluate expressions without using breakpoints, which is useful when you want to investigate the flow of your code without breaking the application execution.
Summary
Debugging is one of the most important tasks for developers, and Visual Studio for Mac simplifies the job. This chapter explained how different debuggers exist for Mono and .NET Core and that Visual Studio for Mac provides unified tools that allow you to interact with both debuggers seamlessly.
In this chapter, you walked through important features such as breakpoints, which allow you to control the execution flow of your code, and commands, which allow you to execute your code step by step. With the help of data visualizers, you can always investigate variables’ contents while debugging. Being the powerful visual tool it is, VS for Mac also ships with a number of pads that are specific for debugging, and in this chapter you saw what pads are available and what you can do with them to analyze your code and your applications’ behavior. Finally, you saw how to use the System.Diagnostics.Debug class to evaluate expressions in C#, without breaking the application execution. By completing this chapter, you now have all the necessary knowledge about working with Visual Studio’s IDE, and now you can finally start putting your hands on some code. Starting in the next chapter, you will learn how to create Xamarin and .NET Core projects to build applications with Visual Studio for Mac.