
Chapter 18
Scalable Vector Graphics (SVG)
WHAT YOU WILL LEARN IN THIS CHAPTER:
- The differences between bitmap and scalable graphics
- Where and why to use SVG
- How SVG works
- Basic SVG drawing: shapes, lines, colors
- Using text in SVG
- Using splines, gradients, and filters
- Generating SVG from XSLT or XQuery
- A high-level view of web apps, SVG animation and scripting, and SVG in the web browser
W3C Scalable Vector Graphics (SVG) is widely used to define pictures and animations and to represent them using XML. SVG pictures can be scaled — that is, you can enlarge them or reduce them to any size without losing quality. The text inside SVG pictures remains editable, so that images made with SVG can be accessible to people with special needs and can be translated to other languages. SVG is also now part of the Open Web Platform introduced with HTML 5, and can be displayed and animated in a web browser. It’s easy to generate SVG with XML tools and easy to manipulate it with JavaScript libraries. SVG is just a bundle of awesome win!
SCALABLE VECTOR GRAPHICS AND BITMAPS
Computer graphics come in two main formats: bitmap graphics and vector graphics. Each of these two formats can work in a way that is either procedural or declarative.
Procedural Graphics
The oldest way to make a computer show a picture is to write a computer program that, when run, produces the desired result. This method is called procedural graphics, because you tell the computer what to do: first this then that, like a “procedure.” You might write code like the following snippet:
1. Pick up the red pen.
2. Move the drawing arm to the middle of the page.
3. Lower the pen until it touches the paper.
4. Move the drawing arm right one inch.
5. Move the drawing arm up one inch.
6. Move the drawing arm left one inch.
7. Move the drawing arm down one inch.
8. Lift the drawing arm.
9. Put down the red pen.
Programs that run code like this are often in FORTRAN and can be very hard to read. If you wanted to take such a program and make it draw a three-inch square you’d need to change lines 4, 5, 6 and 7, and maybe also line 2. It’s hard to see that it draws a square. Worse, by the time you’ve written a program like this in FORTRAN and initialized the device library, it will drive only a single printer (actually a pen-plotter) on a single computer operating system, which is not very portable.
Procedural graphics are still used today for plotting graphs, drawing visualizations of large data sets, and even for computer-generated art such as the popular Mandelbrot set pictures. On the Web, procedural graphics can be used by web browser plugins, or can be written in JavaScript.
When you send someone an image made in a procedural graphics format, you are sending them a computer program. Exchanging programs over an untrusted network provides a potential security risk of viruses, and that, combined with the difficulty of maintaining them, has made procedural graphics less common than they once were.
Declarative Graphics
Procedural graphics can be contrasted with declarative graphics. Where procedural graphics say how to draw something without ever having to say what is being drawn, declarative graphics say what to draw and leave the computer to work out how to draw it. In a declarative format you might make a picture with a square in it with something like this:
let s be a square 1 inch × 1 inch at position (1,1)
This is a much shorter description and is easier to understand. It would be easy in this format to write a program to find all the images that contain squares, although still difficult to find all the pictures of houses that were drawn using squares and triangles.
SVG, like most things in the XML world, is a declarative graphics format. As you’ll learn in the “SVG Definitions and Metadata” section later in this chapter, it also has a way to say “this is a picture of a house” using RDF.
Why talk about procedural graphics at all then? Partly to show how much better SVG is, of course, but also so that you can see how this approach can be combined with SVG’s declarative approach. Procedural graphics are also used with the HTML 5 <canvas> element, as mentioned in Chapter 17, “XHTML and HTML 5.” Let’s put procedural graphics aside for a moment and look at the second way that computers work with pictures.
Bitmap Graphics
Bitmap graphics, also called raster images, are made up of an array of “picture elements,” or pixels. Each pixel is actually just a color value at a particular location, and the whole image is a huge grid of values. Figure 18-1 shows a bitmap graphic that’s a picture of a castle, along with an enlargement of part of the castle spire, and a further enlargement showing how the image is made up of rectangles.
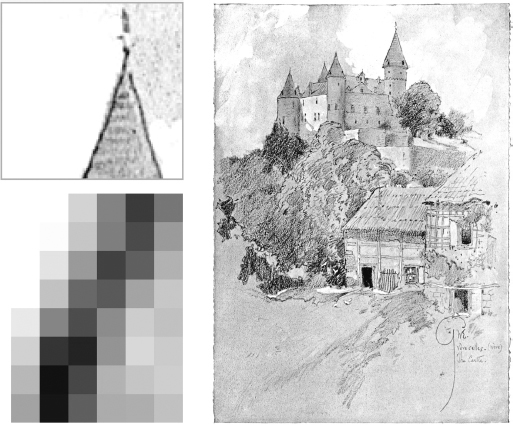
When a bitmap image is enlarged, it becomes pixelated, meaning that you can see the individual pixels. This is because the computer can’t invent more detail to fill in the gaps between the centers of the pixels, and as the pixels are moved wider apart to make the image larger, that space eventually becomes large enough to be visible.
The computer can do much better than the example in Figure 18-1: it can guess values between the pixels of the original image, a process known as interpolation. However, even this process doesn’t really add detail. You could include the additional detail in the image, but then the image files quickly get large; a modern digital camera makes bitmap images that are 30 to 100 megabytes in size, and images from a flatbed scanner can easily be more than a gigabyte.
The advantages of bitmap images are the photographic image quality and detail possible at the intended size, the simple data format that is not normally a host to viruses, near-universal portability for the most common bitmap image formats, and widespread availability of tools to process the images.
The obvious disadvantages of bitmap images are the size of the files and the fact you can’t enlarge them very well. A less obvious disadvantage is that bitmap image formats usually do not allow the image to contain text, but only pictures of text. If you photograph a road sign, you capture the words on the sign, but extracting those words involves using optical character recognition, which is an unreliable process. Worse, someone blind obviously cannot see the image, and therefore cannot read the text. In the next section you’ll find out how vector-based images can help with that problem too.
Vector Images
The third of the most common ways to represent images in a computer is using vectors. A vector is a mathematical name for a straight line, but modern vector images are made up not only of straight lines but also of curves and text. Vector images can be scaled to any size. A diagonal line will be drawn as a diagonal line however you look at it. Although the image still doesn’t invent more detail as you zoom in, the quality of what’s there doesn’t degrade. File sizes are also usually very small.
Vector images are best suited for diagrams, logos, buttons, and other user-interface controls, and any other application where the overall effect is designed rather than photographed. Bitmaps are still better for photographs or other highly detailed and irregular images such as scans of oil paintings.
Most modern font formats, including OpenType, TrueType, PostScript Type 1, and Graphite, are also vector-based, which is why you can change font sizes in a word processor and still have good-looking text.
Text in most vector-image formats generally remains as text, and can be extracted and even replaced. This also means that a text reader being used by someone blind could read out the text contained in the image, something not possible with a bitmap image.
SVG Images
With W3C’s SVG format you can have the best of all three worlds. SVG is a vector-based scalable format, as the name “Scalable Vector Graphics” implies; SVG images can also include bitmap images. You can create SVG easily, either in XML or using the document object model (the DOM) that you read about in Chapter 7, “Extracting Data from XML,” and you learn more about that in this chapter. SVG is a declarative, not procedural, image format: instead of saying “next draw a circle” you say “there’s a circle here.” This makes it possible to process SVG images with XSLT, for example to replace text or to move objects around.
In the following activity you first look at a simple SVG image and then move on to learn about how SVG works in more detail.
 <?xml version=”1.0” encoding=”UTF-8” ?>
<svg version=”1.0” xmlns=”http://www.w3.org/2000/svg”>
<circle cx=”100” cy=”100” r=”75”
fill=”#b0b0b0” stroke=”#FF0000” stroke-width=”1pt” />
</svg>
 <?xml version=”1.0” encoding=”UTF-8” ?>
<svg version=”1.0” xmlns=”http://www.w3.org/2000/svg”>
   <circle cx=”100” cy=”100” r=”75”
     fill=”#b0b0b0” stroke=”#FF0000” stroke-width=”1pt” />
</svg>
simple.svg
xmllint --noout yourfile.svg
THE SVG GRAPHICS MODEL
SVG graphics are said to be painted onto a canvas. The “paint,” like the “canvas,” is usually opaque, but can also be partially or entirely transparent. However, there’s no way to remove things that have been drawn. You can draw over things and hide them, but you can’t scratch a hole through something you have drawn and see what was underneath.
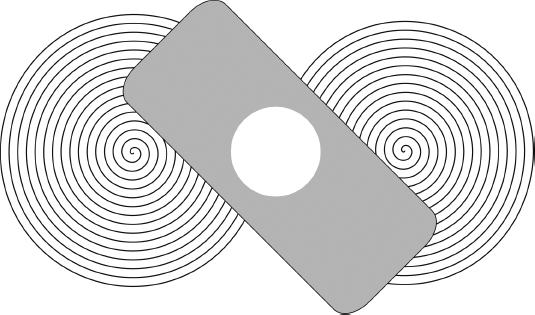
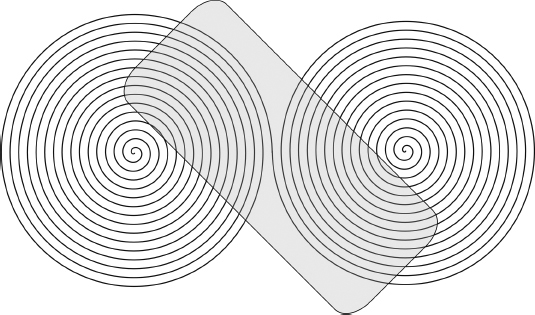
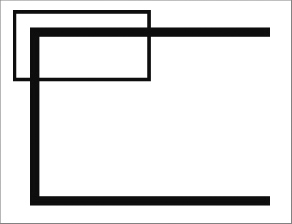
An apparent exception is that you can use SVG animation to change the opacity of objects after they’ve been drawn, making them transparent, and the drawing changes as if those objects were always transparent. Figure 18-3 shows a double-path spiral with a gray rectangle painted on top of it and then a white circle added; the spiral had already been painted over and cannot be seen through the white circle. If you paint a hole in a wall it can look good but you can’t crawl through it! If you use scripting, such as JavaScript within a web browser, you can also set <clipPath> on an object to cause only parts of it to be visible, and whatever was painted underneath the newly-invisible parts of the object will then be shown. But if you are using scripting you could also change the object’s shape, and build a wall with an arched gateway in it.
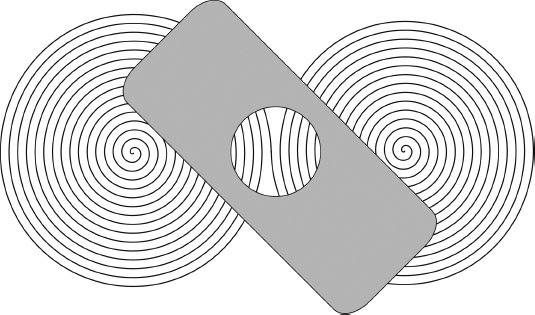
If you did want to see the spiral through a hole in the rectangle you’d need to plan for it, for example by making a single combined shape of a rectangle with a circular hole in it; Figure 18-4 shows the result.
You could also go back and change the opacity of the rectangle; Figure 18-5 shows what this might look like, even if the change was made after the rectangle had already been painted as opaque. You might just make this change in an editor, or you might be using JavaScript in a web browser.
The SVG model is very close to the older Adobe PostScript graphics model, except that PostScript did not have opacity and was procedural.
You can already see that making complex drawings with SVG can require careful thought. If that’s not your style, don’t panic: after reviewing the way SVG works with CSS, you learn about some tools that handle a lot of the SVG for you automatically and reduce the need for careful planning.
SVG AND CSS
If you worked your way through Chapter 17 you have already seen cascading style sheets (CSS). If you don’t know about CSS you should review that chapter now.
SVG uses CSS properties to style objects. In the example in the previous Try It Out, you saw the following <circle> element:
   <circle cx=”100” cy=”100” r=”75”
     fill=”#b0b0b0” stroke=”#FF0000” stroke-width=”1pt” />
The fill, stroke, and stroke-width attributes are names of CSS-like properties defined by SVG. You can also use them with a style attribute like so:
  <circle cx=”100” cy=”100” r=”75”
     style=”fill: #b0b0b0; stroke: #FF0000; stroke-width: 1pt;” />
The two forms are interchangeable except when it comes to animation. It is not a good idea to use both the CSS style attribute and individual XML attributes for the same property. The SVG renderer might know what to do with it, since the CSS properties always take precedence over the attributes, but it’s all too easy to change one and not the other.
You can use the class attribute in SVG just as you can in HTML, and even style your SVG with an external style sheet.
Table 18-1 lists some of the CSS properties that apply to most SVG objects. You can use many other CSS properties with SVG; they are defined both in the SVG specification (http://www.w3.org/TR/SVG11/) and the CSS specification (http://www.w3.org/TR/CSS21/).
TABLE 18-1: Some CSS Properties Commonly used with SVG Objects
| PROPERTY | DESCRIPTION |
| color | SVG interprets this CSS property to apply to fill, stroke, and other properties if you don’t override it. |
| fill | The value of this property determines the color of the inside of an object. Use none if you don’t want the object filled at all. |
| fill-opacity | Determines whether the fill color is solid or transparent. Use 1 for opaque, 0 for transparent, 0.5 for halfway, or any number between. |
| font | A shortcut property for font-style, font-variant, font-weight, font-size, line-height, font-family, for example: font=”italic small-caps bold 16pt/18pt Caslon”. See the section “SVG Text and Fonts” later in this chapter. |
| kerning | A value of auto enables pair kerning, and a length disables pair kerning and enables letter spacing. To get both you can use kerning and letter-spacing together. The kerning property is a CSS3 feature. |
| letter-spacing | Takes a length, such as 1px, 0.04em, or 1cm, and adds that much space between letters; if pair kerning is enabled the actual space is also affected by the font’s built-in kern pairs. |
| opacity | A value of zero means totally transparent and a value of one means that the object is opaque and completely covers up whatever was previously drawn. Use fill-opacity and stroke-opacity to specify them separately. |
| stroke | Specifies the color used to draw along a given path, such as the outline of a circle or rectangle; overrides the color property. |
| stroke-dasharray | Contains a space-separated list of numbers for making dashed lines. The first number is the length of a dash, the next the length of a gap, then the length of the next dash, and so on. Always supply an even number of values. The SVG renderer starts again at the beginning of the array if it runs out of values. |
| stroke-opacity | Like fill-opacity except for the outline of the shape or path rather than the inside. |
| stroke-width | The width of the line when a path is drawn (stroked); a value of zero turns off the stroking of the outline. |
| transform | See the section “SVG Transforms and Groups” later in this chapter. |
| word-spacing | Can be normal or a length to be added to the default; a negative value reduces the space between words. |
SVG TOOLS
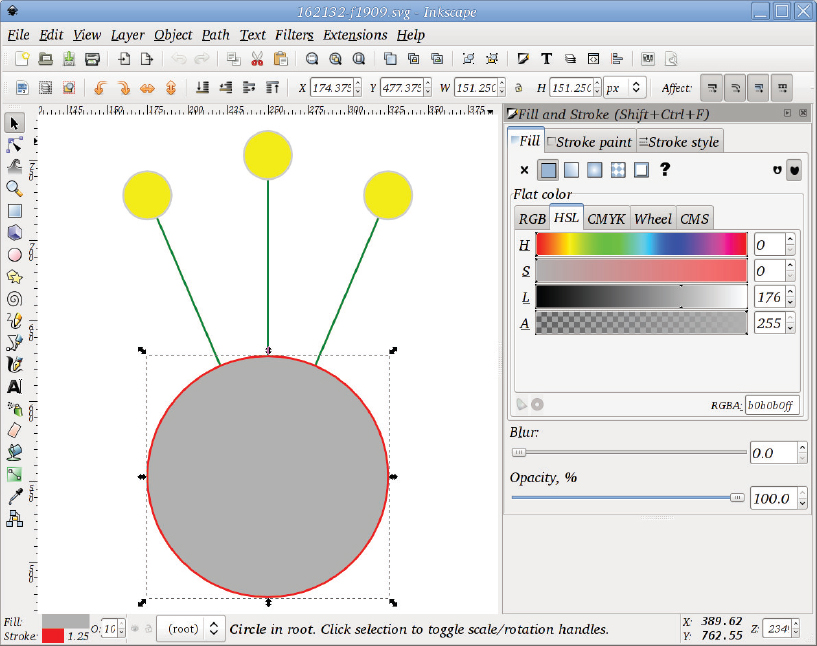
SVG is widely used today. Web browsers display SVG natively, and SVG is now part of HTML 5. Many desktop and mobile environments, and even camera menu user interfaces, are defined using SVG. Displaying SVG documents is easy, but you still need to know how to make them and edit them. In this section you look at one of the most widely used SVG editors, Inkscape. Later in this chapter you’ll see various ways to create SVG graphics using programs and scripts.
Some widely used commercial vector graphics editors support import and export of SVG, including Adobe Illustrator and Corel Draw. This activity looks at Inkscape, an open source editor and viewer whose primary format is SVG-based. Even if you use other programs for most of your work, knowledge of Inkscape can help you to test for portability and can help with development; it’s also cross-platform.
Figure 18-6 shows Inkscape with the sample file after adding three more circles and some straight lines. (It’s a cubist flower in a pot.) Notice that you can move objects to the back or front with the page up/page down keys on the keyboard, or using the Layer menu, so that the ends of the lines are hidden behind the circles.
SVG BASIC BUILT-IN SHAPES
SVG defines a number of basic shapes and then provides a more general path facility so you can make shapes of your own.
The different predefined shapes are described in the following sections, along with the more general construction, SVG paths, and Listing 18-1 shows you some examples:
![]() LISTING 18-1: shapes.svg
LISTING 18-1: shapes.svg
<?xml version=”1.0” encoding=”UTF-8” ?>
<svg version=”1.0” width=”745” height=”1053”
   xmlns=”http://www.w3.org/2000/svg”>
    <path d=”m 250,500 -75,-175”
       stroke=”green” stroke-width=”1pt” />
    <path d=”m 250,500 75,-175”
       stroke=”green” stroke-width=”1pt” />
    <path d=”m 250,500 0,-200”
       stroke=”green” stroke-width=”1pt” />
   <!--∗ the plant pot ∗-->
   <circle cx=”250” cy=”500” r=”75”
     fill=”#b0b0b0” stroke=”#FF0000” stroke-width=”1pt” />
   <circle cx=”175” cy=”325” r=”15”
     fill=”yellow” stroke=”#CCCCCC” stroke-width=”1pt” />
   <circle cx=”250” cy=”300” r=”15”
     fill=”yellow” stroke=”#CCCCCC” stroke-width=”1pt” />
   <circle cx=”325” cy=”325” r=”15”
     fill=”yellow” stroke=”#CCCCCC” stroke-width=”1pt” />
</svg>
Rectangles
The SVG <rect> element defines a rectangle; the specific attributes are:
- x, y: Defines the top-left corner of the rectangle.
- width, height: Defines the size of the rectangle.
- rx, ry: Radius of corners (default is zero, giving sharp corners).
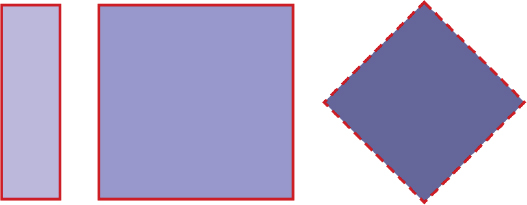
The standard attributes such as stroke-width, stroke, and fill all apply, of course, both to the <rect> element and to all the other shapes. Listing 18-2 shows some example of rectangles, including one that has been rotated. The result is shown in Figure 18-7.
LISTING 18-2: shapes-rect.svg
<?xml version=”1.0” encoding=”UTF-8” ?>
<svg version=”1.0” width=”745” height=”1053”
   xmlns=”http://www.w3.org/2000/svg”>

   <rect x=”10” y=”10” width=”30” height=”100”
     fill=”#BBBBFF” stroke=”#CC0000” stroke-width=”1pt” />
   <rect x=”60” y=”10” width=”100” height=”100”
     fill=”#9999CC” stroke=”#CC0000” stroke-width=”1pt” />

   <rect x=”167” y=”-155” width=”73” height=”73”
     transform=”rotate(45)”
     fill=”#666699” stroke=”#CC0000” stroke-width=”1pt”
     stroke-dasharray=”5 3” />
</svg>
Circles
The <circle> element uses a center and a radius; if you want to make a circle that touches a line you’ll need to use trigonometry, or use a visual program like Inkscape and zoom in a lot! The attributes for circles are:
- cx, c: Defines the center of the circle.
- r: The radius of the circle (the distance from the middle to the outside).
Ellipses
Ellipses are squashed circles. You can use the <ellipse> element to make both ellipses and circles, but <circle> is more convenient for circles and also gets across the higher-level idea that you want a circle.
Ellipses get the following extra attributes:
- cx, cy: Defines the center of the ellipse.
- rx, ry: The x-axis and y-axis radius of the ellipse; an ellipse here is modeled as having a center rather than having two focal points.
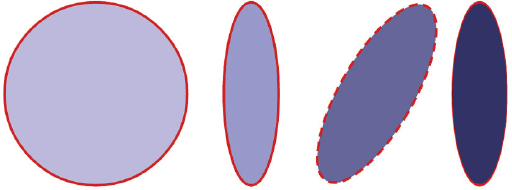
Listing 18-3 shows some circles and ellipses, and Figure 18-8 shows the result.
LISTING 18-3: shapes-circles.svg
<?xml version=”1.0” encoding=”UTF-8” ?>
<svg version=”1.0” width=”745” height=”1053”
   xmlns=”http://www.w3.org/2000/svg”>

   <circle cx=”60” cy=”60” r=”50”
     fill=”#BBBBFF” stroke=”#CC0000” stroke-width=”1pt” />

   <ellipse cx=”145” cy=”60” rx=”15” ry=”50”
     fill=”#9999CC” stroke=”#CC0000” stroke-width=”1pt” />

   <ellipse cx=”215” cy=”-55” rx=”20” ry=”55”
     transform=”rotate(30)”
     fill=”#666699”
     stroke=”#CC0000” stroke-width=”1pt”
     stroke-dasharray=”5 3” />

   <circle cx=”900” cy=”60” r=”50”
     fill=”#333366” stroke=”#CC0000” stroke-width=”1pt”
     transform=”scale(0.3, 1)”
     />
</svg>
Straight Lines
Use the <line> element to draw a single straight line in any direction. Its attributes are:
- x1, y1: The first end of the line.
- x2, y2: The second end of the line.
Lines don’t have an inside, so you can’t fill them. You can’t make filled shapes with <line> either — use <polygon> instead.
Polylines and Polygons
Use the SVG <polyline> and <polygon> elements to make shapes out of straight lines; the only difference between the two is that the <polygon> element quietly adds an extra line segment joining the first and last point you give it.
These two elements take the extra attribute points, which is a list of x, y pairs making up the points on the line. The pairs are separated by spaces: points=”100,100 100,200 200,200 200,100” draws three lines with <polyline> and a complete square with <polygon>, because the polygon has an extra line from the start point to the end point.
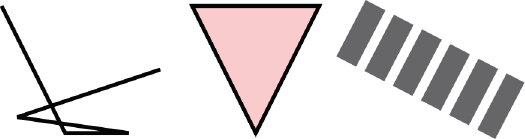
A <polyline> with two points is the same as a <line>. Listing 18-4 shows a polyline, a filled polygon and a straight line that’s dashed and wide, and Figure 18-9 shows the result. Notice how it’s much harder to work out that the polygon is a pink triangle than it was to understand the shape of a rect or circle element. It’s almost always easier to use the specific elements for shapes when they are available.
![]() LISTING 18-4: shapes-polylines.svg
LISTING 18-4: shapes-polylines.svg
<?xml version=”1.0” encoding=”UTF-8” ?>
<svg version=”1.0” width=”1925” height=”70”
   xmlns=”http://www.w3.org/2000/svg”>

   <polyline points=”10,10 30,50 50,50 15,45 60,30”
     fill=”none” stroke=”#000000” stroke-width=”1pt” />

   <polygon points=”70,10 90,50 110,10”
     stroke=”#000000” stroke-width=”1pt” fill=”#FFCCCC” />

   <line x1=”120” y1=”17” x2=”170” y2=”43”
     stroke=”#666666” stroke-width=”20”
     stroke-dasharray=”7 3” />
</svg>
SVG Paths
A path in SVG (as in the older PostScript language) is the most general shape: you can make all the other shapes from paths, and all the other shapes are defined in terms of paths. A path is a sequence of nodes with connecting lines between them. The connecting lines can be curved or straight.
At the beginning of this chapter you read about procedural graphics using a pen-plotter as an example; SVG paths are a bit like using a pen-plotter with a simple set of commands. In the case of SVG paths the commands are each one character long, and are shown in Table 18-2, along with longer names to help you remember the letters. In the table only the uppercase version of each command is given; the corresponding lowercase letter gives a “relative” version of the command. For example, if the current point is (30, 30), L 45 20 is the same as l 15 -10. In most cases you can supply additional points; for moveto or lineto the extra points draw straight line segments, and for Bézier curves the extra points add more curves.
TABLE 18-2: SVG Path Commands
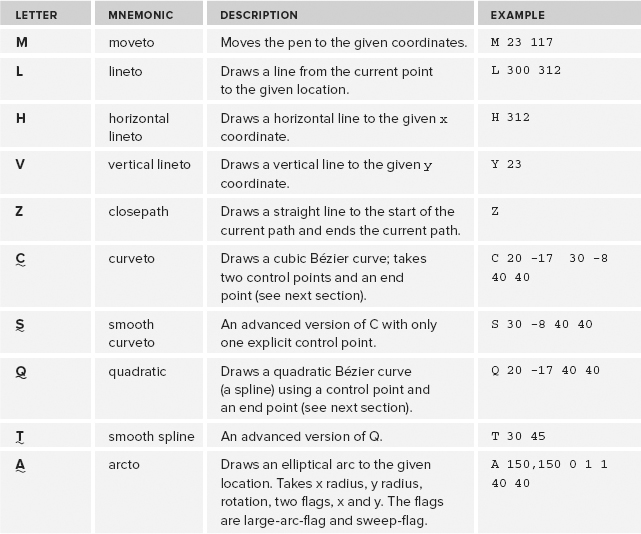
The SVG <path> element has a d attribute that takes a space-separated list of the one-letter drawing commands listed in Table 18-2. This terse syntax was used for efficiency. Listing 18-5 shows two examples, one unclosed (open) and one closed (with a z to close the path). The rectangle in the listing is there so that you can see the single path is actually made up of two subpaths, making a hole in the middle so the filled rectangle shows through. If you look carefully you can find the z that ends the first path followed by the m that starts the next one. The command letters have been highlighted to make them easier to find in the listing. The result is shown in Figure 18-10.

![]() LISTING 18-5: shapes-curves.svg
LISTING 18-5: shapes-curves.svg
<?xml version=”1.0” encoding=”UTF-8”?>
<svg xmlns=”http://www.w3.org/2000/svg” version=”1.0” width=”165” height=”75”>
  <rect width=”154” height=”62” x=”5” y=”5” fill=”#6588b1” />

  <path
    d=”M 10,10 C 10,27 48,60 58,60 68,60 70,44 45.5,27 45,10 87,10 87,10”
    style=”fill:none;stroke:#000000;stroke-width:1pt” />

  <path
    d=”m 129.5,9.2
    c -3.4,0.1 -5.1,0.9 -6.2,6.1 -1.3,5.8 3.9,17.0 3.9,17.0 0,0 -6.2,0.6 -9.5,0
    C 114.3,31.8 114.3,31.5 114.3,31.5 l 1.9,5.2 -2.2,3.2 c 0,0 5.9,-0.6
    6.8,-0.6 0.9,0 3.5,0.0 6.3,0.1 0,5.4 -1.7,22.1 -1.7,22.1 0,0 2.8,-2.4
    5.5,-2.4 2.7,0 5.5,2.4 5.5,2.4 0,0 -1.7,-16.7 -1.7,-22.1 2.7,-0.1 5.3,-0.1
    6.3,-0.1 0.9,0 6.8,0.6 6.8,0.6 l -2.2,-3.2 1.9,-5.2 c 0,0 -0.0,0.3 -3.2,0.9
    -3.2,0.6 -9.5,0 -9.5,0 0,0 5.2,-11.1 3.9,-17.0 -1.3,-5.8 -3.2,-6.1
    -7.8,-6.1 -0.5,0 -1.0,-0.0 -1.5,0 z m 1.5,2.8 c 1.4,0.0 2.4,0.3 3.8,1.3
    2.1,4.7 0.5,9.4 -1.9,13.5 -0.6,0.9 -1.2,1.8 -1.9,2.7 -0.6,-0.9 -1.3,-1.8
    -1.9,-2.7 -2.4,-4.0 -4.0,-8.7 -1.9,-13.5 0.6,-0.7 2.8,-1.3 3.8,-1.3
    z”
    fill=”#b5b5b5” stroke=”#000000” stroke-width=”1” />
</svg>
Path Segments: Splines
Splines are smooth curves that go through nodes and have control points. The control points determine the shape of the curve. An example is shown in Figure 18-11. The nodes are the dots on the curve; the thinner straight lines join up the nodes with the control points so you can see where the control points are.
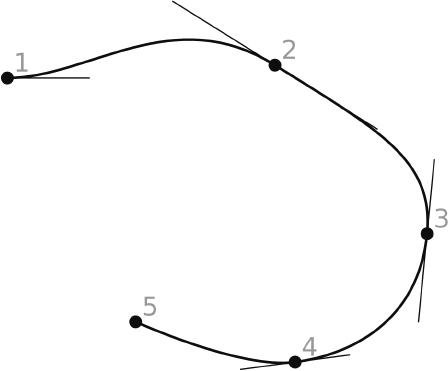
You could think of splines as a way to control a racing car; the car must drive through each of the nodes, and its speed and direction when it enters or leaves each node is determined by the direction and length of the “handles” drawn from the nodes to the two control points.
SVG uses Bézier curves for its splines. An important property of Bézier curves is that the curve always goes through the end points (the nodes) on the curve, which makes them easy to work with.
Path Segments: Arcs
The SVG path’s A (arcto) command takes a bewildering number of parameters. The arc starts at the current point in the path and ends at the x, y coordinates you supply. Because it’s actually an arc of an ellipse, not just of a circle, it takes two numbers for radius (rx and ry). The ellipse from which the arc is taken could be horizontal or it could be rotated, so there’s an angle parameter, x-axis-rotation. It then has two “flags” that can each have the value 0 or 1 for false and true, respectively. Figure 18-12, taken from the SVG specification at http://www.w3.org/TR/, shows the effect of the two flags, given the following path:
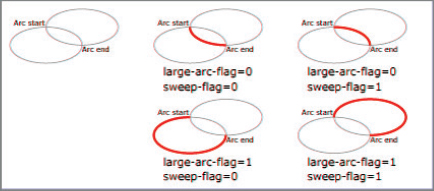
<path d=”M 125,75 a100,50 0 ?,? 100,50”
      style=”fill:none; stroke:red; stroke-width:6”/>
Here the ?,? is replaced by 0,0, 0,1, 1,0, and 1,1 in turn, to generate the four possible cases.
As you can see, SVG provides a number of built-in shapes, including lines, circles, ellipses, squares and rectangles, polygons and polylines; these are defined in terms of SVG paths. It’s usually easier for programs to work with paths everywhere, but it’s easier for us humans to use the higher-level shapes.
SVG TRANSFORMS AND GROUPS
Transforms provide a way to take a shape or path and move it, squeeze it, rotate it, change its size, or even flip it over. Under the hood, transforms use a piece of mathematics called a transformation matrix to do this.
Groups are a way of combining several smaller objects into one larger one; you can then apply a transformation to a whole group and affect all the objects inside it at once.
Transforms
In SVG (as in PostScript and PDF) every object is affected by at least one transformation matrix. If your mathematics skills never reached the dizzying heights of matrix multiplication and the very mention of a matrix makes you think of a movie, don’t panic — it’s actually very easy once you get past the jargon and the weird notation. Every number, such as a width or a point on a line, is multiplied by the transformation matrix to get a new number that’s actually used.
Because computer graphics like SVG are often both generated and manipulated by computer programs, the people who created SVG wanted the language to be as regular as possible. Transformations apply to any object or (as you’ll soon see) any group of objects in exactly the same way. More precisely, it’s not the object itself that’s transformed but the whole coordinate system. It’s as if the object were drawn on a separate sheet of paper, and that entire sheet of paper were first moved, then pinned to the drawing at one corner and rotated, stretched, and maybe skewed.
Figure 18-7 earlier in this chapter included an example of a diamond shape made by rotating a rectangle:
<rect x=”167” y=”-155” width=”73” height=”73” transform=”rotate(45)” />
Most SVG elements have a transform attribute. You can put any of the following transform functions into the attribute; if you want to use more than one, separate them with a space, like this:
<rect x=”167” y=”-155” width=”73” height=”73” transform=”rotate(45) scale(0.5, 0.5)” />
- translate(tx [ty]): Move the whole sheet of paper.
- scale(sx sy): Make the paper (and everything drawn on it) larger or smaller.
- rotate(angle [cx cy]): Turn (rotate) the paper using its top-left corner as the center.
- skewX(angle), skewY(angle): You can’t actually do this one to paper; every analogy has its limits! Skewing is when you push just the top of a rectangle to one side to make it into a lozenge shape.
- matrix(a b c d e f): Set the transformation matrix. See http://www.w3.org/TR/2011/REC-SVG11-20110816/coords.html#TransformAttribute.
Groups
Very often you want to transform several objects together; to do this you group them in a <g> element. This element takes transform and style attributes. Groups can contain any mixture of <g> elements and SVG shapes and paths.
Groups are also used with an id attribute so that you can animate them or make an entire group visible or invisible.
SVG DEFINITIONS AND METADATA
So far the SVG examples in this chapter have been very minimal, but in practice you’ll very quickly need to know more about how SVG files work, especially if you look at images that other people have made, or at files that Inkscape or other programs create. In this section you learn about the structure of an SVG document, including the various XML elements beyond the shapes you have already seen, and you’ll also learn a little about the way that definitions and metadata interact.
The SVG <title> and <desc> Elements
SVG documents, like the HTML documents that you saw in Chapter 17, usually use <title> and <desc> elements. There is also a <metadata> element that conventionally contains RDF information about the document, the document’s author, and/or whatever might be depicted.
The <title> element can go at the start of the document as well as inside any “container” element such as <circle>. It must always be the first child of its parent, though. A user agent such as a web browser may well show tooltip messages when the mouse pointer hovers over elements containing a <title>, just as HTML browsers do for a title attribute. The use of an element rather than an attribute is appropriate for new vocabularies: the designers of HTML were forced to use attributes because of HTML’s poor extensibility design, but the SVG designers built the <title> element in early on.
Because <title> is an element, it can have an xml:lang attribute to indicate the natural language of its content. However, although this may imply that you could have multiple <title> elements with different languages, the SVG specification mandates that user agents use only the first <title> element. The outermost <title> element should describe the whole document, and should stand alone, rather like the <title> element of an HTML document. Titles within the SVG document obviously can assume the reader has more context, and can be terser.
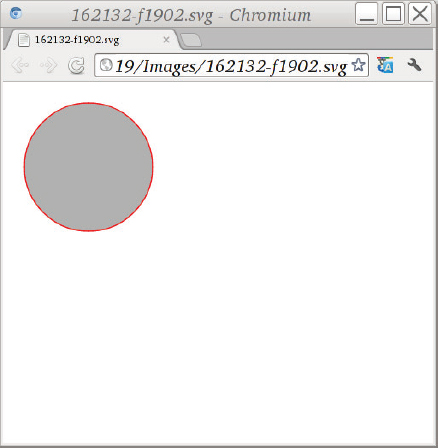
The <desc> element is similar to <title> in that you would use it to give a description of the document or any subelement, but <desc> is meant for longer descriptions and is not usually rendered. It might be used to provide a description of an image to someone who can’t see a screen, or by a web search engine. Listing 18-6 has a title for the overall drawing and also a title and <desc> element for the “roundabout.” Hovering the mouse pointer over the circle makes (for example) the Chrome Web browser display a tooltip saying “This is where Dougal was seen.”
![]() LISTING 18-6: dougal.svg
LISTING 18-6: dougal.svg
<?xml version=”1.0” encoding=”UTF-8” ?>
<svg version=”1.0” xmlns=”http://www.w3.org/2000/svg”>
  <title xml:lang=”en”>Diagram of the M25 roundabout at St Alban's</title>
   <circle cx=”100” cy=”100” r=”75” fill=”#b0b0b0” stroke=”#FF0000”
        stroke-width=”1pt”>
     <title>This is where Dougal was seen.</title>
     <desc>The roundabout is just shown as a circle.
       Mr. McHenry said he saw Dougal here with the missing sugar,
       but the picture just shows a grey circle with a red border.
     </desc>
   </circle>
</svg>
The SVG <metadata> Element
You use the <metadata> element to give extra information about a drawing. Unlike the human-readable content of the <title> and <desc> elements, however, <metadata> is intended for machine-readable information. It is often used with RDF to try to indicate the subject matter of the image, and also to identify the author using Dublin Core meta data. Listing 18-7 helps you relate this to what you learned in that chapter:
![]() LISTING 18-7: rdf-inside.svg
LISTING 18-7: rdf-inside.svg
<?xml version=”1.0” encoding=”UTF-8” ?>
<svg version=”1.1” xmlns=”http://www.w3.org/2000/svg”
    xmlns:rdf = “http://www.w3.org/1999/02/22-rdf-syntax-ns#”
    xmlns:rdfs = “http://www.w3.org/2000/01/rdf-schema#”
    xmlns:dc = “http://purl.org/dc/elements/1.1/” >
  >
  <title xml:lang=”en”>Diagram of the M25 roundabout at St Alban's</title>
  <metadata>
    <rdf:RDF>
      <rdf:Description about=”http://example.org/dougal.svg”
        dc:title=”Diagram of the M25 roundabout at St Alban's”
        dc:date=”2014-04-11”
        dc:description=”Evidence for a criminal investigation of Dougal”
        dc:publisher=”Hoy Books Ltd.”
        dc:format=”image/svg+xml”
        dc:language=”en” >
        <dc:creator>
          <rdf:Bag>
            <rdf:li>Liam Quin</rdf:li>
            <rdf:li>Dougal</rdf:li>
          </rdf:Bag>
        </dc:creator>
      </rdf:Description>
    </rdf:RDF>
  </metadata>
  <circle cx=”100” cy=”100” r=”75” fill=”#b0b0b0” stroke=”#FF0000” stroke-width=”1pt”>
    <title>This is where Dougal was seen.</title>
  </circle>
</svg>
The SVG <defs> Element and Reusable Content
SVG documents can contain a <defs> element near the start, right after the optional <title>, <desc>, and <metadata> elements. Things you put inside the <defs> element won’t be rendered, but you can refer to them as many times you like with a <use> element in the body of your SVG document, and then of course they do get shown. The <defs> element is also the way that you use SVG fonts and gradients. Listing 18-8 shows an example. The <circle> element is defined in the definitions section (the <defs> element) and is later used by a <use> element. Notice how the <use> element also defines the stroke width and adds a title. You can’t override attributes using <use>, so if the <circle> already had a stroke-width attribute, that would take precedence.
You can also put a <defs> element inside a group (the <g> element), again after any <title> and <desc> elements.
![]() LISTING 18-8: defs-and-use.svg
LISTING 18-8: defs-and-use.svg
<?xml version=”1.0” encoding=”UTF-8” ?>
<svg version=”1.0” xmlns=”http://www.w3.org/2000/svg”
  width=”200” height=”200”
  xmlns:xlink=”http://www.w3.org/1999/xlink”>
  <title xml:lang=”en”>Diagram of the M25 roundabout at St Alban's</title>
  <defs>
    <circle id=”magic” cx=”100” cy=”100” r=”75” fill=”#b0b0b0” stroke=”#FF0000” />
  </defs>
  <use xlink:href=”#magic” stroke-width=”12pt”>
    <title>This is where Dougal was seen.</title>
  </use>
</svg>
VIEWPORTS AND COORDINATES
SVG graphics are rendered onto a virtual piece of paper called a canvas. Although the size of this canvas has no fixed limits, there is also a rectangular viewing area called the viewport. You can use width and height attributes on the <svg> element to define the size of the initial viewport; these are CSS values so you can use units like in for inches or px for pixels.
Because you give x and y locations for SVG objects like rectangles, there has to be a definition for where (0, 0) lies; it’s at the top-left corner of the viewport, unless you have transformed the coordinate system to move it. The bottom-right corner of the viewport corresponds to the position defined by the width and height attributes on the SVG element, or on the viewport. The SVG renderer might well scale the image to fit inside a user’s window, or on a sheet of physical paper, so a rectangle with a width of 3in in the SVG will end up sized proportionally. If you said your image was six inches wide, the rectangle would be half as wide as the viewport, even if the viewport was only five inches wide on a user’s screen, or was ten meters wide on a billboard. This goes back to the scalable part of Scalable Vector Graphics!
You can establish a new coordinate system, relative to the one in effect at the time, using a <g> element with a transform attribute. Then all the objects inside the <g> element are drawn relative to that new coordinate system. For example, the following code generates the image shown in Figure 18-13:
<?xml version=”1.0” encoding=”UTF-8” ?>
<svg version=”1.0” xmlns=”http://www.w3.org/2000/svg”
  xmlns:xlink=”http://www.w3.org/1999/xlink”
  width=”200px” height=”300px”>
  <title>Demonstration of SVG coordinates</title>
  <rect x=”10” y=”10” width=”100” height=”50”
    stroke=”#000000” stroke-width=”2pt” fill=”none” />
  <g transform=”scale(2.5)”>
    <rect x=”10” y=”10” width=”100” height=”50”
      stroke=”#000000” stroke-width=”2pt” fill=”none” />
  </g>
</svg>
Notice how the larger rectangle is not all visible because it goes outside the viewport. Notice also how the same rectangle definition is rendered larger inside the <g> element because of the transformation.
It doesn’t really matter whether you think in terms of coordinate systems and transformations or whether you look at groups as being able to transform what’s inside them, but it’s useful to understand both ways of looking at it so you can work with other descriptions of SVG and with tools that might favor one approach over the other.
The <svg>, <symbol>, <image> and <foreignObject> SVG elements can be included within your graphics — including <svg> elements inside <svg> elements — and they each establish new viewports. The <symbol> element is just here for completeness; you use <image> to include bitmap images (see the section Including Bitmap Images), and you can use <foreignObject> to include other markup such as HTML 5 or MathML inside your images, as described in the section SVG and HTML 5.
SVG COLORS AND GRADIENTS
If you are reading the print version of this book you’ll probably find that all the examples in this chapter are in black and white. Even the gray parts, as you’ve already learned, are made up of tiny black dots.
Color in graphics, whether for fine art, graphic design, or commercial job-printing, is a very complex subject with many more facets than one might expect. Color perception also varies greatly between individuals: biological factors can affect the way our eyes and brains perceive colors; and instinctual, cultural, and emotional associations can give different meanings to color, such as blue for distant objects (instinctual) and red for happiness and good fortune (cultural, emotional). Technical factors, such as limitations on the total amount of ink a commercial printing machine can place at any one point on a page, can also affect how colors appear in print.
SVG colors, then, are like CSS colors that you learned about in Chapter 17. You specify them as three two-digit hexadecimal numbers squished together into a single string, such as #1122CC, where 11 indicates the red component, CC the green, and 33 the blue.
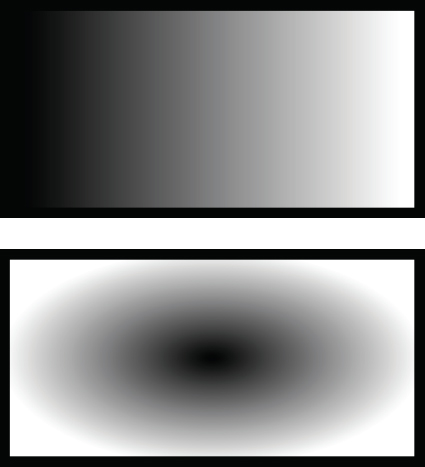
A gradient is a variation of color over distance, such as a rectangle painted dark at one end and light at the other. SVG has two kinds of gradients built in: linear and radial. Figure 18-14 shows first a linear and then a radial gradient, made with the following SVG code. Notice that the gradients are defined inside a <defs> element and are given id attributes, which are then used with the url() syntax in the fill attribute. You can define any number of stops as long as the positions increase each way: you can’t go backward and define a stop color at 100 percent of the way along and then have one at 75 percent of the way or it won’t work. Listing 18-9 shows how to mark up gradients in SVG, and Figure 18-14 shows the result.
![]() LISTING 18-9: gradients.svg
LISTING 18-9: gradients.svg
<?xml version=”1.0” encoding=”UTF-8” ?>
<svg version=”1.0” xmlns=”http://www.w3.org/2000/svg”
  xmlns:xlink=”http://www.w3.org/1999/xlink”
  width=”120px” height=”140px”>
  <title>SVG Gradients</title>
  <defs>
    <linearGradient id=”leonard”>
      <stop offset=”5%” stop-color=”#000000” />
      <stop offset=”95%” stop-color=”#FFFFFF” />
    </linearGradient>
    <radialGradient id=”rasputin”>
      <stop offset=”0%” stop-color=”#000000” />
      <stop offset=”100%” stop-color=”#FFFFFF” />
    </radialGradient>
  </defs>
  <!--∗ linear ∗-->
  <rect x=”10” y=”10” width=”100” height=”50”
    stroke=”#000000” stroke-width=”2pt” fill=”url(#leonard)” />
  <!--∗ radial ∗-->
  <rect x=”10” y=”70” width=”100” height=”50”
    stroke=”#000000” stroke-width=”2pt” fill=”url(#rasputin)” />
</svg>
SVG also supports patterns that you can use to fill shapes. See http://www.w3.org/TR/2011/REC-SVG11-20110816/pservers.html#Patterns for the details.
INCLUDING BITMAP IMAGES IN SVG
The start of this chapter mentioned that SVG gives you the best of both worlds — bitmap and vector — because you could include bitmap (raster) images in SVG diagrams. Here’s how. Listing, 18-10 uses the Isaac Newton picture from Chapter 17, but uses SVG to give Sir Isaac a red nose:
![]() LISTING 18-10: isaac-nose.svg
LISTING 18-10: isaac-nose.svg
<?xml version=”1.0” encoding=”UTF-8” ?>
<svg version=”1.0” xmlns=”http://www.w3.org/2000/svg”
  xmlns:xlink=”http://www.w3.org/1999/xlink”>
  <title xml:lang=”en”>Isaac Newton Picture With SVG</title>
  <image x=”10” y=”10” width=”300px” height=”310px”
      xlink:href=”isaac-newton-300x310.jpg”>
    <title>Sir Isaac Newton</title>
  </image>
  <!--∗ the red nose: ∗-->
  <circle cx=”190px” cy=”140px” r=”10px”
      stroke=”#000000” stroke-width=”2px” fill=”#FF6666” />
</svg>
You can add a preserveAspectRatio attribute to the <image> element, and give it a value of xMinYMin to make it fit (be careful with the mixture of lowercase and uppercase letters) or xMaxYMax to make it fill the available height and width even if some of the image is lost. Other values for preserveAspectRatio are listed in the SVG specification, and have to do with where to place the image in the viewport if it does not all fit.
SVG TEXT AND FONTS
So far there hasn’t been any text in any of the images. Because the author of this chapter has a background in digital typography, we can’t go without text! SVG text is fairly unsophisticated compared to (say) Quark Passport or Adobe InDesign, but it is more sophisticated than most other image formats, including PostScript.
You can design your own SVG fonts, embed existing fonts into SVG documents (assuming the license allows it), or refer to external fonts. In this regard SVG is rather like HTML 5 and CSS web fonts described in Chapter 17.
To include text in an SVG image, use the <text> element. You can style it with CSS, and you can include <tspan> elements inside <text> to format spans of text, rather like <span> in HTML.
The example in Listing 18-11 uses several concepts from earlier parts of this chapter to illustrate text. There’s Isaac Newton’s picture, there’s a <defs> element with a group containing the text, and then the actual text is placed twice, once in light yellow, almost white (#FFFF99) moved down and to the right by 2 pixels, and once in dark green (#003300) on top. The lighter text makes the words more legible against the texture of the image.
The font used, IM FELL English PRO, is a TrueType font made by Igino Marini and available freely from http://iginomarini.com/fell/. If you don’t have the font installed, the SVG renderer will substitute some other font.
![]() Listing 18-11 gravity.svg
Listing 18-11 gravity.svg
<?xml version=”1.0” encoding=”UTF-8” ?>
<svg version=”1.0” xmlns=”http://www.w3.org/2000/svg”
  xmlns:xlink=”http://www.w3.org/1999/xlink”>
  <title xml:lang=”en”>Isaac Newton Picture With text</title>
  <defs>
    <g id=”thetext”>
      <text width=”300px” height=”60px” x=”20” y=”60”
          font-family=”IM FELL English PRO” font-size=”32pt”
           >Sir Isaac Newton</text>
      <text width=”300px” height=”60px” x=”20” y=”120”
          font-family=”IM FELL English PRO” font-size=”24pt”
           >was the
        <tspan font-size=”48”>inventor</tspan></text>
      <text width=”300px” height=”60px” x=”20” y=”170”
          font-family=”IM FELL English PRO” font-size=”32pt”
           font-style=”italic”>of</text>
      <text width=”300px” height=”60px” x=”20” y=”250”
          font-family=”IM FELL English PRO” font-size=”48pt”
          >gravity.</text>
    </g>
  </defs>
  <image x=”10” y=”10” width=”300px” height=”310px”
      xlink:href=”isaac-newton-300x310.jpg”>
    <title>Sir Isaac Newton</title>
  </image>
  <g transform=”translate(2, 2)”>
    <use xlink:href=”#thetext” fill=”#FFFF99”/>
  </g>
  <use xlink:href=”#thetext” fill=”#003300”/>
</svg>
You can see how each line of text has to be a separate <text> element in SVG. This quickly gets tedious for humans editing SVG by hand, and it makes it difficult to create images that can reflow or change the text as they are resized, but you could use scripted animation for that, as described in the next section.
SVG ANIMATION FOUR WAYS
There are several ways to introduce interactivity and motion into SVG images. In this section you read a little about the four main ways to do so and when to use each of them. These four methods are Synchronized Multimedia Integration Language (SMIL, pronounced smile), scripted animation, CSS animation, and external libraries.
Synchronized Multimedia Integration Language (SMIL)
W3C SMIL is a specification for animating XML languages, and SVG incorporates a number of SMIL features. Native implementations of SMIL are also available, such as RealPlayer.
In most cases, SMIL is the best way to animate SVG images. SVG includes the <animate>, <set>, <animateMotion>, <animateColor>, and <animateTransform> elements. You can use these to make an SVG graphic element change over time or in response to user events, such as hovering over an object with the mouse pointer or touching a circle with a fingertip.
The restriction on these SMIL-based elements is that you can only use them to change SVG attributes or CSS properties. Additionally, although the SVG Recommendation says you can have, for example, a rectangle change size when the mouse hovers over a circle, that doesn’t work in web browsers, and in practice you can only have SMIL animation elements affect the object that includes them.
Within these limitations SMIL animation is still very powerful, and because it is declarative, it is usually easier to write, debug, and maintain than the other animation methods. It is also the most widely supported. Listing 18-12 shows an SVG document that describes a circle and an ellipse. If you hover the mouse pointer over the circle, the <animate> element inside the circle fills it with red. When the mouse pointer leaves the circle, its original gray fill is restored. Similarly, if you hover the mouse over the ellipse, it moves to the right and gets thinner.
![]() LISTING 18-12: SMIL-animation.svg
LISTING 18-12: SMIL-animation.svg
<?xml version=”1.0” encoding=”UTF-8” ?>
<svg version=”1.0” xmlns=”http://www.w3.org/2000/svg”>
  <g>
    <circle cx=”60” cy=”60” r=”50”
      fill=”#BBBBFF” stroke=”#CC0000” stroke-width=”1pt”>
      <set attributeType=”XML” attributeName=”fill”
        from=”#9999CC” to=”#CC0000”
        begin=”mouseover” end=”mouseout”
        />
    </circle>
  </g>

  <ellipse id=”wink” cx=”145” cy=”60” rx=”15” ry=”50”
    fill=”#9999CC” stroke=”#CC0000” stroke-width=”1pt”>
      <animate attributeName=”cx” attributeType=”XML”
        from=”145” to=”300”
        begin=”mouseover” dur=”2s”
        />
      <animate attributeName=”rx” attributeType=”XML”
        from=”10” to=”0”
        begin=”mouseover” dur=”2s”
        />
  </ellipse>
</svg>
Scripted Animation
If your SVG images are intended for use in a web browser, or some other environment with JavaScript and DOM-based scripting, you can use DOM events in SVG for animation. The DOM was described briefly in Chapter 7, “Extracting Data from XML,” and the JavaScript language was introduced in Chapter 16, “AJAX.”
To use this method you should be familiar with JavaScript, the JavaScript error console, DOM events, and cross-browser portability. However, because native support for SVG in web browsers (other than Firefox and Opera) didn’t really happen until 2011, support for older browsers isn’t an issue: the issue becomes one of fallback instead, of providing an alternative. Even if you are familiar with JavaScript, it may still be simpler to use an External Library.
Listing 18-13 shows some simple JavaScript animation used to show or hide the ellipse when you hover the mouse over the circle by adding the onmouseover and onmouseout attributes. Note that making the ellipse move smoothly is much harder with this approach.
![]() LISTING 18-13: js-animation.svg
LISTING 18-13: js-animation.svg
<?xml version=”1.0” encoding=”UTF-8” ?>
<svg version=”1.0” xmlns=”http://www.w3.org/2000/svg”>
  <circle cx=”60” cy=”60” r=”50”
    fill=”#BBBBFF” stroke=”#CC0000” stroke-width=”1pt”
    onmouseover=”document.getElementById('wink').style.visibility = 'visible';”
    onmouseout=”document.getElementById('wink').style.visibility = 'hidden';”
    >
  </circle>

  <ellipse id=”wink” cx=”145” cy=”60” rx=”15” ry=”50” visibility=”hidden”
    fill=”#9999CC” stroke=”#CC0000” stroke-width=”1pt”/>
</svg>
A new JavaScript technique called Web Animation was proposed in May 2012; it is not available yet (as of this writing) but may be in the future.
CSS Animation
This technique is new at the time of writing (Spring 2012) and not yet standardized. It is mentioned here partly because by the time you read this book it might be more popular. At least one company (Microsoft) has suggested that it plans to support CSS animation rather than SMIL animation in its web browser, although the market may well have voted for a mixture of SMIL and JavaScript already.
External Libraries
Sometimes the easiest approach is to let others do the hard work. In Chapters 16 and 17 you read about the jQuery library; jQuery plug-ins are available to show SVG documents that can fall back to other methods in versions of Internet Explorer without SVG support. Libraries are also available for doing visualizations of data in SVG, for charts and graphs that move, and much more.
Rather than learn about a single library in this book you should think about your needs, your environment, and the skills of people who will have to maintain what you write, and then look at drawing libraries. Most programming languages contain libraries for creating SVG, as well as frameworks for handling animation.
The question then becomes one of choosing a project. Most of the best libraries for web-based work are open source and free, and, most important of all, you can get the full source code, so that if necessary, you could fix bugs (or pay someone to fix bugs). Make sure the project is widely used and active and you can be pretty sure that it will still be maintained for years to come.
See the “Resources” section later in this chapter for some popular libraries.
SVG AND HTML 5
HTML 5 includes SVG and MathML as if they were part of HTML. It doesn’t even need the SVG namespace to be declared. This has a number of implications for people working with XML. One is that you’ll start to see HTML documents containing SVG fragments with syntax errors in them. Fortunately, standalone SVG documents are still parsed as XML, so authors have to fix the errors to make them work. Another implication is that SVG has gone mainstream, so there will be better tool support. And another is that you can mix SVG with HTML, including HTML fragments inside a foreignObject element. Listing 18-14 (isaac-again.html) shows an example, and Figure 18-15 shows what it looks like in the Firefox web browser.

![]() LISTING 18-14: isaac-again.html
LISTING 18-14: isaac-again.html
<!DOCTYPE html>
<html>
  <head>
    <title>HTML 5 and SVG</title>
  </head>
  <body>
    <h1>Isaac Again</h1>
      <svg version=”1.0” xmlns=”http://www.w3.org/2000/svg”
        xmlns:xlink=”http://www.w3.org/1999/xlink” width=”300” height=”310”>
      <title xml:lang=”en”>Isaac Newton Picture With text</title>
      <defs>
        <g id=”thetext”>
          <foreignObject x=”10” y=”15” width=”290” height=”300”>
          <body xmlns=”http://www.w3.org/1999/xhtml”>
            <div style=”font-size: 32pt; line-height:36pt;”>Sir Isaac Newton
              <i>was the</i> <big>inventor</big> of
              <big>gravity</big>.</div></body></foreignObject></g>
      </defs>
      <image x=”10” y=”10” width=”300px” height=”310px”
          xlink:href=”isaac-newton-300x310.jpg”>
        <title>Sir Isaac Newton</title>
      </image>
      <g transform=”translate(2, 2)”>
        <use xlink:href=”#thetext” color=”#ffffff” />
      </g>
      <use xlink:href=”#thetext” color=”#666666” />
    </svg>
  </body>
SVG AND WEB APPS
In Chapter 17, you read about the Open Web Platform and HTML 5. There’s a whole host of APIs and languages you can use to make web applications, and one of several driving forces in creating these has been the increased use of mobile computing devices with Internet and web access. The idea of a web application, or app, is that it’s a self-contained web page that interacts with a server as little as possible, keeping you on the same page using AJAX (see Chapter 16 for an introduction to AJAX). But a web application is really just any application you access through a web browser.
Web apps tend to draw themselves as if they have dialog boxes and controls just like a desktop application, and they generally use a mixture of SVG and CSS to do this, usually via a library such as jQuery.
In many cases with web app development the SVG will actually be hidden from the developer by the library, but, because SVG is XML-based, you can generate it with XQuery and XSLT on your web server, or even using the XSLT engine that’s built in to many web browsers. This turns XSLT and XQuery into potential user-interface generation systems, and you look at that next.
MAKING SVG WITH XQUERY OR XSLT
It’s easy to create SVG graphics using XQuery queries or XSLT stylesheets. SVG is an XML-based format and XQuery and XSLT are excellent languages for creating XML documents. There are only a few things to watch out for when doing this and they are described in this section.
The first consideration is that you need to set your serialization options to XML. With XQuery 3 and XSLT 3 you’ll also be able to use HTML 5 as an output method if you are creating HTML with embedded SVG.
The next area of concern is that if you are creating CSS, you must decide whether to style SVG or HTML or even XML. You will want to put the CSS in a separate file with the output method set to text. The same applies to JavaScript. If you include inline CSS in the files that you generate with XQuery you’ll go insane because of all the curly braces. JavaScript is even harder because of the dollar signs and curly braces. It’s also hard to get the serialization options right to include CSS in XHTML: you have to use <xsl:comment> to contain the inline CSS. But if you keep the JavaScript and CSS in separate, external files rather than creating them with XQuery or with XSLT, you won’t have any problems.
Having said all that, there are lots of uses for SVG in the web browser, and the idea of combining SVG with AJAX can make for exciting effects. You can also generate SVG and use jQuery to surround an HTML element with an SVG border, for example, by “reparenting” the HTML element.
XQuery in the browser (see http://xqib.org) and Saxonica’s Client Edition of Saxon for XSLT 3 in the browser are also exciting developments at blurring the distinction between client and server.
With many of the world’s book publishers using XML, XQuery, XHTML, and XSL-FO (see next chapter), having SVG in electronic books will for sure be the next exciting development in this area. It’s also fabulously easy to make charts and business graphics in SVG from XQuery. In Chapter 19, Case Study: XML in Publishing, you’ll get a chance to try it out!
RESOURCES
It would be easy to expand this chapter into a whole book because there’s so much that can be said about SVG. You have seen enough to know if you’re interested; if you are, some of the extra resources in this section will help you.
- Introduction to SVG: The W3C homepage for SVG at http://www.w3.org/Graphics/SVG/.
- Learning SVG: http://www.learnsvg.com/ and http://svgelves.com/.
- Popular Visualization Libraries: http://mbostock.github.com/d3/ and http://raphaeljs.com/
SUMMARY
- Scalable Vector Graphics (SVG) is an XML-based format for declarative vector graphics.
- SVG is widely supported, with desktop icons, camera menus, photocopier controls, and web browsers all using it.
- SVG includes XML elements for describing simple shapes such as rectangles. More complex shapes are described using SVG paths.
- The Inkscape program is an open source graphics editor you can use to create and edit SVG graphics.
- HTML 5 includes SVG, so you can put SVG graphics directly into web pages.
EXERCISES
You can find possible solutions to these exercises in Appendix A.
WHAT YOU LEARNED IN THIS CHAPTER
| TOPIC | KEY POINTS |
| The different kinds of images Image drawing can be procedural or declarative; SVG is declarative, and tells you what, not how. |
Images can be bitmap or vector; SVG images are vector-based, but can also contain bitmap (raster) images. |
| Basic shapes in SVG | Circles, ellipses, rectangles, lines, polylines, and polygons are all defined in terms of SVG paths. |
| SVG is XML | SVG is an XML-based format. SVG images can be generated by and manipulated with XML tools. |
| SVG is also part of HTML 5 | You can include SVG diagrams directly in HTML documents. |
| SVG and fonts | SVG supports web fonts, CSS font descriptions, platform-native fonts, as well as its own format, SVG fonts. |
| Viewports and coordinates | SVG images are seen through scalable, stretchy viewports; subelements like <g> can establish new viewports and also new coordinate systems for their contents. |