Value maps are not only a powerful way to visualize trade-offs but they also help guide investments and connect strategy with operations. In this chapter, we will see how companies use value maps to link strategic choices with activities and budgets.
Choosing a Value Proposition
You will recall (from chapter 3) that a company’s ability to capture some of the value that it creates depends entirely on differences—differences in willingness-to-pay (WTP) or willingness-to-sell (WTS). By comparing your company’s value curve to the value propositions of your competitors, you can identify relevant differences and devise ways to heighten them. Let’s look at an example.
When Expedia, the online travel agency, set out to build its value map, the company began by asking customers how they choose travel sites. It started with personal, open-ended conversations and focus groups; both techniques are well suited to identifying critical value drivers. With a list of key concerns in hand, Expedia then surveyed more than 13,000 travelers to learn more about the importance of the various value drivers. The company also asked the travelers how well Expedia meets their needs and then compared its own performance to that of the competition. The result of the research is shown in figure 18-1.1
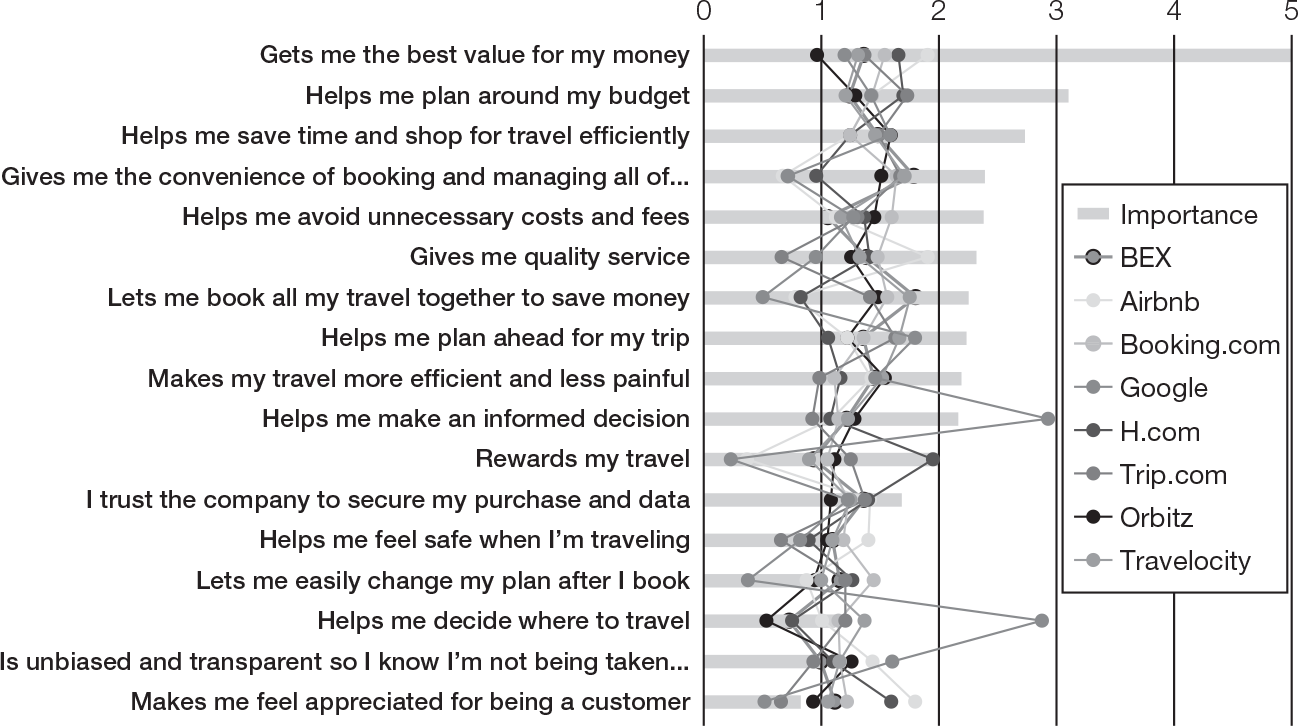
Figure 18-1 Value map for online travel services
The value drivers in figure 18-1 are ordered from most important (“Gets me the best value for my money”) to least important (“Makes me feel appreciated for being a customer”). The gray bars indicate the relevance of each item. As you can see, the performance of the six companies is tightly clustered on many dimensions. This is a fiercely competitive industry. To capture patterns of differentiation, the Expedia team grouped the value drivers into eight broad themes, as shown in figure 18-2.2
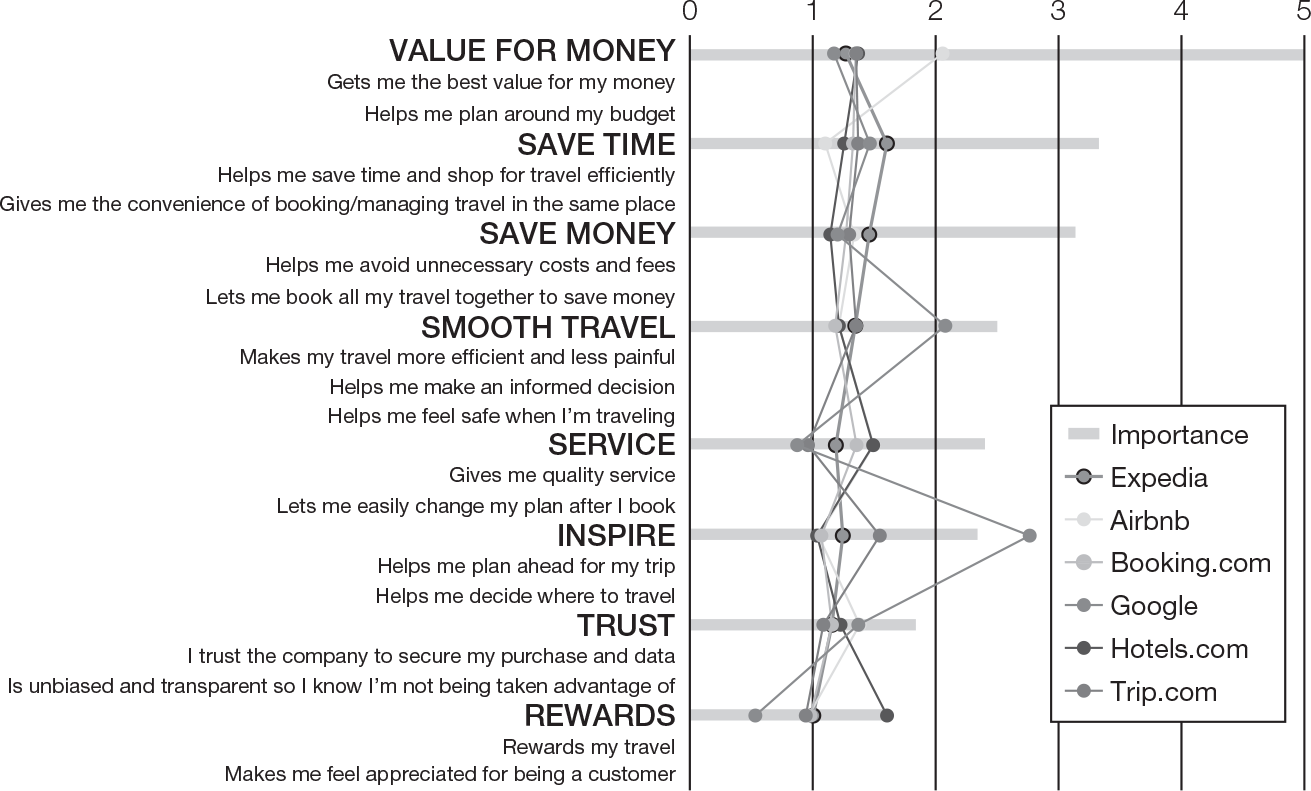
Figure 18-2 Groups of value drivers and firm performance
You see that Airbnb leads the industry in providing value for money. Expedia scores top points for saving time and money. Google has made the clearest trade-offs; it dominates the planning stage of travel but lacks many other services that travelers need. Booking.com and Hotels.com are essentially undifferentiated.
Grouping value drivers is helpful because it provides a sense of brand personality. Ike Anand, Expedia’s vice president for strategy, led the company’s value map project; he explains, “When we looked at our competitors, we realized they often do well in value drivers that try to achieve similar objectives. In order to stand out in the minds of consumers, you can’t just do well on a single value driver. You have to go after a theme.”3 Although developing themes is critical to understanding how customers make choices, Anand still recommends starting the research with specific value drivers: “If you ask consumers thematically, you lose the granularity that you need in order to act.”
A careful analysis like Expedia’s allows your company to select a favorable competitive position, one that will include significant points of differentiation—a set of value drivers that will ensure you stand out from the competition. To best your rivals on these dimensions, you will have to divert resources from other value drivers, areas where you do not excel. These are the trade-offs associated with your competitive position.
Let’s look at a hypothetical example. Suppose Expedia were to consider the three changes to its value proposition shown in figure 18-3.4 What criteria would you apply to select a proposal? Here are the key considerations.
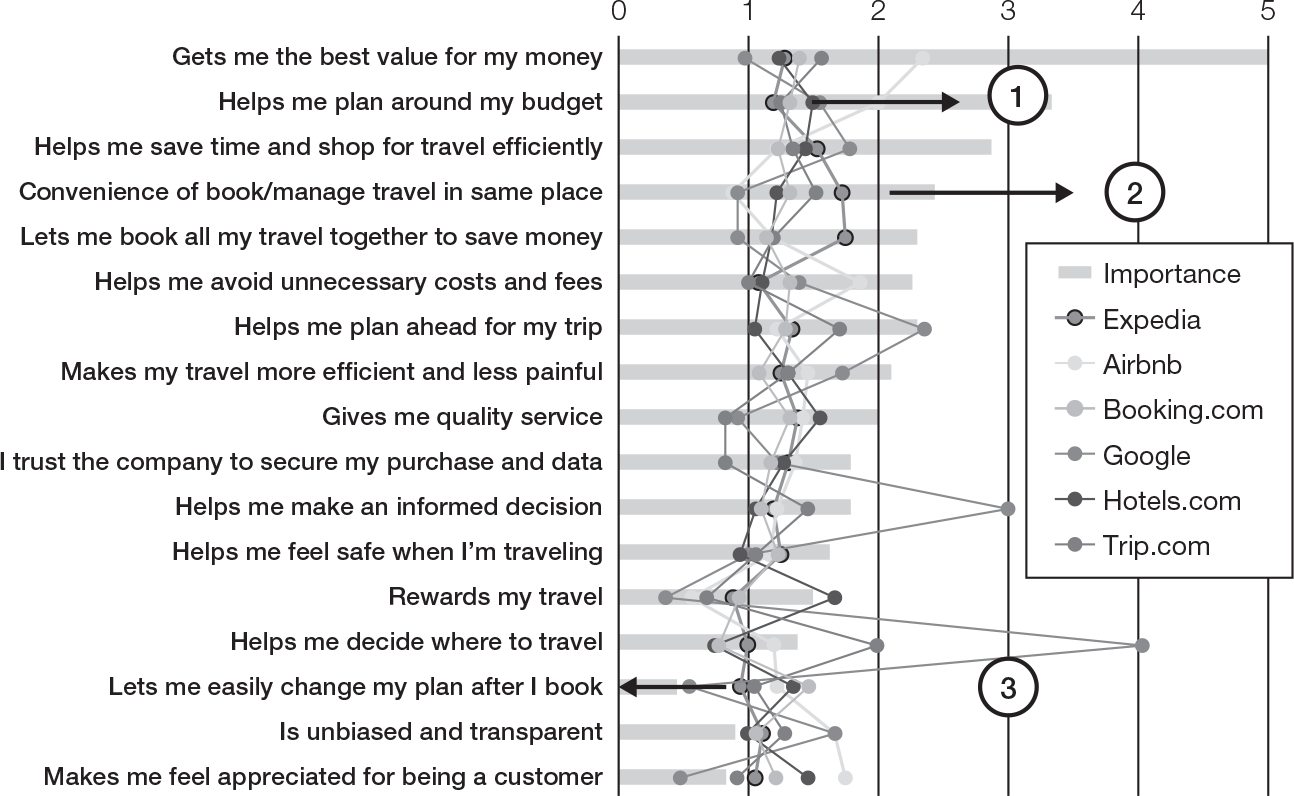
Figure 18-3 Evolving your value proposition
- What is the return on investment? For each proposal, you can calculate an expected return on investment. Proposal 1—improving the way you help travelers work around their budgets—might be very effective in raising WTP, but developing and implementing it could be expensive and might therefore reduce financial returns. For each change in a value driver, you will want to determine both the impact on WTP and the resources and capabilities required to create more value.
- How important is the value driver? Because you seek exceptional returns for changes in your value proposition, the most attractive initiatives improve value drivers that sit near the top of the chart. You should be skeptical about the merits of investments in lower-ranked value drivers.
- Is the value driver part of a theme? Groups of value drivers that serve a similar purpose often make attractive investment opportunities. As Anand pointed out, themes help your company stand out in the minds of consumers.
- Are you catching up or pulling ahead? Choosing between projects that make up for shortcomings (proposal 1) and initiatives that deepen a current competitive advantage (proposal 2) can be difficult, especially when they yield similar financial returns. In these situations, it is important to remember what you hope to achieve. You want to raise WTP—both projects do so—while maintaining or increasing differentiation. Only the second proposal achieves the latter. Improved help with budgeting would make Expedia more attractive but also more similar to Airbnb, forcing the two companies to compete more heavily on price. As a rule, deepening an existing competitive advantage is a better idea than trying to catch up with your rivals.
- Where do you underinvest? Spotting opportunities to do less is as important as thinking about ways to raise WTP. Proposal 3 might be an attractive target for underinvestment, because it removes (costly) options that are of lesser importance to travelers. At Expedia, as in most companies, it was challenging to decide where not to invest. Anand recalls, “The prioritization part of the conversation was easier; it was the deprioritization that was difficult. The first time we drew the value curves, we didn’t exactly end up where I wanted us to be. But the discussion was super useful, because it became apparent to everybody that we were not willing to cut too much. If you keep the process going—meet every quarter and have this discussion, and then update the value maps once a year and have the conversation again—it becomes a habit, so people feel much more comfortable making those deprioritization decisions.”
Taking all these considerations into account, you are likely to come up with a value curve that slants from the top right to the bottom left, as we discussed in chapter 17: you excel at the dimensions that are important for the WTP of your customers, and you deprioritize value drivers that have less impact on value creation.5 At the same time, the shape of your value curve will also need to reflect competitive concerns. Even the smartest allocation of resources will provide little competitive advantage if you choose a value proposition that closely resembles one that your rivals have adopted.
Customer Segments
Expedia used its value map to sharpen the company’s overall competitive profile. You can also employ value maps to make more granular investment decisions. Customer segmentation is an example. Most companies serve more than one segment, and initiatives that benefit one of them may or may not create an advantage with others. Figures 18-4a and 18-4b show value drivers for Tatra banka, Slovakia’s first post-communist private bank. Founded in 1990, Tatra quickly led European banking in the adoption of digital technology. It first offered mobile banking in 2009, introduced voice biometrics in 2013 and facial recognition in 2018, earning more than 100 awards for its innovative services.
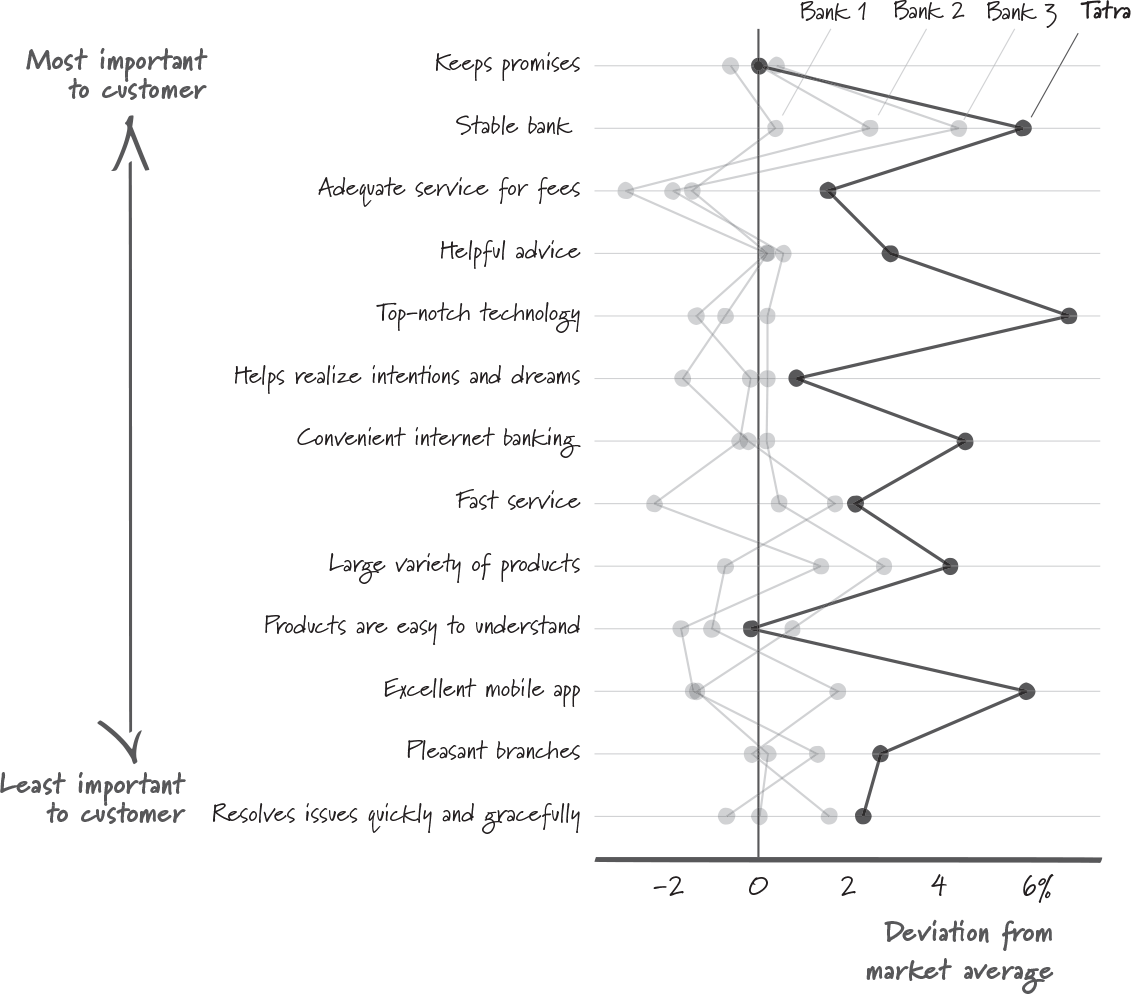
Figure 18-4a Value map for Tatra banka, mass market customers
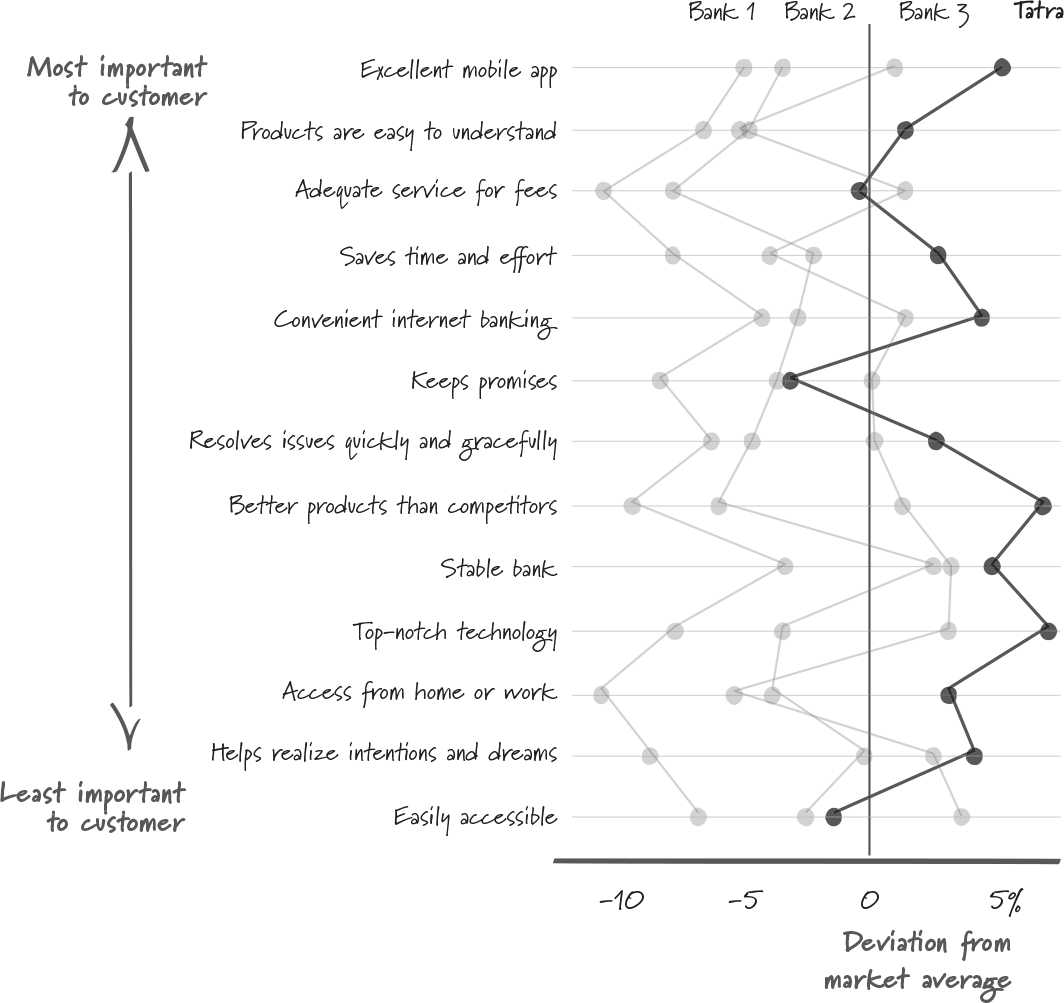
Figure 18-4b Value map for Tatra banka, premium income customers
In late 2019, Tatra decided to update its strategy. CEO Michal Liday explains the motivation: “The idea was to take what we had learned from our existing strategy and upgrade it to a new level, a level that takes into account where the world is headed and how customers have changed.”6 Tatra used value maps to get a sense of the bank’s strategic opportunities. “This goes back to our deepest belief that differentiation is the only way to succeed in a difficult environment,” says Liday. “We always strive to be different. Value maps play a significant role, because it’s not enough to say, ‘We want to be different.’ You need to understand how customers perceive the market and which factors they value. You then focus on these factors to make differentiation work.”
When Tatra’s leadership team studied the updated value maps, the results for premium income and mass market customers differed substantially (figure 18-4a and figure 18-4b).7
The two segments share some value drivers. For example, both groups of customers are sensitive to fees. Most striking, however, are the many differences. For premium income customers, an excellent mobile banking application is the top concern. Mass market customers appreciate Tatra’s excellent mobile app—its rating is 6 percent above market average—but the quality of mobile apps is not nearly as important to them as the bank’s financial stability and a sense that the institution will keep its promises.
Differences in value drivers across segments have important implications for strategy. In Tatra’s example, investments in mobile technology do not quite yield the benefit that the firm would reap if the two segments were more similar. At an extreme (think of segments with completely different value drivers), the analysis will show that it is impossible to serve all segments successfully, so you might decide to focus on a particular subset of customer groups. By highlighting commonalities and differences, value maps provide important insights for questions of corporate scope and inform decisions about whom to serve and what products to offer.
My recommendation is to begin your value curve analyses by employing a fine-grained customer segmentation. Create separate value curves for many different groups of customers. If the data show that two segments have nearly identical value drivers, you can treat the two groups as one segment. If you begin with a broad grouping, however, subtle differences that might influence your strategy will remain hidden.
Customer Journeys
Value curve data can also be employed to guide customers more effectively through the buying process. Figure 18-5 shows Tatra’s marketing funnel for mass market customers. Some 90 percent of them are aware of Tatra banka, but only 19 percent actually use the bank’s services.
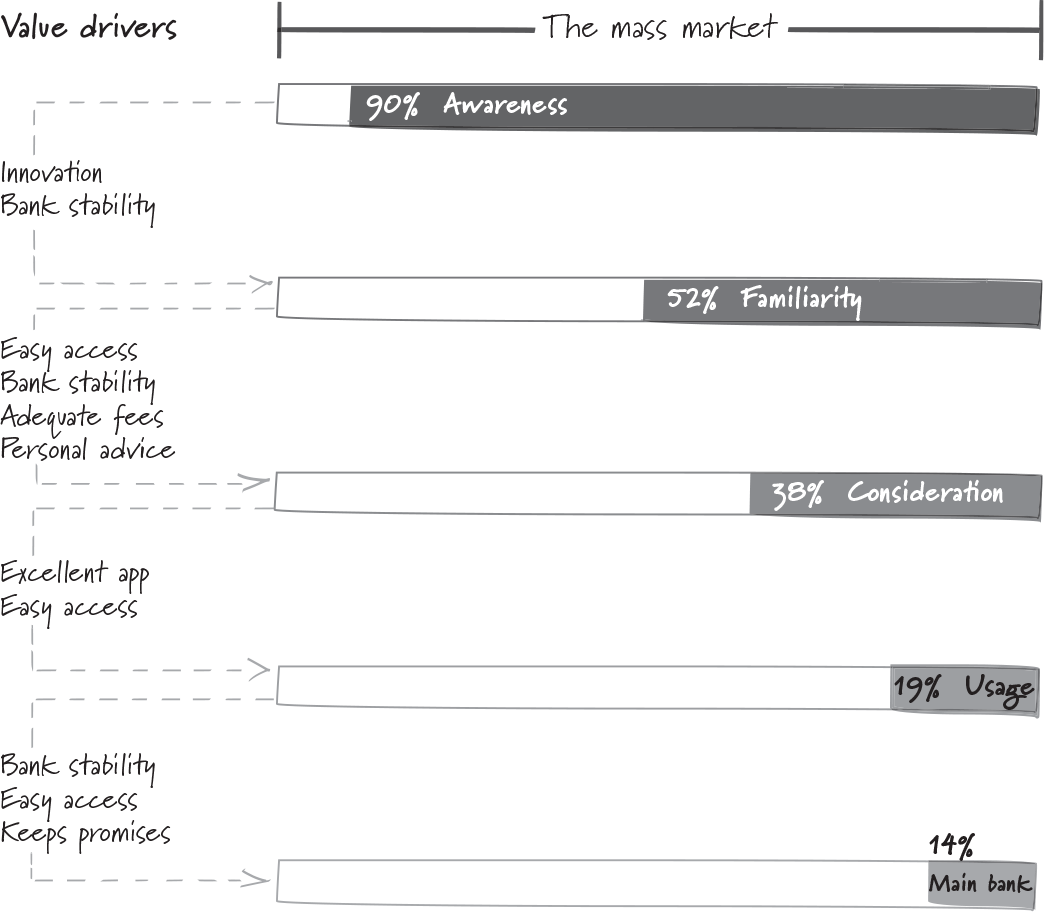
Figure 18-5 Value drivers along Tatra’s marketing funnel
How can the firm encourage broader adoption? Value curves will show you which drivers are particularly effective at moving customers from one location in the funnel to the next. Figure 18-5 lists the relevant value drivers in order of importance. For example, Tatra’s mobile app is particularly successful at encouraging customers who consider banking with Tatra to actually open an account. But the app is less relevant for the decision to make Tatra a customer’s main bank. This fact, Liday explains, “reflects a shortcoming of our previous strategy. Our focus was on technological innovation and features, not customer experience. But it is the customers’ experience that influences the depth of their relationship with us, so now we are refocusing. Let’s use technology, but let’s use it in a way that increases customer engagement.”
From Value Maps to Strategy Implementation
Once you decide which value drivers to strengthen and which ones to deemphasize, strategy implementation follows naturally. The key steps are to generate ideas that have the potential to move the value drivers in the desired direction; this is a chance to let your creativity shine—and then to assign responsibility for implementation.8 Figure 18-6 illustrates the process, using KitchenAid appliances as an example. Whirlpool, the company that owns the brand, focused its investments on four value drivers: versatility, performance, styling, and craftsmanship. For each of these, the company developed a tagline that describes the benefit from the customer’s point of view. Versatility aspires to provide “cooking/warming ‘how I need it … where I need it,’” and craftsmanship means “fit, feel & finish that is durable and never fails.” Engineers used the taglines to identify strings of innovation projects. Whirlpool calls these strings migration paths. Each path promises to raise WTP along one of the four dimensions. The rectangles in figure 18-6 represent the planned innovation projects.9
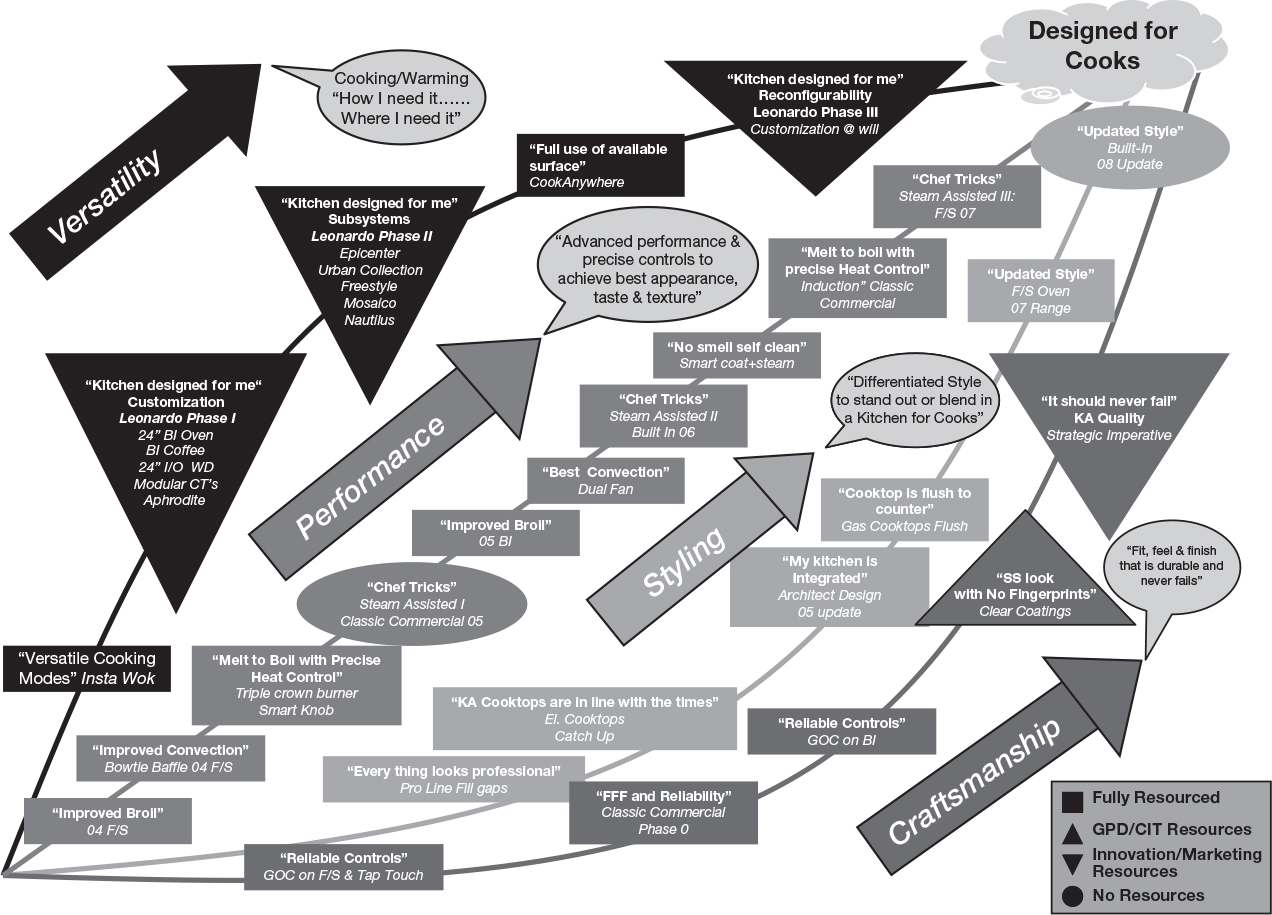
Figure 18-6 KitchenAid migration paths
What I find particularly interesting about Whirlpool’s migration paths is that they include projects for which the operating units currently lack resources. Placing these projects on the paths is valuable, because it shows opportunities for reallocating talent and capital in the interest of raising customer WTP even more effectively.
Seeing the four migration paths (represented by the large arrows), you might conclude that Whirlpool decided to compete on innovation. But this impression is false. Innovation is simply a tool; the strategy is to strengthen the four value drivers. David Whitwam, then CEO of Whirlpool, said, “I don’t know how many times I’ve had to emphasize this. Innovation is not our strategy. Our strategy is brand-focused value creation.… Innovation is a critical enabler of the strategy.”10 As it implemented the strategy mapped out in the migration paths, the KitchenAid team was able to grow its business considerably and raise prices by more than 3 percent over the first five years of brand-focused value creation. Quite an accomplishment, considering that, industrywide, prices fell by 7.7 percent.
Tatra banka illustrates the connection between value-creating activities, responsibilities, and performance with the help of a road map. The map is prominently displayed in all its offices and branches (figure 18-7).11 Liday explains, “We describe our strategy in what we call ‘The Book of the Bank.’ It’s a nice document, but we noticed that there was no direct connection between the storyline in the book and the job descriptions of our 4,000 employees, their day-to-day work.” Tatra uses the road map to align its strategy with the activities in the bank.
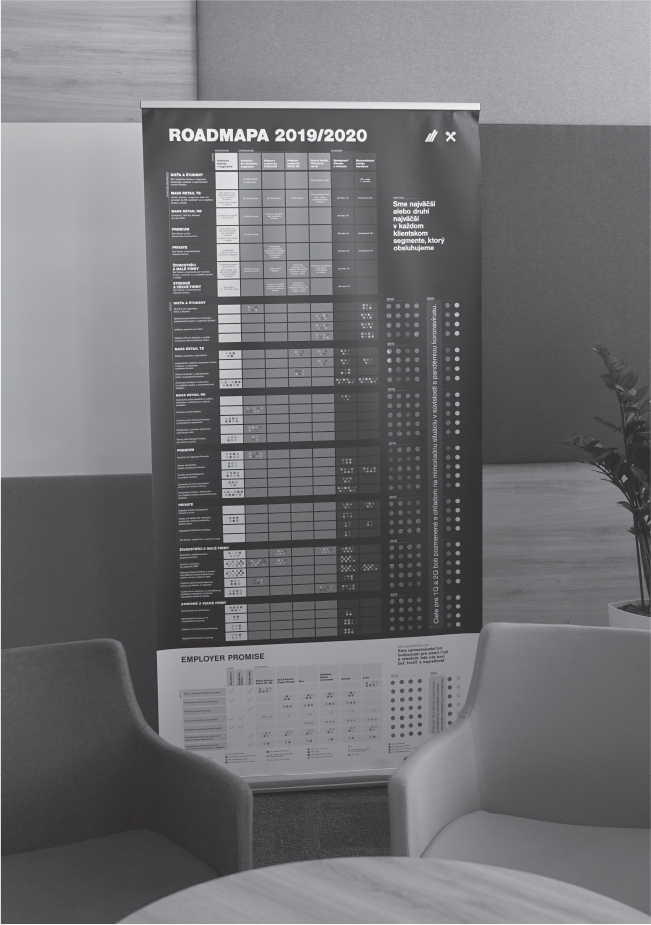
Figure 18-7 Tatra banka road map
Figure 18-8 shows the section of the map that pertains to mass market customers.
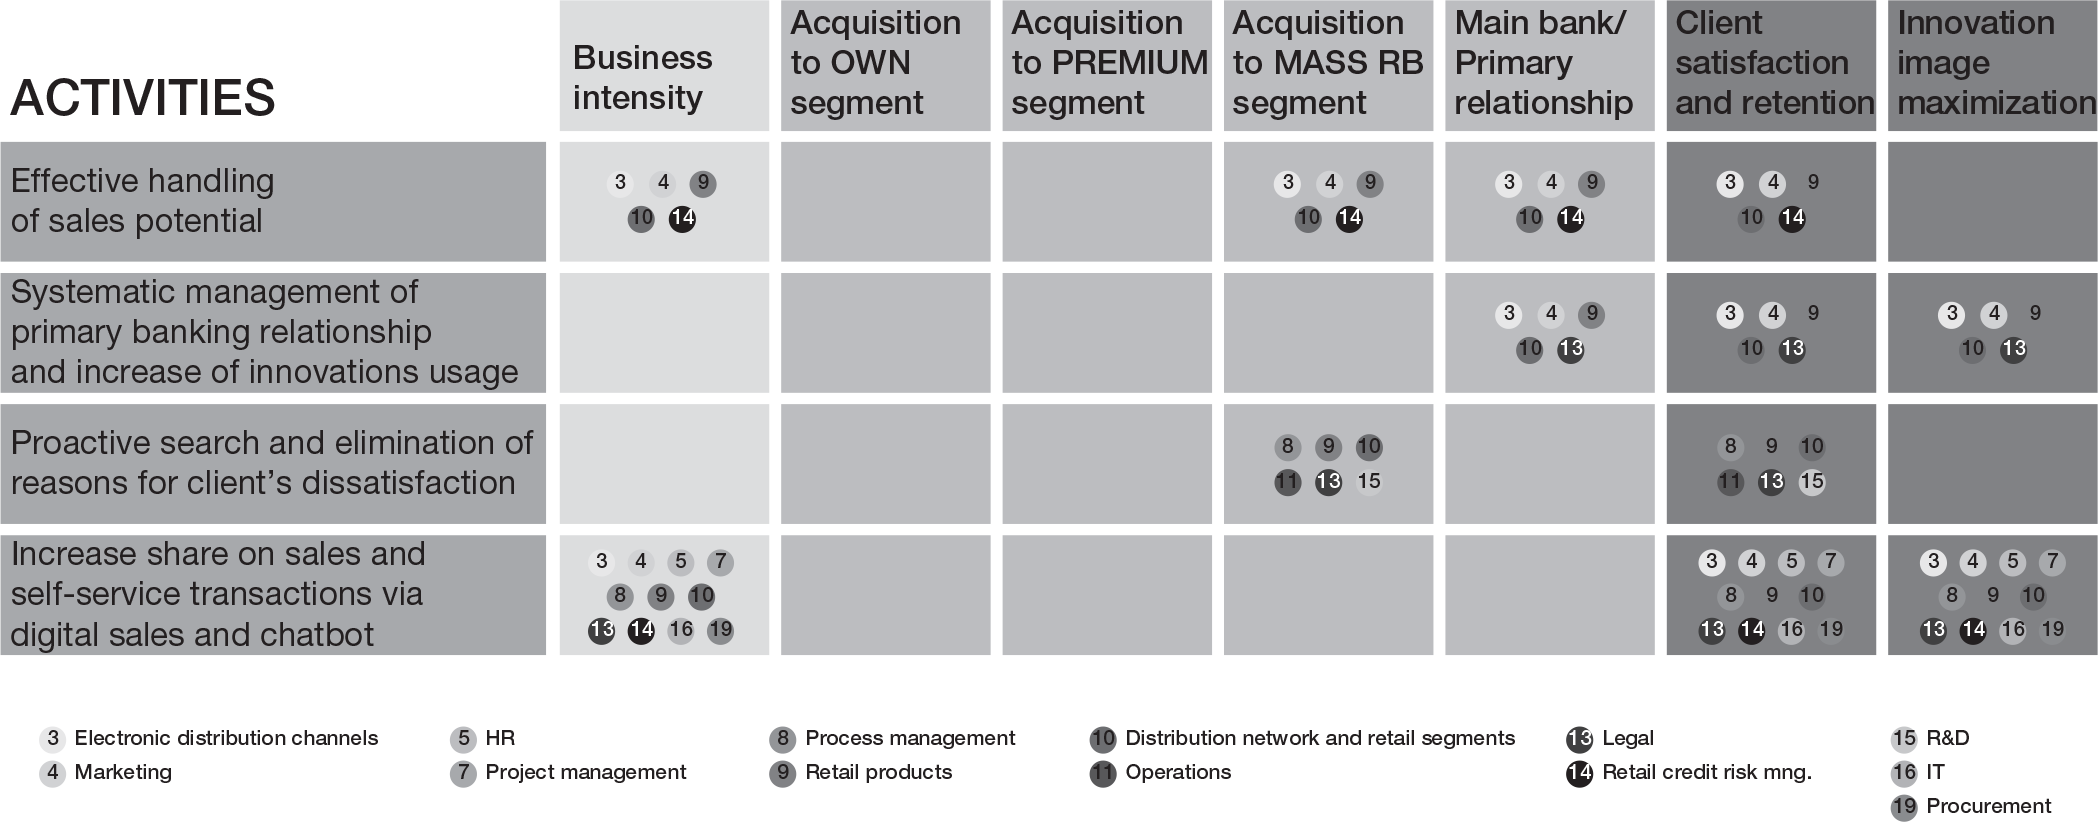
Figure 18-8 Tatra banka road map—linking activities and KPIs
“Activities” represent the processes and initiatives that help Tatra move value drivers in the desired direction. Across the top, the road map displays KPIs. For example, in 2020 Tatra wanted to be the main bank for 57 percent of its mass market customers. The numbered circles indicate the part of the organization that bears responsibility for the activity and, ultimately, its performance. Smileys and frownies indicate how well the organization is meeting its goals (figure 18-7). “We go through all the activities each quarter and have long conversations about the frownie indicators. Why are we not on track?” says Liday. “If an activity falls short for three-quarters, we meet with all division heads and regional leaders, about 60 managers. In a deep dive, the owner of the activity explains the issues, and we look for solutions.” Laughing, he adds, “This is a meeting everybody wants to avoid.” Liday credits the road map with providing a sense of strategic direction for nearly everyone: “What I’m most happy about is that, in employee engagement surveys, nearly 90 percent of Tatra employees tell us that they understand the strategy of the bank and know how they contribute to its execution.”
Value Proposition for Employees
As important as a differentiated value proposition for customers are advantages in WTS. “This was a process for us,” says Liday. “We knew we had to have a business strategy, of course. But it took some time to come to the conclusion that we needed the same view of customers and employees. We ran through an intensive exercise, trying to understand what is important to our employees, how they find meaning in their work.” To identify and heighten differences in WTS, you can use the exact same process described earlier. Figure 18-9 illustrates how Tatra competes for people who might consider working as bank tellers.
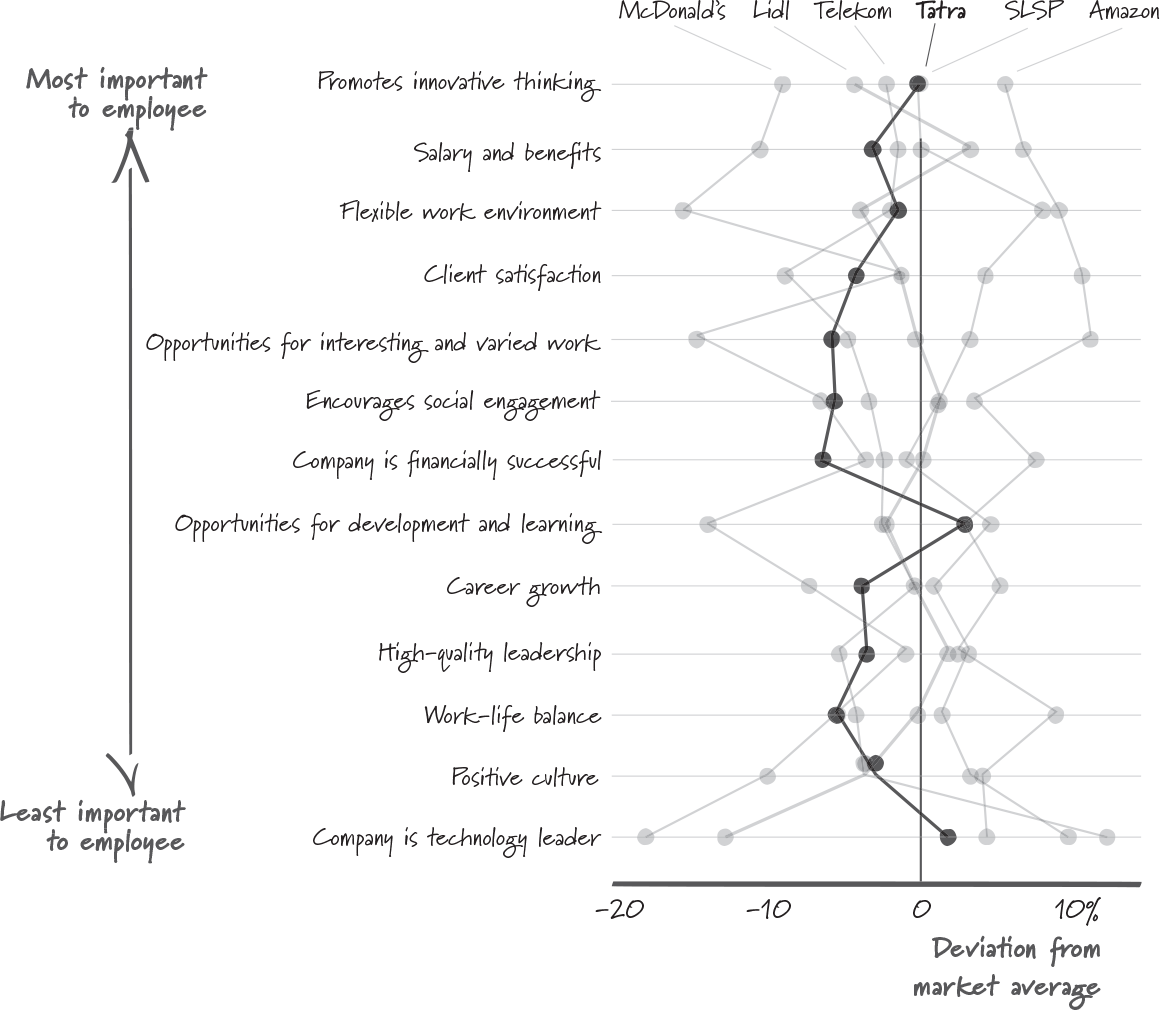
Figure 18-9 Competition for bank tellers in Slovakia
In Slovakia, Amazon is the employer of choice for this group of workers. The retailer stands out on all the criteria that matter most: an engaging work environment (“creative thinking”), generous compensation, and flexibility. McDonald’s, by contrast, struggles: it approaches the market average in only two value drivers (client satisfaction and the quality of the company’s leadership), and it leads in no dimension. The data also show that Tatra faces a tough competitive environment in the market for this type of talent. The firm’s most promising opportunities are to emphasize that Tatra banka promotes innovative thinking and provides great opportunities for learning and development.
Keep in mind that any measure of WTS (or WTP, for that matter) is subjective. The values in figure 18-9 reflect the perceptions of prospective employees. These values may or may not correspond to actual differences between the six competitors. The perceptions are important, however, because they determine which jobs employees consider when looking for work. If you find that your talent pool is missing particular groups of individuals for whom you could provide attractive work, consider taking a closer look at your talent funnel. Value curves can help you understand how candidates think about the prospect of working at your firm. The results of the analysis are useful in developing employer branding initiatives and steering recruitment efforts.
A comprehensive strategic plan includes customer and talent value propositions. If your company relies on critical suppliers or works closely with important complementors, you will also want to develop value maps for these relationships.
Taken together, the maps will point to numerous opportunities for creating value. Because every initiative that flows from this process is directed at raising WTP or lowering WTS, activities in the organization remain closely aligned, and you avoid a situation where hundreds of initiatives would pull the organization in different directions.

Value maps are a powerful tool that facilitates the transition from strategy formulation (how you plan to move WTP and WTS) to strategy implementation (the specific activities and initiatives that make the proposed changes in WTP and WTS real). In my experience, the tool provides several key advantages.
- WTP and WTS are summary statistics. An understanding of your customer’s WTP informs competitive moves and pricing decisions, but it does not tell you much about the reasons for this valuation. Understanding value drivers completes the picture. “The prospect that you are just average is very scary,” says Liday. “We know we need to be different. But we need to know how. Value maps are a perfect tool to help us navigate through this complicated world.”
- Value maps are data driven. It is tempting to rely on one’s intuition and anecdotes to get a sense of customer WTP and talent WTS. But when I see companies undertake a serious value curve analysis, there is almost always a surprise—a value driver that turns out to be less critical than commonly assumed, or an unexpected level of performance in some dimension. “The method is continuous and research-based,” says Expedia’s Anand. “You can really measure your progress. It is a lot more detailed and more reliable because it is based on data.”12
- Seeing your organization through the lens of value maps is an exercise that is radically customer-, talent-, and supplier-centric. Remember, the true performance of your organization matters only to the extent that it influences the perceptions of these three groups.
- Most companies collect extensive data on customer perceptions of their organization and the engagement of their employees. Value curve analyses encourage you to also see the competition through the eyes of both your customers and your talent. “Plotting all your competitors together is pretty interesting,” explains Anand. “A lot of times companies do research only on themselves, but [value curve analysis] is really looking across your industry, which is super helpful.”
- Value drivers live midway between the rather abstract notions of WTP and WTS and the specific attributes that describe your current product or service. This has two advantages. On the one hand, value drivers are specific enough to be actionable. It is a straightforward task to link them to operating models and KPIs. On the other hand, value drivers do not specify in any detail how you will meet a particular customer need. They help you explore new ways to satisfy clients. Focusing on value drivers, you are less likely to fall into the trap of adopting a narrow mindset that equates business success with selling more of what you already offer.