
I know it is probably poor storytelling, but I am tempted to share the good news right up front. I am incredibly optimistic about the potential of most companies to create more value and substantially improve their financial performance. And no, this is not just wishful thinking. My optimism is grounded in careful analysis of the data. Select any segment of the economy, and you will see that the very best companies in that segment dramatically outperform other firms. If the average company made even modest advances, value created and profits would soar.
But let’s back up. Our topic in this chapter is the broad patterns of long-term financial success. There is no one metric that captures all facets of financial performance. But if I had to pick a single one, I would choose return on invested capital (ROIC). ROIC compares the profit realized from business operations (operating income) with the capital (equity and debt) that is employed to generate that profit. In other words, ROIC tells us how good a business is at turning investors’ funds into income from operations.1
Figure 2-1 shows the distribution of ROIC for companies in the S&P 500 from 2009 to 2018.2
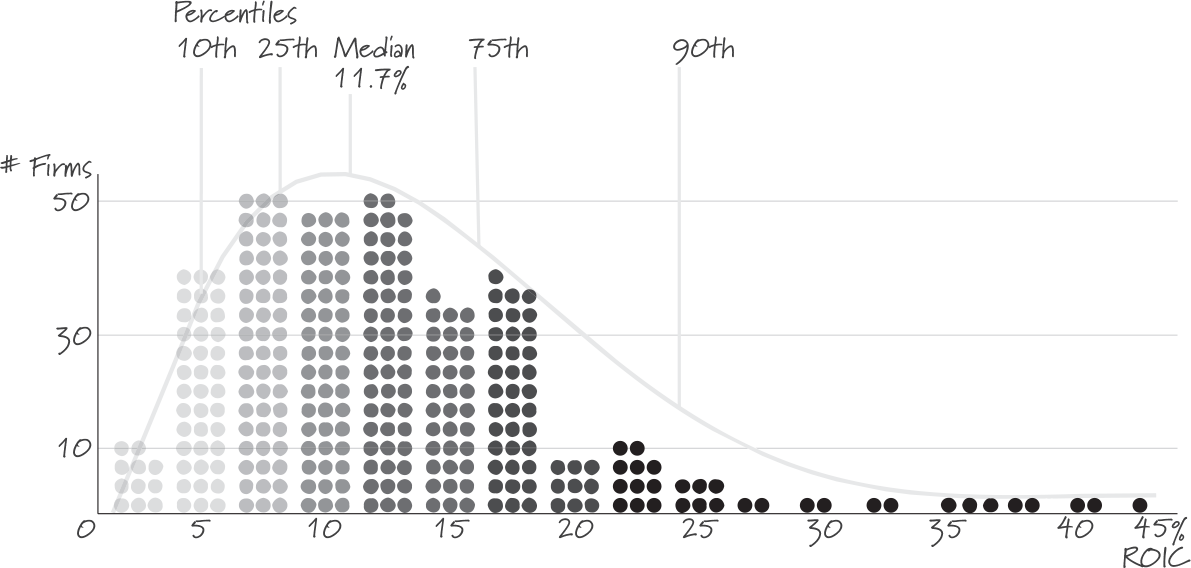
Figure 2-1 Return on invested capital (ROIC) of S&P 500 companies, 2009–2018
When I first studied this type of data, I was surprised by the large differences in performance. These are all large, well-known companies—think Microsoft, Boeing, CBS, FedEx, and Twitter. Yet it is remarkable how much an average firm (ROIC of 13.1 percent) could improve if it moved closer to the very best performers, companies like AutoZone (average ROIC of 41.9 percent), Colgate-Palmolive (37.6 percent), and Apple (32 percent).
To see true value creation, we need to compare the returns in figure 2-1 with the firm’s cost of capital.* An ROIC of 12 percent might seem quite attractive for a large firm with a steady cash flow. But it is probably insufficient to justify an investment in a risky startup. Looking at the difference between ROIC and the cost of capital, our insight remains unchanged. If the best performers—companies like Mastercard (whose ROIC exceeds the cost of capital by 23.5 percentage points), TJX Companies (23.2 percent), and Yum! Brands (19.5 percent)—provide any indication of what is possible, most firms have incredible opportunities for greater financial success.3
If these comparisons strike you as too optimistic, you are not alone. Can the average company really catch up to leading organizations? Do low performers truly have the potential to become at least average? In some instances, poor returns do reflect hard-to-change circumstances and factors that are beyond the control of executives. Your firm might be stuck in an industry with intense competition. You might do business in a country with less-affluent consumers and low prices. But it is all too easy to conclude that external conditions limit your potential. Even poorer countries show the same wide variation in performance that we observed for the United States (figure 2-2).4 True, India is less affluent than the United States, but India has a large number of companies with stellar financial performance. China’s markets are highly competitive, yet there are numerous firms whose returns far exceed their cost of capital. In every country I have studied, the data suggest that companies can earn exceptional returns even in the most challenging business environments.

Figure 2-2 Return on invested capital (ROIC) in various countries, 2009–2018
When I meet with executives whose companies achieve less-than-stellar performance, the typical conversation quickly turns to industry dynamics. They explain that their industry is disrupted by digital technology, how they face tough import competition, and why talent is difficult to hire and retain. The executives are right. Profitability can indeed change substantially from one industry to the next. Some industries are blessed with high average returns, others decidedly less so. Take, for instance, US insurance, a highly competitive industry (figure 2-3).5 Mean returns are close to zero (1.2 percent); the median insurance company destroys substantial value.*
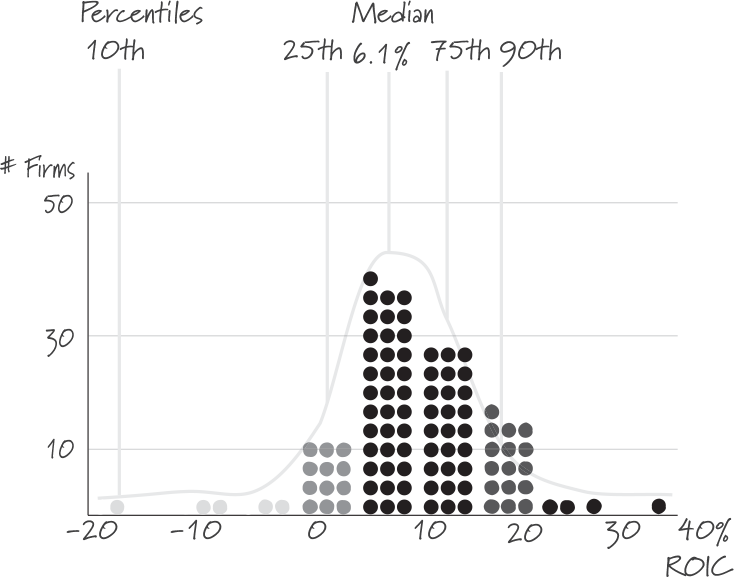
Figure 2-3 Return on invested capital (ROIC) in the US insurance industry, 2009–2018
But even in an industry as challenging as insurance, we observe stark differences in financial performance. Somehow it is possible to do well, and the best companies achieve remarkable returns in excess of 20 percent.
Insurance is not an exception. In industry after industry, the leading companies outperform their weaker siblings by substantial margins. Remember how Best Buy’s Hubert Joly paid more attention to differences in profitability in his industry than to differences across industries? There is a good reason for Joly’s focus. Figure 2-4 shows differences in ROIC within and across industries.6 The difference between leading and lagging companies in the same industry is typically far greater than the variation across industries.
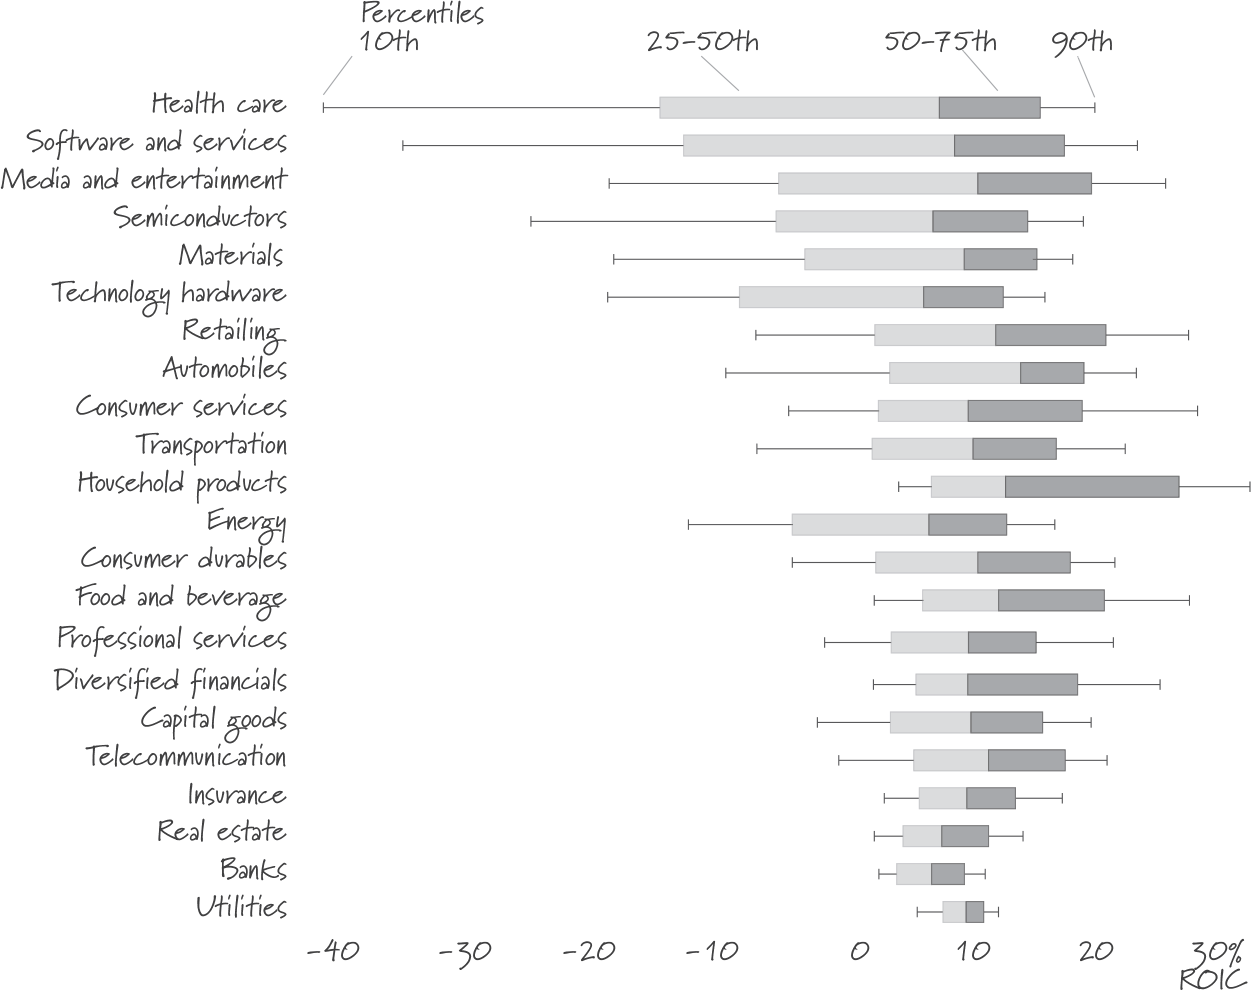
Figure 2-4 Return on invested capital (ROIC) in various US industries, 2009–2018
The industries shown in figure 2-4 are ordered from high variance (health care and software) to low variance (banks and utilities). To better understand Joly’s insight, let’s do a thought experiment using the financial data in figure 2-4. Take an average industry with 100 companies and rank them from most profitable (rank number one) to least profitable (rank number 100). Suppose your company is positioned 75th and you manage to jump to 25th place. With this advance, your ROIC would increase by 10.8 percentage points. Now imagine 100 industries, again ranked from most to least profitable. If your company were to leave the industry ranked 75th and join the industry ranked 25th, your ROIC would increase by a mere 4.5 percentage points.7 In other words, there is more than twice as much room to grow profitability inside an industry as opposed to across industries. From the standpoint of profitability, industries are fairly similar. Companies inside an industry, however, tend to be very different.
As interesting as it is to examine these measures of profitability, the figures tell us little about how well companies perform over time. To see whether firms can maintain a competitive advantage, I selected the best-performing companies in 2009—the top one-third of firms in figure 2-1—and tracked their financial results year after year (figure 2-5).
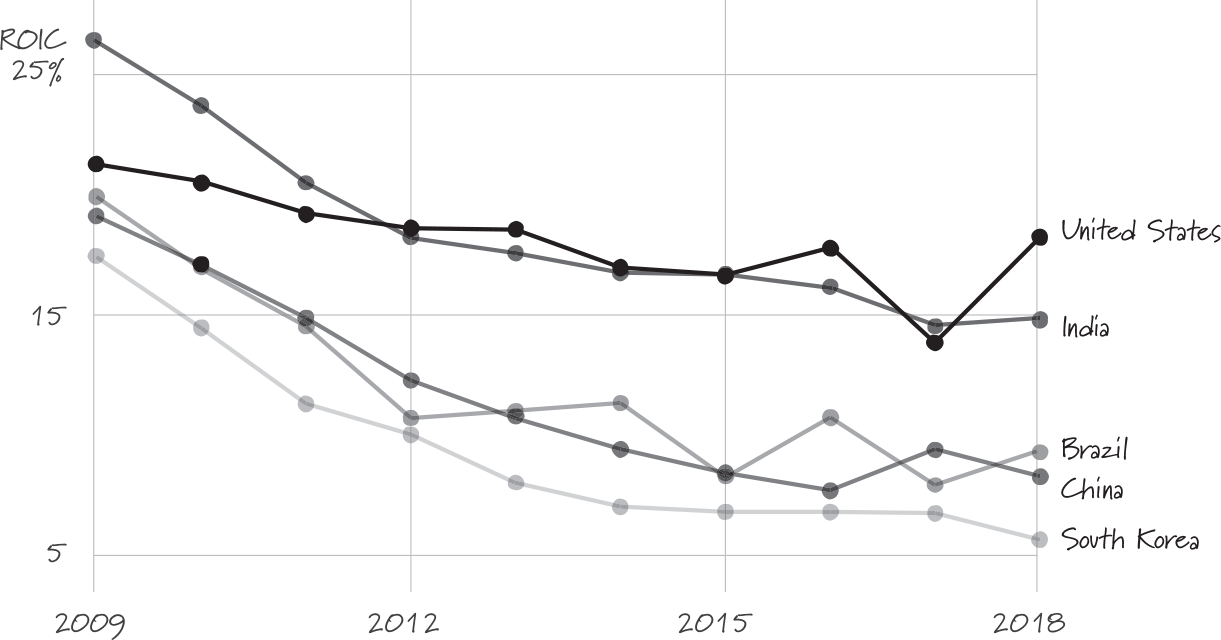
Figure 2-5 Return on invested capital (ROIC) for companies in the top third of the S&P 500 in 2009
Looking at star performers over time yields a glass half-full/glass half-empty story. The good news is that the most successful companies continue to outperform their rivals. Microsoft is a prime example. Long after the advent of personal computing, the company continues to deliver better than average results. In fact, Microsoft has been among the ten most valuable US companies every year for the past 20 years.8 By 2020, investors valued the firm at more than $1 trillion. On a more somber note, however, figure 2-5 shows that time is not kind to stellar companies (including Microsoft). Their ROIC declines year after year.
When I discuss these numbers with executives, few are surprised. Many believe that it has become far more difficult these days to hold on to a competitive advantage. Some even argue that it is quite pointless to make long-term plans in a hypercompetitive economy such as ours. Strategy, the argument goes, was useful in stable environments. But today, it is naive to think that you can successfully anticipate customer needs, technological breakthroughs, and competitive moves over long periods of time. In hypercompetitive environments, executives are resigned to aggressive short-term maneuvering, a practice that leads to fleeting competitive advantages—if you are lucky!9
The perception that competition is more heated than before is real, no doubt. But is it true? We can test this view by examining the speed of decline in financial performance in different periods of time. Do the curves in figure 2-5 decline more steeply than similar curves for earlier decades? They do not. Looking at changes in ROIC, I find little indication of hypercompetition. The performance of leading companies suffers over time, but the trend is no more pronounced today than it was at earlier points in time. More-sophisticated research comes to similar conclusions. Professor Gerry McNamara, who studies high-velocity markets, and his colleagues Paul Vaaler and Cynthia Devers conclude, “Managers today face markets no more dynamic and opportunities to gain and sustain competitive advantage no more challenging than in the past.”10

Seeing these broad patterns of financial performance, I hope you walk away as optimistic as I am. For nearly every company, substantial improvements in performance are within reach. Here is what I have learned from exploring the data.
- In every corner of the world economy, it is easy to find firms that are far more financially successful than others.
- Even after accounting for the influence of business cycles and country environments, we are left with significant differences in profitability across companies that operate in the same industry. If the financial success of leading firms provides any guidance, nearly every company can do better.
- Even modest advances have dramatic financial implications. If the US firm that ranked 50th (out of 100) jumped to rank 40, its ROIC would surge by 21 percent. If a Chinese firm improved in this way, its ROIC would grow by 16 percent.
- The potential for performance gains inside your industry is usually greater than the gains you should expect from entering a different industry. In a sea of opportunities, the most attractive prospects sit close to home.
- There is little evidence in the data that attaining stellar financial results over long periods has become more difficult.
So where do these differences in financial performance come from? What can we do to move up in the performance rankings? In the chapters that follow, we will look at a simple framework to guide our decisions.
I am grateful to James Zeitler, senior information research specialist at Baker Research Services, Harvard Business School, who expertly compiled the financial data in this chapter.