Chapter 5
Hardware in Computer-Aided Design
5.1 Introduction
Chapter 4 provided a general survey of computer-aided design. In the present chapter we examine the various hardware components that make up a modern CAD system.
Hardware components for computer-aided design are available in a variety of sizes, configurations, and capabilities. Hence it is possible to select a CAD system that meets the particular computational and graphics requirements of the user firm. Engineering firms that are not involved in production would choose a system exclusively for drafting and design-related functions. Manufacturing firms would choose a system to be part of a company-wide CAD/CAM system. Of course, the CAD hardware is of little value without the supporting software for the system, and we shall discuss the software for computer-aided design in the following chapter.
As indicated in Chapter 4, a modern computer-aided design system is based on interactive computer graphics (ICG). However, the scope of computer-aided design includes other computer systems as well. For example, computerized design has also been accomplished in a batch mode, rather than interactively. Batch design means that data are supplied to the system (a deck of computer cards is traditionally used for this purpose) and then the system proceeds to develop the details of the design. The disadvantage of the batch operation is that there is a time lag between when the data are submitted and when the answer is received back as output. With interactive graphics, the system provides an immediate response to inputs by the user. The user and the system are in direct communication with each other, the user entering commands and responding to questions generated by the system.
Computer-aided design also includes nongraphic applications of the computer in design work. These consist of engineering results which are best displayed in other than graphical form. Nongraphic hardware (e.g., line printers) can be employed to create rough images on a piece of paper by appropriate combinations of characters and symbols. However, the resulting pictures, while they may create interesting wall posters, are not suitable for design purposes.
The hardware we discuss in this chapter is restricted to CAD systems that utilize interactive computer graphics. Typically, a stand-alone CAD system would include the following hardware components:
One or more design workstations. These would consist of:
A graphics terminal
Operator input devices
One or more plotters and other output devices
Central processing unit (CPU)
Secondary storage
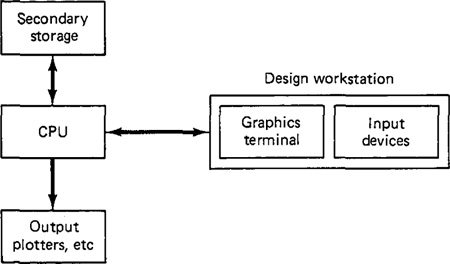
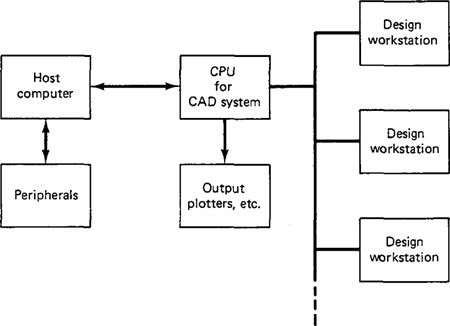
These hardware components would be arranged in a configuration as illustrated in Figure 5.1. The following sections discuss these various hardware components and the alternatives and options that can be obtained in each category.
Figure 5.1 Typical configuration of hardware components in a stand-alone CAD system. There would likely be more than one design workstation.
5.2 The Design Workstation
The CAD workstation is the system interface with the outside world. It represents a significant factor in determining how convenient and efficient it is for a designer to use the CAD system. The workstation must accomplish five functions [3]:
1. It must interface with the central processing unit.
2. It must generate a steady graphic image for the user.
3. It must provide digital descriptions of the graphic image.
4. It must translate computer commands into operating functions.
5. It must facilitate communication between the user and the system.
The use of interactive graphics has been found to be the best approach to accomplish these functions. A typical interactive graphics workstation would consist of the following hardware components:
A graphics terminal
Operator input devices
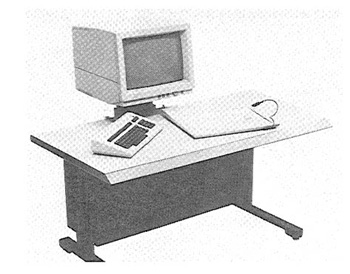
A graphics design workstation showing these components is illustrated in Figure 5.2.
Figure 5.2 Interactive graphics design workstation showing graphics terminal and two input devices: alphanumeric keyboard and electronic tablet and pen. (Courtesy of Applicon Inc.)
5.3 The Graphics Terminal
There are various technological approaches which have been applied to the development of graphics terminals. The technology continues to evolve as CAD system manufactures attempt to improve their products and reduce their costs. In this section we present a discussion of the current technology in interactive computer graphics terminals.
Image generation in computer graphics
Nearly all computer graphics terminals available today use the cathode ray tube (CRT) as the display device. Television sets use a form of the same device as the picture tube. The operation of the CRT is illustrated in Figure 5.3. A heated cathode emits a high-speed electron beam onto a phosphor-coated glass screen. The electrons energize the phosphor coating, causing it to glow at the points where the beam makes contact. By focusing the electron beam, changing its intensity, and controlling its point of contact against the phosphor coating through the use of a deflector system, the beam can be made to generate a picture on the CRT screen.
There are two basic techniques used in current computer graphics terminals for generating the image on the CRT screen. They are:
1. Stroke writing
2. Raster scan
Other names for the stroke-writing technique include line drawing, random position, vector writing, stroke writing, and directed beam. Other names for the raster scan technique include digital TV and scan graphics.
Figure 5.3 Diagram of cathode ray tube (CRT).
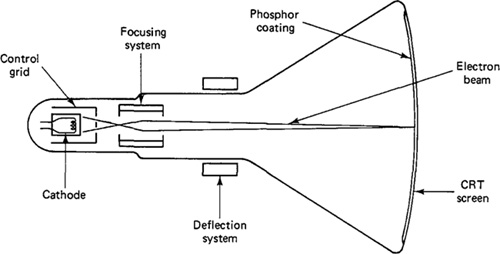
Figure 5.4 Stroke writing for generating images in computer graphics.
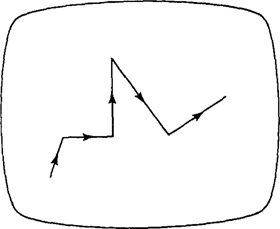
The stroke-writing system uses an electron beam which operates like a pencil to create a line image on the CRT screen. The image is constructed out of a sequence of straight-line segments. Each line segment is drawn on the screen by directing the beam to move from one point on the screen to the next, where each point is defined by its x and y coordinates. The process is portrayed in Figure 5.4. Although the procedure results in images composed of only straight lines, smooth curves can be approximated by making the connecting line segments short enough.
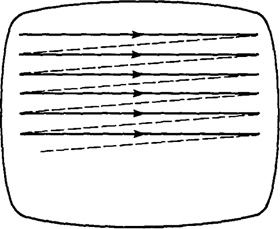
In the raster scan approach, the viewing screen is divided into a large number of discrete phosphor picture elements, called pixels. The matrix of pixels constitutes the raster. The number of separate pixels in the raster display might typically range from 256 x 256 (a total of over 65,000) to 1024 x 1024 (a total of over 1 000 000 points). Each pixel on the screen can be made to glow with a different brightness. Color screens provide for the pixels to have different colors as well as brightness. During operation, an electron beam creates the image by sweeping along a horizontal line on the screen from left to right and energizing the pixels in that line during the sweep. When the sweep of one line is completed, the electron beam moves to the next line below and proceeds in a fixed pattern as indicated in Figure 5.5. After sweeping the entire screen the process is repeated at a rate of 30 to 60 entire scans of the screen per second.
Figure 5.5 Raster scan approach for generating images in computer graphics.
Graphics terminals for computer-aided design
The two approaches described above are used in the overwhelming majority of current-day CAD graphics terminals. There are also a variety of other technical factors which result in different types of graphics terminals. These factors include the type of phosphor coating on the screen, whether color is required, the pixel density, and the amount of computer memory available to generate the picture. We will discuss three types of graphics terminals, which seem to be the most important today in commercially available CAD systems. The three types are:
1. Directed-beam refresh
2. Direct-view storage tube (DVST)
3. Raster scan (digital TV)
The following paragraphs describe the three basic types. We then discuss some of the possible enhancements, such as color and animation. A more thorough treatment of these graphics hardware technologies is given in Ref. [3], [4], and [7].
DLRECTED-BEAM REFRESH. The directed-beam refresh terminal utilizes the stroke-writing approach to generate the image on the CRT screen. The term “refresh” in the name refers to the fact that the image must be regenerated many times per second in order to avoid noticeable flicker of the image. The phosphor elements on the screen surface are capable of maintaining their brightness for only a short time (sometimes measured in microseconds). In order for the image to be continued, these picture tubes must be refreshed by causing the directed beam to retrace the image repeatedly. On densely filled screens (very detailed line images or many characters of text), it is difficult to avoid flickering of the image with this process. On the other hand, there are several advantages associated with the directed-beam refresh systems. Because the image is being continually refreshed, selective erasure and alteration of the image is readily accomplished. It is also possible to provide animation of the image with a refresh tube.
The directed-beam refresh system is the oldest of the modern graphics display technologies. Other names sometimes used to identify this system include vector refresh and stroke-writing refresh. Early refresh tubes were very expensive, but the steadily decreasing cost of solid-state circuitry has brought the price of these graphics systems down to a level which is competitive with other types.
DIRECT-VIEW STORAGE TUBE (DVST). DVST terminals also use the stroke-writing approach to generate the image on the CRT screen. The term “storage tube” refers to the ability of the screen to retain the image which has been projected against it, thus avoiding the need to rewrite the image constantly. What makes this possible is the use of an electron flood gun directed at the phosphor coated screen which keeps the phosphor elements illuminated once they have been energized by the stroke-writing electron beam. The resulting image on the CRT screen is flicker-free. Lines may be readily added to the image without concern over their effect on image density or refresh rates. However, the penalty associated with the storage tube is that individual lines cannot be selectively removed from the image.
Storage tubes have historically been the lowest-cost terminals and are capable of displaying large amounts of data, either graphical or textual. Because of these features, there are probably more storage tube terminals in service in industry at the time of this writing than any other graphics display terminal. The principal disadvantage of a storage CRT is that selective erasure is not possible. Instead, if the user wants to change the picture, the change will not be manifested on the screen until the entire picture is regenerated. Other disadvantages include its lack of color capability, the inability to use a light pen as a data entry device (we discuss the light pen in Section 5.4), and its lack of animation capability.
RASTER SCAN TERMINALS. Raster scan terminals operate by causing an electron beam to trace a zigzag pattern across the viewing screen, as described earlier. The operation is similar to that of a commercial television set. The difference is that a TV set uses analog signals originally generated by a video camera to construct the image on the CRT screen, while the raster scan ICG terminal uses digital signals generated by a computer. For this reason, the raster scan terminals used in computer graphics are sometimes called digital TVs.
The introduction of the raster scan graphics terminal using a refresh tube had been limited by the cost of computer memory. For example, the simplest and lowest-cost terminal in this category uses only two beam intensity levels, on or off. This means that each pixel in the viewing screen is either illuminated or dark. A picture tube with 256 lines of resolution and 256 addressable points per line to form the image would require 256 x 256 or over 65,000 bits of storage. Each bit of memory contains the on/off status of the corresponding pixel on the CRT screen. This memory is called the frame buffer or refresh buffer. The picture quality can be improved in two ways: by increasing the pixel density or adding a gray scale (or color). Increasing pixel density for the same size screen means adding more lines of resolution and more addressable points per line. A 1024 X 1024 raster screen would require more than 1 million bits of storage in the frame buffer. A gray scale is accomplished by expanding the number of intensity levels which can be displayed on each pixel. This requires additional bits for each pixel to store the intensity level. Two bits are required for four levels, three bits for eight levels, and so forth. Five or six bits would be needed to achieve an approximation of a continuous gray scale. For a color display, three times as many bits are required to get various intensity levels for each of the three primary colors: red, blue, and green. (We discuss color in the following section.) A raster scan graphics terminal with high resolution and gray scale can require a very large capacity refresh buffer. Until recent developments in memory technology, the cost of this storage capacity was prohibitive for a terminal with good picture quality. The capability to achieve color and animation was not possible except for very low resolution levels.
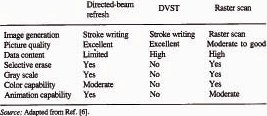
TABLE 5.1 Comparison of Graphics Terminal Features
It is now possible to manufacture digital TV systems for interactive computer graphics at prices which are competitive with the other two types. The advantages of the present raster scan terminals include the feasibility to use low-cost TV monitors, color capability, and the capability for animation of the image. These features, plus the continuing improvements being made in raster scan technology, make it the fastest-growing segment of the graphics display market.
Many of the important characteristics of the three types of graphics terminals are summarized in Table 5.1.
Color and animation in computer graphics
The capabilities for multicolored images and animated pictures in computer graphics are largely dependent on hardware considerations. Table 5.1 shows the relative capabilities for the three types of commercial graphics terminals for color and animation. This section briefly explores these two features.
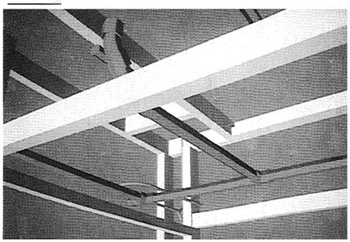
Since the late 1970s, there has been a growing appreciation for the opportunities and advantages provided by color graphics. Figures 5.6 through 5.10 are color plates taken from computer graphics screens. Figure 5.6 shows the improved clarity of information provided by color in displaying the results of a finite element analysis. Figure 4.7 shows the same image in black and white. Figure 5.7 shows a wire-frame model of a jet engine with different sections of the assembly displayed in various colors. Figure 5.8 illustrates a shaded model of an industrial building, showing parking lot, landscaping, and other details. The capabilities of interactive computer graphics would permit us to zoom in on certain sections of the structure, including interior layout of the plant. Figures 5.9 and 5.10 show two examples of solid modeling. (We discuss the topic of solid modeling in Chapter 6.) Figure 5.9 shows the same yoke as in Figure 4.6 but with several components assembled to it, all displayed in various colors. Figure 5.10 illustrates a welded frame assembly for a water-cooled power frame. Cable and piping are shown in different colors. A solid computer model such as this would be helpful for interference checking in various types of process plants. As indicated by these figures, the use of color in
Figure 5.6 Finite-element analysis results displayed in color. (Courtesy of Applicon Inc.)
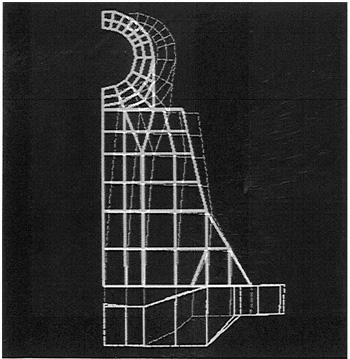
Figure 5.7 Wire-frame model of a jet engine. (Courtesy of Computervision Corp.)
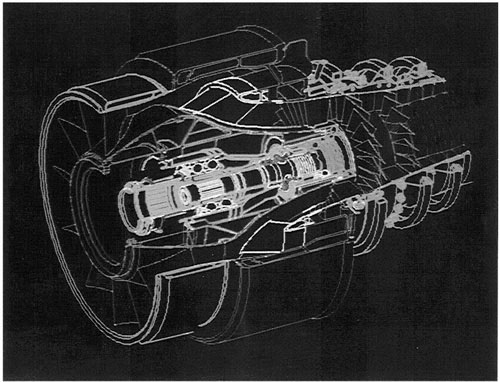
Figure 5.8 Color display of industrial plant. (Courtesy of Computervision Corp.)
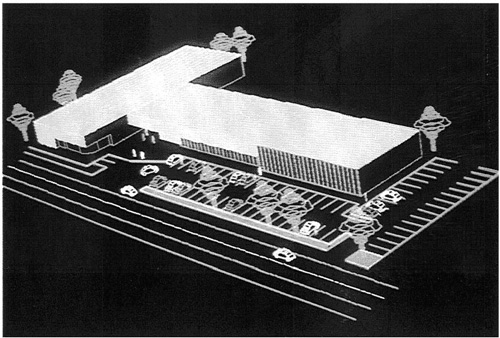
Figure 5.9 Color solid model of yoke assembly. (Courtesy of Computervision Corp.)
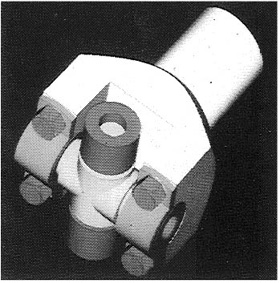
Figure 5.10 Color graphics for display of pipes and cables in steel frame. (From W. Fitzgerald, F. Gracer, and R. Wolfe, “GRIN: Interactive Graphics for Modeling Solids,” IBM Journal of Research and Development, Vol. 25, No. 4, July, 1981. Copyright 1981 by International Business Machines Corporation; reprinted with permission.)
the graphics display allows significantly more information to be clearly communicated to the viewer.
The typical color CRT uses three electron beams and a triad of color dots on the phosphor screen to provide each of the three colors, red, green, and blue. By combining the three colors at different intensity levels, a variety of colors can be created on the screen. It is more difficult to fabricate a stroke-writing tube which is precise enough for color because of the technical problem of getting the three beams to converge properly against the screen.
The raster scan approach has superior color graphics capabilities because of the developments which have been made over the years in the color television industry. Color raster scan terminals with 1024 x 1024 resolution are commercially available for computer graphics. The problem in the raster terminals is the memory requirements of the refresh buffer. Each pixel on the viewing screen may require up to 24 bits of memory in the refresh buffer in order to display the full range of color tones. When multiplied by the number of pixels in the display screen, this translates into a very large storage buffer.
The capability for animation in computer graphics is limited to display methods in which the image can be quickly redrawn. This limitation excludes the storage tube terminals. Both the directed-beam refresh and the raster scan systems are capable of animation. However, this capability is not automatically acquired with these systems. It must be accomplished by means of a powerful and fast CPU interfaced to the graphics terminal to process the large volumes of data required for animated images. In computer-aided design, animation would be a powerful feature in applications where kinematic simulation is required. The analysis of linkage mechanisms and other mechanical behavior would be examples. In computer-aided manufacturing, the planning of a robotic work cycle would be improved through the use of an animated image of the robot simulating the motion of the arm during the cycle. The popular video games marketed by Atari and other manufacturers for use with home TV sets are primitive examples of animation in computer graphics. Animation in these TV games is made possible by sacrificing the quality of the picture. This keeps the price of these games within an affordable range.
5.4 Operator Input Devices
Operator input devices are provided at the graphics workstation to facilitate convenient communication between the user and the system. Workstations generally have several types of input devices to allow the operator to select the various preprogrammed input functions. These functions permit the operator to create or modify an image on the CRT screen or to enter alphanumeric data into the system. This results in a complete part on the CRT screen as well as a complete geometric description of the part in the CAD data base.
Different CAG system vendors offer different types of operator input devices. These devices can be divided into three general categories:
2. Digitizers
3. Alphanumeric and other keyboard terminals
Of the three, cursor control devices and digitizers are both used for graphical interaction with the system. Keyboard terminals are used as input devices for commands and numerical data.
There are two basic types of graphical interaction accomplished by means of cursor control and digitizing:
Creating and positioning new items on the CRT screen
Pointing at or otherwise identifying locations on the screen, usually associated with existing images
Ideally, a graphical input device should lend itself to both of these functions. However, this is difficult to accomplish with a single unit and that is why most workstations have several different input devices.
Cursor control
The cursor normally takes the form of a bright spot on the CRT screen that indicates where lettering or drawing will occur. The computer is capable of reading the current position of the cursor. Hence the user’s capability to control the cursor position allows locational data to be entered into the CAD system data base. A typical example would be for the user to locate the cursor to identify the starting point of a line. Another, more sophisticated case, would be for the user to position the cursor to select an item from a menu of functions displayed on the screen. For instance, the screen might be divided into two sections, one of which is an array of blocks which correspond to operator input functions. The user simply moves the cursor to the desired block to execute the particular function.
There are a variety of cursor control devices which have been employed in CAD systems. These include:
Thumbwheels
Direction keys on a keyboard terminal
Joysticks
Tracker ball
Light pen
Electronic tablet/pen
The first four items in the list provide control over the cursor without any direct physical contact of the screen by the user. The last two devices in the list require the user to control the cursor by touching the screen (or some other flat surface which is related to the screen) with a pen-type device.
The thumbwheel device uses two thumbwheels, one to control the horizontal position of the cursor, the other to control the vertical position. This type of device is often mounted as an integral part of the CRT terminal. The cursor in this arrangement is often represented by the intersection of a vertical line and a horizontal line displayed on the CRT screen. The two lines are like crosshairs in a gunsight which span the height and width of the screen.
Direction keys on the keyboard are another basic form of cursor control used not only for graphics terminals but also for CRT terminals without graphics capabilities. Four keys are used for each of the four directions in which the cursor can be moved (right or left, and up or down).
The joystick apparatus is pictured in Figure 5.11. It consists of a box with a vertical toggle stick that can be pushed in any direction to cause the cursor to be moved in that direction. The joystick gets its name from the control stick that was used in old airplanes.
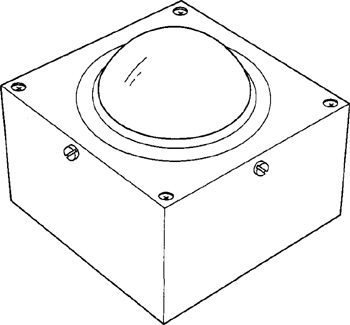
The tracker ball is pictured in Figure 5.12. Its operation is similar to that of the joystick except that an operator-controlled ball is rotated to move the cursor in the desired direction on the screen.
The light pen is a pointing device in which the computer seeks to identify the
Figure 5.11 Joystick input device for interactive computer graphics. (Adapted with permission from Machover [6].)
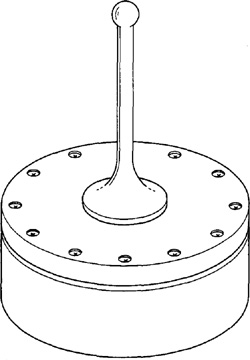
Figure 5.12 Tracker ball input device for interactive computer graphics. (Adapted with permission from Machover [6].)
position where the light pen is in contact with the screen. Contrary to what its name suggests, the light pen does not project light. Instead, it is a detector of light on the CRT screen and uses a photodiode, phototransistor, or some other form of light sensor. The light pen can be utilized with a refresh-type CRT but not with a storage tube. This is because the image on the refresh tube is being generated in time sequence. The time sequence is so short that the image appears continuous to the human eye. However, the computer is capable of discerning the time sequence and it coordinates this timing with the position of the pen against the screen. In essence, the system is performing as an optical tracking loop to locate the cursor or to execute some other input function. Figure 5.13 illustrates the use of the light pen.
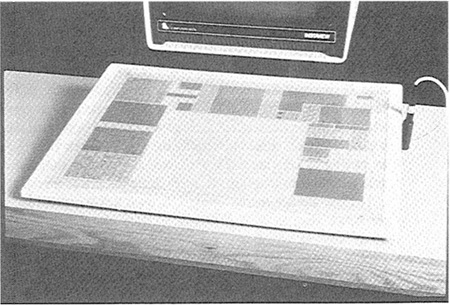
The tablet and pen in computer graphics describes an electronically sensitive tablet used in conjunction with an electronic stylus. The tablet is a flat surface, separate from the CRT screen, on which the user draws with the penlike stylus to input instructions or to control the cursor. This form of input is illustrated in Figure 5.14.
It should be noted that thumbwheels, direction keys, joysticks, and tracker balls are generally limited in their functions to cursor control. The light pen and tablet/pen are typically used for other input functions as well as cursor control. Some of these functions are:
Selecting from a function menu
Drawing on the screen or making strokes on the screen or tablet which indicate what image is to be drawn
Selecting a portion of the screen for enlargement of an existing image
Figure 5.13 Light pen as input device for interactive computer graphics. (Courtesy of McDonnell-Douglas Automation Company.)
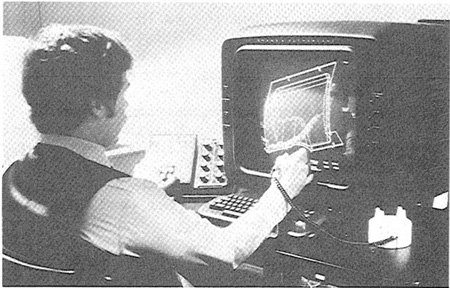
Figure 5.14 Electronic tablet and pen. (Courtesy of Computervision Corp.
Digitizers
The digitizer is an operator input device which consists of a large, smooth board (the appearance is similar to a mechanical drawing board) and an electronic tracking device which can be moved over the surface to follow existing lines. It is a common technique in CAD systems for taking x, y coordinates from a paper drawing. The electronic tracking device contains a switch for the user to record the desired x and y coordinate positions. The coordinates can be entered into the computer memory or stored on an off-line storage medium such as magnetic tape. High-resolution digitizers, typically with a large board (e.g., 42 in. by 60 in.) can provide resolution and accuracy on the order of 0.001 in. It should be mentioned that the electronic tablet and pen, previously discussed as a cursor control device, can be considered to be a small, low-resolution digitizer.
Not all CAD systems would include a digitizer as part of its core of operator input devices. It would be inadequate, for example, in three-dimensional mechanical design work since the digitizer is limited to two dimensions. For two-dimensional drawings, drafters can readily adapt to the digitizer because it is similar to their drafting boards. It can be tilted, raised,or lowered to assume a comfortable position for the drafter.
The digitizer can be used to digitize line drawings. The user can input data from a rough schematic or large layout drawing and edit the drawing to the desired level of accuracy and detail. The digitizer can also be used to freehand a new design, with subsequent editing to finalize the drawing.
Keyboard terminals
Several forms of keyboard terminals are available as CAD input devices. The most familiar type is the alphanumeric terminal, which is available with nearly all interactive graphics systems. The alphanumeric terminal can be either a CRT or a hard-copy terminal, which prints on paper. For graphics, the CRT has the advantage because of its faster speed, the ability to easily edit, and the avoidance of large volumes of paper. On the other hand, a permanent record is sometimes desirable and this is most easily created with a hard-copy terminal. Many CAD systems use the graphics screen to display the alphanumeric data, but there is an advantage in having a separate CRT terminal so that the alphanumeric messages can be created without disturbing or overwriting the image on the graphics screen.
The alphanumeric terminal is used to enter commands, functions, and supplemental data to the CAD system. This information is displayed for verification on the CRT or typed on paper. The system also communicates back to the user in a similar manner. Menu listings, program listings, error messages, and so forth, can be displayed by the computer as part of the interactive procedure. An example of an alphanumeric keyboard is shown in Figure 5.2 with an electronic tablet/pen and a graphics CRT terminal.
Some CAD systems make use of special function keyboards, as pictured in Figure 5.15. These function keyboards are provided to eliminate extensive typing of commands, or calculate coordinate positions, and other functions. The number of function keys varies from about 8 to 80. The particular function corresponding with each button is generally under computer control so that the button function can be changed as the user proceeds from one phase of the design to the next. In this way the number of alternative functions can easily exceed the number of but-
Figure 5.15 Special function keyboard for interactive computer graphics. (Courtesy of McDonnell-Douglas Automation Company.)
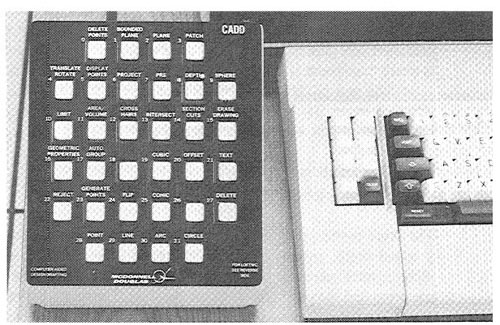
tons on the keyboard. Also, lighted buttons are used on the keyboards to indicate which functions are possible in the current phase of design activity. A menu of the various function alternatives is typically displayed on the CRT screen for the user to select the desired function.
5.5 Plotters and Other Output Devices
There are various types of output devices used in conjunction with a computer-aided design system. These output devices include:
Pen plotters
Hard-copy units
Electrostatic plotters
Computer-output-to-microfilm (COM) units
We discuss these devices in the following sections.
Pen plotters
The accuracy and quality of the hard-copy plot produced by a pen plotter is considerably greater than the apparent accuracy and quality of the corresponding image on the CRT screen. In the case of the CRT image, the quality of the picture is degraded because of lack of resolution and because of losses in the digital-to-analog conversion through the display generators. On the other hand, a high-precision pen plotter is capable of achieving a hard-copy drawing whose accuracy is nearly consistent with the digital definitions in the CAD data base.
The pen plotter uses a mechanical ink pen (either wet ink or ballpoint) to write on paper through relative movement of the pen and paper. There are two basic types of pen plotters currently in use:
Drum plotters
Flat-bed plotters
The drum plotter, pictured in Figure 5.16, is generally the least expensive. It uses a round drum, usually mounted horizontally, and a slide which can be moved along a track mounted axially with respect to the drum. The paper is attached to the drum and the pen is mounted on the slide. The relative motion between pen and paper is achieved by coordinating the rotation of the drum with the motion of the slide. The drum plotter is fast and it can make drawings of virtually unlimited length. The width, however, is limited by the length of the drum. These lengths typically range between 8½ in. (216 mm) and 42 in. (1067 mm).
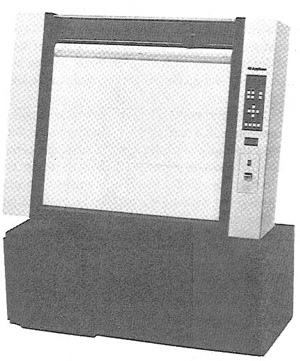
The flat-bed plotter, illustrated in Figure 5.17, is more expensive. It uses a flat drawing surface to which the paper is attached. On some models, the surface is horizontal, while other models use a drawing surface which is mounted in a nearly vertical orientation to conserve floor space. This type is shown in Figure 5.18. Parallel tracks are located on two sides of the flat surface. A bridge is driven along these tracks to provide the x-coordinate motion. Attached to the bridge is another track, on which rides a writing head. Movement of the writing head relative to the
Figure 5.16 Drum plotter. (Reprinted with permission from Machover [6].
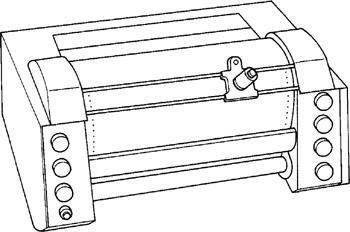
Figure 5.17 Flat-bed x-y plotter in near-vertical postion. (Courtesy of Gerber Scientific Instrument Company.)
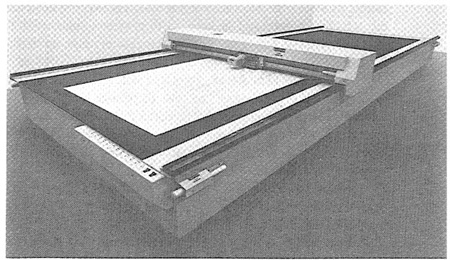
Figure 5.18 Belt-bed plotter in near-vertical position. (Courtesy of Applicon Inc.)
bridge produces the y-coordinate motion. The writing head carries the pen or pencil, which can be raised or lowered to provide contact with the paper as desired. The size of these automated drafting tables can range up to roughly 5 ft (1.5 m) by 20 ft (6.1 m) with plotting accuracies approaching ±0.001 in. (±0.025 mm).
The pen plotter accepts digitized data either on-line from the computer or off-line in the form of magnetic tape or punched tape. On modern pen plotters, a microprocessor is often used as the control unit. This allows certain shapes, such as circles and ellipses, to be programmed in the form of simple instructions to the plotter. In this way the digital data for a complicated shape can be made more compact and efficient.
Many plotters work with several pens of different colors to achieve multicolor plots. Also, in some models, the pen may be replaced by a highly focused, high-intensity light and the conventional drafting paper by a photosensitive paper. This arrangement would be used for certain artwork applications. Another option available on a flat-bed plotter is to combine the plotter function with the operation of a digitizer (previously discussed as an operator input device in Section 5.4). Such a device is called a digitizer-plotter.
Hard-copy unit
A hard-copy unit is a machine that can make copies from the same image data displayed on the CRT screen. The image on the screen can be duplicated in a matter of seconds. The copies can be used as records of intermediate steps in the design process or when rough hard copies of the screen are needed quickly. The hard copies produced from these units are not suitable as final drawings because the accuracy and quality of the reproduction is not nearly as good as the output of a pen plotter.
Most hard-copy units are dry silver copiers that use light-sensitive paper exposed through a narrow CRT window inside the copier. The window is typically 8½in. (216 mm), corresponding to the width of the paper, by about ½in. (12 mm) wide. The paper is exposed by moving it past the window and coordinating the CRT beam to gradually transfer the image. A heated roller inside the copier is used to develop the exposed paper. The size of the paper is usually limited on these hard-copy units to 8½ by 11 in. Another drawback is that the dry silver copies will darken with time when they are left exposed to normal light.
Electrostatic plotters
Hard-copy units are relatively fast but their accuracy and resolution are poor. Pen plotters are highly accurate but plotting time can take many minutes (up to a half-hour or longer for complicated drawings). The electrostatic plotter offers a compromise between these two types in terms of speed and accuracy. It is almost as fast as the hard-copy unit and almost as accurate as the pen plotter.
The electrostatic copier consists of a series of wire styli mounted on a bar which spans the width of the charge-sensitive paper. The styli have a density of up to 200 per linear inch. The paper is gradually moved past the bar and certain styli are activated to place dots on the paper. By coordinating the generation of the dots with the paper travel, the image is progressively transferred from the data base into hard-copy form. The dots overlap each other slightly to achieve continuity. For example, a series of adjacent dots gives the appearance of a continuous line.
A limitation of the electrostatic plotter is that the data must be in the raster format (i.e., in the same format used to drive the raster-type CRT) in order to be readily converted into hard copy using the electrostatic method. If the data are not in raster format, some type of conversion is required to change them into the required format. The conversion mechanism is usually based on a combination of software and hardware.
An advantage of the electrostatic plotter which is shared with the drum-type pen plotter is that the length of the paper is virtually unlimited. Typical plotting widths might be up to 6 ft (1.83 m). Another advantage is that the electrostatic plotter can be utilized as a high-speed line printer, capable of up to 1200 lines of text per minute.
Computer-output-to-microfilm (COM) units
COM units reproduce the drawings on microfilm rather than as full-size engineering drawings. It is an expensive piece of equipment with a current price of around $300,000. However, for the large corporation able to afford a COM unit, there are several important advantages. One advantage is storage capability. A large engineering department may have tens of thousands of engineering drawings to be stored. Reducing the size of each drawing to microfilm achieves a significant storage benefit. If a full-size hard-copy drawing is ever required, the microfilm can be easily retrieved to be photographically enlarged to full size. Another advantage is speed. COM units produce a microfilm copy much faster than a pen plotter, perhaps several hundred times faster for a complicated line drawing. Computer-output-to-microfilm is also faster than electrostatic plotters.
Disadvantages of the COM process are that the user cannot write notes on the microfilm as is possible with a paper copy. Also, enlargements of the microfilm onto paper, although adequate, are not of as high quality as the output from a pen plotter.
5.6 The Central Processing Unit
The CPU operates as the central “brain” of the computer-aided design system. It is typically a minicomputer. It executes all the mathematical computations needed to accomplish graphics and other functions, and it directs the various activities within the system. These activities include:
Managing the design workstations (operator inputs, editing, etc.)
Directing plotters in the generation of engineering drawings
Copying data currently on disk onto magnetic tapes for semiactive storage
Reading magnetic tapes containing drawing data for possible revision or other use
Transmitting data to and from other larger computers
The computer in a CAD system must be capable of a wide variety of both graphical and nongraphical functions.
Most CAD systems use CPUs purchased from commercial computer companies such as Digital Equipment Corporation, Data General, and Hewlett-Packard. Computervision Corporation is a notable exception to this rule. Its CAD systems use CPUs designed and built within the company.
At the time of this writing, most of the CAD minicomputers use a 16-bit word. However, there is a very definite trend toward the use of 32-bit CPUs in commercial CAD systems. There are several advantages which advocate the use of 32-bit processors. These include greater speed, greater accuracy, and more addressable memory. These advantages permit programs of greater complexity to be executed efficiently on the system. Many FORTRAN programs, for example, are written to be run on 32-bit processors. Primary storage capacity for a stand-alone CAD system can range up to several million characters of memory. More typical values for today’s systems would be around 256,000 characters for today’s 16-bit systems.
There are several factors related to computer and storage technology which are appropriate to mention in this discussion. First, the cost of computers and computer memory continues to decrease as the technology develops. This will permit future CAD systems to use more powerful computers and greater memory capacity.
Second, CAD systems would normally use secondary storage units to reduce the cost of more expensive main memory. We discuss secondary storage for computer-aided design in Section 5.7.
Third, many CAD systems have their CPUs connected to larger mainframe computers (often called the host computer) to gain access to greater computational and memory capacity. This arrangement is illustrated in Figure 5.19. The host computer is called in to execute complex engineering and numerical analysis which would overburden the CAD system CPU. When the analysis is completed by the large computer, the results are downloaded to the graphics system for display and possible hard-copy output. This procedure allows each computer (the larger host and the smaller graphics CPU) to function in what it does best. Some computer-aided design systems use “intelligent” terminals in a distributed computing system. Each terminal contains a microprocessor which functions as a small CPU for that terminal. This CPU can handle many of the user input commands, and would only require access to the host computer for plotting, output, and access
Figure 5.19 Configuration of host-satellite CAD system.
to secondary storage. In this configuration the host computer could service perhaps a dozen intelligent terminals since it would be relieved of many of the computational requirements of a conventional CAD system. Rao et al. [8] report the results of a study performed at McDonnell-Douglas Automation Company (McAuto) which compared the speed and performance of a distributed graphics system (using intelligent terminals) to those of the conventional centralized configuration (using “dumb” terminals). After adjusting for other differences in hardware between the two systems, they found that the distributed system had more than a 40% improvement in operating cost and performance. Of course, a distributed system would probably have a higher initial cost because of the more expensive intelligent terminals.
5.7 Secondary Storage
In addition to primary computer storage, secondary storage capacity is provided in a computer-aided design system. This usually takes the form of magnetic disk and magnetic tape. The purpose in using secondary storage is to reduce the cost of main computer memory. The secondary storage can be used for engineering drawing files, CAD software which can be transferred to main memory as needed, and temporary files for CPU output which will be downloaded to individual graphics terminals, plotters, or other output devices.
Magnetic disks are typically used for the CAD system software and the CAD data base (engineering drawings). Disks have the advantage of fairly rapid retrieval, owing to their random access configuration. Because of this feature, the CPU can load and swap programs and files between primary and secondary memory as needed.
Magnetic tape would be used for storing programs and files which are less frequently used by the system. Storage on magnetic tape is less expensive than on disks; however, the access time is significantly longer because data are stored sequentially (refer to Table 2.2). Magnetic tape would be suitable for disk backup, permanent archival files, and data transfer to output devices or other computers.
References
[1] BESANT, C. B., Computer-Aided Design and Manufacture, Ellis Horwood Ltd., Chichester, England, 1980.
[2] CHASEN, S. H., AND DOW, J. W., The Guide for Evaluation and Implementation of CAM Systems, CAD/CAM Decisions, Atlanta, Ga., 1979
[3] FOLEY, J. D., AND VAN DAM, A., Fundamentals of Interactive Computer Graphics, Addision-Wesley Publishing Co., Inc., Reading, Mass., 1982.
[4] HOBBS, L. C., “Computer Graphics Display Hardware,” IEEE Computer Graphics and Applications, January, 1981, pp. 25–39.
[5] LERRO, J. P., JR., “CAD/CAM System: More than an Automated Drafting Tool,” Design News, November 17, 1980.
[6] MACHOVER, C., “What Are the Tools?” in The CAD/CAM Handbook (C. Machover and R. E. Blauth, Eds.), Computervision Corp., Bedford, Mass., 1980, pp. 17–45.
[7] NEWMAN, W., AND SPROUL, R., Principles of Interactive Computer Graphics, 2nd ed., McGraw-Hill Book Company, New York, 1979.
[8] RAO, J. R., WINTERS, W. F., AND SCHMIDT, L. D., “Performance Evaluation of a Test Distributed Graphics System,” technical paper presented at IEEE Computer Society’s Third International Computer Software and Applications Conference, Chicago, November, 1979.
[9] RYAN, D. L., Computer-Aided Graphics and Design, Marcel Dekker, Inc., New York, 1979.
[10]SCHAFFER, G., “Computer Graphics Goes to Work,” Special Report 724, American Machinist, July, 1980, pp. 149–164.
[11]ZEMMERS, E. W., JR, Computer-Aided Design Module, General Electric CAD/CAM Seminar, Lehigh University, Bethlehem, Pa., 1982.
[12]ZIMMERS, E. W., JR. AND PLEBANI, L. J., “Using a Turnkey Graphics System in Computer Integrated Manufacturing,” Industrial Engineering, November, 1981, pp. 98–104.
Problems
5.1. The hardware components of a computer-aided design system are to be specified for the two cases cited below. The particular CAD/CAM vendor need not be identified, but the number of terminals, types of input devices, and types of output devices should be specified. Also, will the CPU be stand-alone or connected to a larger host computer? It is important to maintain a high benefit/cost ratio in the selection of hardware. Explain and justify your specifications. The two cases are:
(a) An engineering firm with seven mechanical designers and 12 drafters. The firm designs mechanical equipment for client companies, which fabricate the equipment. It is important that the engineering drawings be clear and of high quality.
(b) A manufacturing firm which produces products in high volume for the public. The design engineering staff consists of 10 mechanical and electrical engineers.
5.2. For each of the following situations, identify which of the three types of graphics terminals would be most appropriate. Explain your selection by reference to the comparison features listed in Table 5.1.
(a) In the first situation, there is the requirement to display large amounts of textual output.
(b) In the second case, it is necessary to perform kinematic analysis of automobile door hinges.
(c) In the third application, it is desired to perform stress analysis and to display the before and after strain effects at the same time.
(d) In the fourth case, the quality and resolution of the image must be very high. There will be a large amount of graphical data displayed on the screen.