1.1. Your Project Starts Here
Your Client
Nestled amongst the soft green hills of the English Midlands is the market town of Nuffield-on-the-Moor. A good place to start exploring the town is from the river. Cross Upminster Bridge and walk through Stonebridge Park until you come to the Elephant and Castle public house. Turn left here and you’ll find yourself in a large cobbled square. This is the market square, and, today being Wednesday, it is crowded with farmers, artisans, housewives, and children from the surrounding districts. Today is market day.
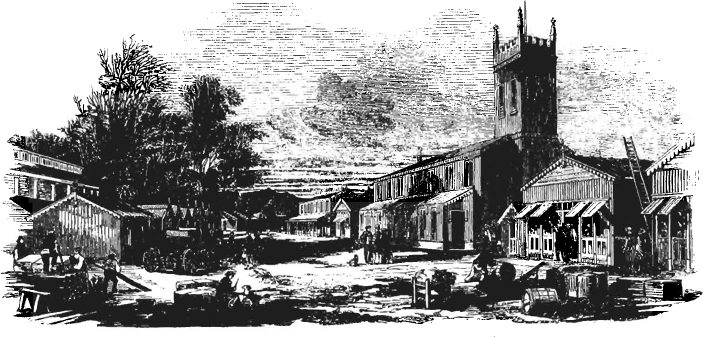
Walk around the market and sample some of the regional products. See the homemade, unpasteurized green cheese, taste the fresh pepper pickles, buy a dozen smoked quail eggs, try a pint of freshly brewed malt ale, or buy a hand-thrown Nuffield pot as a souvenir. When you have eaten and drunk your fill, look around the charming Norman church in the southeast corner of the square. The church warden will lend you the key to the bell tower. Now climb the one hundred and forty-two steps to the top of the tower. You may get out of breath, but it’s worth the effort. Spread below you are some of the richest farmlands and prettiest villages in England.
However, green fields are not all you can see. In the distance, the factory chimneys, cooling towers, motorways, and all the other clutter of industrial complexes and large towns bring you back to the twentieth century. Now turn your attention to the west. Perched at the top of Nuffield hill, you can see the Piccadilly Television transmission tower.
Piccadilly Television holds the franchise for this part of the Midlands of England. Nuffield-on-the-Moor is located at the geographic center of Piccadilly’s franchise area, so by locating the transmission tower here, Piccadilly ensures that all the households in the area get good television reception.
A franchise entitles the holder to be the sole transmitter of television programmes and commercials within a defined geographical area. While a franchise holder has a monopoly in one region, most products are advertised nationally. A commercial television company is therefore competing with companies in other regions for a share of an advertiser’s national budget. This is a very competitive business, and that is the reason you’re here in Nuffield-on-the-Moor: Piccadilly is about to launch a project with the objective of building a new computer system to help get more of the advertisers’ money. The new system must be the best in the industry to give it an edge on the other commercial television franchise holders. Piccadilly management has decided that the best way to take maximum advantage of the latest technology is to have the project team study most of Piccadilly’s operations. The final decision on what is to be computerized will be made when the analysis is complete.
You are the chief systems analyst on the project. To help you get started, Piccadilly has provided some background material on how the British television industry works. Read through it, then we’ll discuss ways to tackle the project.
Introducing the British Television Industry
The Broadcasting Board has the authority to issue an eight-year franchise to a commercial television company. As the franchise holder is the only commercial broadcaster, the Board imposes strict conditions on programming standards. There is a defined balance between drama, comedy, children’s programmes, sports, and other types of entertainment. There are also rules about what sort of programmes can be transmitted at certain times, and more rules about the content of programmes and commercials. These rules are taken very seriously. Any franchise holder who does not abide by the rules is in danger of losing the franchise and hence the whole of the business. This may sound pretty tough, until you know what a franchise does for the holder.
A franchise means that a television company is the only supplier of broadcast commercial airtime within its area. If an advertising agency wants to reach an audience in the Midlands, Piccadilly is the only source of supply. There are cable and satellite stations active in the same area, but broadcast television commands the lion’s share of the audience. Commercial airtime is expensive, and while having a franchise is often likened to a license to print money, the franchise holder’s rates must be competitive to attract its share of the national advertising budgets.
The success of a commercial television company depends upon its ability to sell advertising. Before spending money with Piccadilly, advertisers must believe that people will watch Piccadilly Television’s programmes and the commercials broadcast along with them. Selling advertising, then, is all about convincing advertisers that enough of the people likely to buy their product will watch Piccadilly’s programmes.
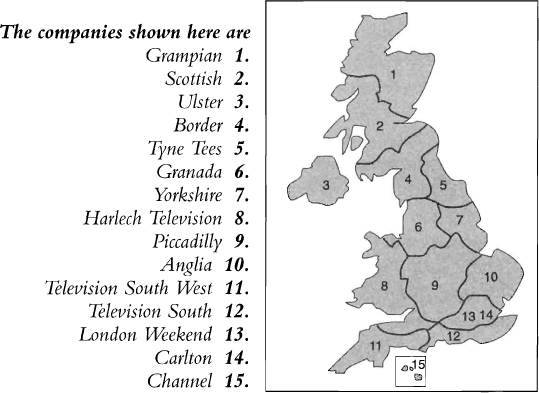
Figure 1.1.2: Great Britain is divided into fifteen transmission areas. The franchise for each area is held by one commercial television franchise holder.
Here’s how it works. Let’s say that an advertising agency is running a television campaign for a product targeted at homemakers. Remember that each of the fifteen television companies is restricted to a specified transmission area. If the advertising agency wants to reach householders in the south of England, the agency must spread the budget over the five television companies operating in that part of England. These companies are competing for a share of the agency’s advertising budget. The one that can offer the largest numbers of householders watching its programmes and that can sell time at the most attractive rates will get the biggest share of the budget.
Audience measurement bureaus track the number of viewers of each of the television channels, with a combination of questionnaires, surveys, and electronic monitoring equipment. These audience numbers, or ratings, are analyzed by programme type, audience type, time of day, television company, and any other break down that makes the ratings salable to the television companies. Every week, the bureaus provide the ratings to the television sales executives who use the information as ammunition for selling airtime to the advertising agencies.

But just having the numbers is not all there is to it. The same advertising time slot can be sold for a number of different rates and, naturally enough, the advertising agency wants to pay the cheapest one. However, it doesn’t always pay to be a cheapskate. Some of the cheapest rates are sold on the basis that another buyer who is willing to pay more for the time can preempt the first buyer. This results in the first buyer’s losing advertising time that might be a key element in a campaign. The rate structure for selling commercial television time is complex, and discovering all its intricacies is an analysis treat that lies ahead of you.
There are all sorts of rules about when certain advertisements may or may not be shown. For instance, alcohol advertisements may be shown only after 9 p.m. If an actor is in a programme, a commercial containing the same actor may not appear within the forty-five minutes preceding or following the programme. If an advertisement for floor cleaner is broadcast, then no other floor cleaner advertisements may appear within the same commercial break. As you work on the project, you will come across other rules like this. Keep in mind that the Broadcasting Board can, and probably will, change any of these rules at any time.
How to Do Your Project
You are about to start an exciting project for Piccadilly Television. Your task is to analyze the requirements for a new system, whose principal activity is selling commercial television airtime.
This project is based on a real analysis that we did for one of the British television companies. (For that reason, we are using the British spelling of “programme” to refer to anything relating to Piccadilly Television programmes.) We have condensed the most interesting bits of our project into the case study, so that you can get the maximum practice in a reasonable amount of time. In the original analysis, we used process models and data models that we built from both the physical and essential viewpoints. Don’t worry if you don’t know these terms: As you work through this project, you’ll learn about these models, and you’ll use them to build the specification for Piccadilly’s airtime sales system. Also, don’t be concerned if you don’t know anything about the television industry. It will be progressively introduced to you as you work through the project.
You are here to learn systems analysis and/or to improve your analysis skills. Once you finish the Piccadilly Project and the practice exercises along the way, you will have enough hands-on experience to be able to apply these analysis techniques to your own projects.
How You and the Project Come Together
In the next few paragraphs, we’ll explain how you’ll do the systems analysis for Piccadilly Television. For now, ignore all unfamiliar terms, and keep on reading. We’ll give you a complete explanation of them before long.
The Project Section and the Textbook Section of this book teach the modeling techniques you will be using. We will guide you on a trail between the Project and Textbook chapters as the need arises. Later we’ll tell you more about the structure of the book and how the trails work, but now let’s concentrate on how you will do the Piccadilly Project.
At first, since you will be unfamiliar with the Piccadilly organization, you will build models that will be a faithful reproduction of the current business system. We refer to these models as having a physical viewpoint, and you will take the appropriate trail through the book to read about viewpoints and physical models before you have to build one for Piccadilly. You’ll start the analysis by defining the boundaries, and by developing a context diagram.
Analyzing the stored data of a system helps you get a better understanding of the system. That’s why early in the Project, you’ll build a data model. As before, if you are unfamiliar with this type of model, we shall guide you through the data modeling chapter in the Textbook Section, where you can work on some practice exercises before tackling the Piccadilly data model.
After the data model, you’ll need to begin the data dictionary, and then expand your context diagram by building some lower-level physical models. Once you have done these, naturally with the help of the Textbook (if you want it), the Project shifts up a gear and you will start to look at the essential requirements.
The essential requirements are critical to your analysis. The Textbook provides chapters on the essential viewpoint and on event-response models, which are used in the Piccadilly Project to determine the essential, or real, requirements for the television company.
Your next assignment will be to define the essential processes using mini specifications. You will write some for Piccadilly. If you are unfamiliar with developing and using this type of specification, a Textbook chapter will tell you how.
The Project then enters a stage where you will consolidate all of the work you have done to date, and flesh out the analysis by building more event-response models. By now, you will have a good enough understanding of the analysis process to proceed without help from the Textbook-that is, until you come to defining the new requirements.
At this point, you may need help from the Textbook before modeling the additional functions and data that Piccadilly needs to complete the new system. Once the requirements are complete, you will move on to look at how they might be implemented. Here you will use the new physical viewpoint to model your proposals for the computers and human organizations that can successfully carry out the requirements you have gathered during the systems analysis.
This is a long adventure in systems analysis, but we know that by the time you reach the end of the adventure, you will have a complete and practical knowledge of the art and craft of systems analysis.
Now let’s see how you can get the best value out of this book.
How to Make This Book Work for You
This book is a self-discovery learning tool. It contains a complete analysis project and a state-of-the-art textbook. You can make use of either, or both. Here’s how.
The book is divided into four sections. Each section is relatively self-contained in that it deals with a separate aspect of learning systems analysis. The sections are not intended to be read sequentially. You will read and work through each section in the order that is appropriate for your level of knowledge and skill. We will provide you with guidance and an appropriate trail to follow.
Section 1 contains the analysis project that you will work through. Each of the eighteen chapters in this section adds to your knowledge about the business to be analyzed and asks you to build various types of requirements models, to make some strategic decisions, and to raise questions about the business. In other words, the Project Section simulates the task of systems analysis.
We don’t know your exact level of systems analysis experience, so you will want to consult the Textbook in Section 2 as you need to while you go through the Project chapters. Rather than intermingling the text and the case study, we’ve presented the Project and the Textbook in separate sections to let you decide how much, and when, you want to make use of each of them.
The Textbook is an up-to-date treatise on systems analysis. Even after you have finished the Piccadilly Project, you will want to refer to the Textbook from time to time. Having it as a separate section makes it more convenient for ad hoc referencing and reading.
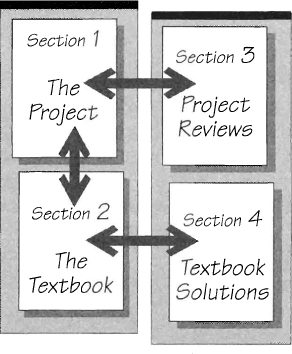
Figure 1.1.4: This book has four sections. Section 1 contains a complete analysis project. You will learn systems analysis by doing the project. Naturally we give you sample answers to the project exercises we assign; you’ll find these in Section 3, along with a discussion of our solutions. Along the way, you will use Section 2, the Textbook, which provides coaching on how to build the models and viewpoints used in the project. The Textbook contains exercises to practice your skills, and the answers are provided in Section 4.
For example, before you can build the requirements models for the Piccadilly Project, you have to know the modeling language. The Textbook contains tutorial material on how to build data flow diagrams, entity-relationship diagrams, event-response models, the data dictionary, and all the other analysis models. Before you can build these models, however, you will need something more. Analysis models do not show the entire system, but rather focus on one particular aspect at a time. We call this focus a viewpoint. You will use viewpoints to emphasize the information that is necessary at the time, which makes the analysis of complex systems much easier. So the Textbook includes a discourse on effective viewpoints, describes ways of modeling them, and discusses when each viewpoint is useful.
We strongly believe that when a book assigns exercises, or asks questions, it should provide the answers. As you work through the Project exercises, you will need to refer to Section 3, where we provide a suggested solution to each problem, along with a discussion of how we came up with our answer. We think you’ll find the discussion almost as educational as doing the Project.
The Textbook section also introduces short exercises to build proficiency using a model. We suggest you complete these exercises before using each model in the Project. Naturally, there are answers and discussions for the exercises. You will find them in Section 4.
This arrangement means that you will be jumping back and forth between sections: from reading about the Project to the Textbook; reading the Textbook and doing the exercises; jumping to the Textbook Solutions, back to the Project; doing the Project assignment; studying the Project Reviews; turning to the Project and back to the Textbook again. The precise route you’ll take depends on your level of experience, and what use you want to make of this book. Navigation through the chapters may seem difficult at first, so we have introduced Trail Guides to assist you in finding your way. The Trail Guides are explained below.
How to Work Your Way Through This Book
Millions of people in the world today enjoy skiing. Almost all of them can ski in complete safety because the ski resorts mark their trails with symbols to indicate the degree of difficulty of the terrain. Thus, skiers can ski on trails most appropriate to their skiing ability. Alternatively, adventurous skiers can find more excitement by selecting more difficult trails. The trail guides used at ski resorts look something like this:
Figure 1.1.5: These ski trail symbols are used to advise skiers of the difficulty of alternative trails. The skier uses the trail guide to select the most suitable way down the mountain. You will use the same kind of trail guide as you work through the Project.
Ski trail guides work so well that we borrowed the idea. At the end of each chapter, you’ll find a Trail Guide that points you to various chapters. There are four different trails through this book. Select the one that suits both the way you want to work and your current level of experience. Read through these descriptions to find the right trail for you.
 Easiest Trail
Follow the Easiest Trail if you have little or no experience with systems analysis or if your exposure to analysis has given you only a fragmentary knowledge of the subject. This trail guides you through all the chapters. Before attempting each Project chapter, you will be directed to the appropriate Textbook chapter to learn how to use that model, and to do some exercises. The exercises are designed to give you some practice before using the model on the Project case study. You will also visit the viewpoints chapters to learn how to look at a system in different ways and to build a model that displays the most useful characteristics of the system for each situation. This trail is marked by the ![]() symbol.
symbol.
If you are in any doubt as to which trail to follow, pick the Easiest Trail. It covers all the analysis material. You can, at any time, switch to something harder if you find you are covering familiar ground.
 More Difficult Trail
The More Difficult Trail will suit you if you’ve had some exposure to analysis, but are not confident that your skills are as up to date as they could be. For example, you may already have some knowledge of how to draw data flow diagrams and how they are supported by the data dictionary and mini specifications. Similarly, you may have a reading acquaintanceship with data models. While you have used these models, it may have been some time ago, and you would like to refresh your memory.
The More Difficult Trail takes you through the Project chapters, as well as the viewpoints chapters of the Textbook. The Trail Guides will steer you past the Textbook chapters that explain the analysis modeling language. If you choose this trail, we assume that you want to use the Project assignments to sharpen your modeling skills, and that you need the minimum exposure to modeling theory. This trail is marked by the ![]() symbol.
symbol.
 Most Difficult Trail
This is the black diamond run. If you are confident that you already know how to build analysis models and that you understand the viewpoints, the Most Difficult Trail is for you. This trail will lead you through the Project Section without any help from the Textbook Section. At the end of each Project chapter, you will be directed to sample models and a discussion of the answer in Section 3.
If you choose this Most Difficult Trail, we assume that you already have all of the necessary analysis modeling skills, and are using this book because you want a demanding case study to give you some real experience in applying those skills. Along with the case study experience, this trail will also teach you about choosing the best analysis strategy for a given project.
Don’t be intimidated by this trail. If at any stage you find it too tough, the Trail Guides provide an escape by showing you an easier path through the book. This trail is marked by the ![]() symbol.
symbol.
 Promenade Trail
The Promenade Trail is intended for managers, project leaders, and supervisors of a team of systems analysts. We also recommend it for those of you who aren’t interested in doing the Project work, but who want to know what systems analysis is all about. It gets its name from the many people who ride chair lifts to the top of mountains, but who have no interest in skiing. For them, to stroll around and enjoy the spectacular scenery is what matters. They have no interest in “guts or glory.”
If you take this trail, your reading order is somewhat different from the other trails. You will not be asked to do any Project work, but we will lead you through the Textbook and, toward the end, some of the case study. This trail is marked by the ![]() symbol.
symbol.
Choosing Any Trail
If you pick a trail that turns out to be too easy, switch to a more challenging trail. Alternatively, if your trail is turning out to be too tough, you can always jump onto an easier trail. As you become familiar with the progression of the chapters, you can switch back and forth between trails, or select chapters to suit your own purposes.
Whichever trail you take, as you work through the case study, you will be guided to Section 3 for the answers to each Project chapter. This section gives more than just answers. Analysis is a human skill, and different analysts produce different answers to the same question. The real skill of analysis is raising all the questions.
Section 3 gives you alternative answers, and a discussion of why and how our answers were formulated. There is also a discussion of how to conduct the analysis, and the problems that you are likely to have when doing analysis under the circumstances posed with the problem. Section 3 is valuable. Don’t miss it.
At the beginning of each chapter, you will find a short list of the chapters that you should have passed through to reach that point. If you need a particular skill to complete part of the Project, that skill will be mentioned. If you need to understand a particular viewpoint, that, too, will be listed. The list has another benefit: If you wander off your trail or forget where you are, the list will help you rejoin your trail. To help you keep track of where you are in this book, we have listed the chapters visited by each trail. You will find these trial guides listed inside the back cover of this book. Once you start following a trail, you may wish to chart your progress on one of these guides.
No matter which trail you take, if you get into trouble, there is always the Ski Patrol.
 Ski Patrol
As a skier, you can rely on the Ski Patrol to help you if you have a problem. For example, if you have a bad fall (is there such a thing as a good fall?), most ski areas have a Ski Patrol ready to pick you up within a few minutes and get you safely back on your trail. Similarly, if you have a (metaphorical, not physical) fall during the Project chapters, you can expect help from our Ski Patrol.
The Ski Patrol appears in the Project Reviews chapters in Section 3. Its purpose is to discuss problems that you may be having with the models. We have based these discussions on problems encountered over our many years in systems analysis. We cannot guarantee that we will always anticipate your precise problem, but we will come close. The Ski Patrol offers advice and suggests remedial actions aimed at overcoming any temporary difficulties you may be having. The Ski Patrol is marked by the ![]() symbol.
symbol.
You Don’t Need a CASE Tool
Computer-aided software engineering (CASE) tools were invented to run on personal computers or workstations and to help analysts with record keeping and with some rule and consistency checking. This means that a computer, rather than paper, is used to store and access the data flow diagrams, data models, data dictionary, and the other components of the requirements specification.
CASE tools can be very useful, and, no doubt with the very large projects that lie in your future, CASE is going to be a necessity. However, while the Project in this book is quite large, you are never asked to build such uncontrollably large models that they cannot be handled using pencil and paper.
If you are new to systems analysis, we recommend that you not use a CASE tool until you feel comfortable with the modeling techniques. Some tools have procedures for building models that will confuse you and that will get in the way of your learning about systems analysis.
But You Do Need ...
Lots of writing paper, pencils, and erasers (possibly more erasers than pencils) are definitely in order. A stack of index cards is useful for building your data dictionary. Some small Post-it™ brand notes are helpful for marking your place in each section. Analysts who are concerned about their ability to draw neat models can use a graphic designer’s template. However, don’t be overly worried about producing great art. Your main concern is with the idea of using models as a common language. Models help you to raise questions with the users, get answers to your questions (and probably raise more questions) to understand the system, and communicate that understanding to others.
Another important thing you’ll need is time in a quiet place where you can think. We also suggest something or someone to help you celebrate when you finish the Project. Systems analysis is enjoyable because you take control of your own work. In that sense, at least, we’re confident you’ll enjoy this book.
What to Do
Trail Guide
![]() Easiest: Go to Chapter 2.1 Analysis Models for an explanation of why systems analysis is best done by modeling the system.
Easiest: Go to Chapter 2.1 Analysis Models for an explanation of why systems analysis is best done by modeling the system.
![]() More Difficult: You should already know about context diagrams. Go to Chapter 1.2 Start with the Context to begin the Piccadilly Project.
More Difficult: You should already know about context diagrams. Go to Chapter 1.2 Start with the Context to begin the Piccadilly Project.
![]() Most Difficult: You plan to do the whole Project without any coaching from the Textbook. Start the Piccadilly Project in Chapter 1.2 Start with the Context.
Most Difficult: You plan to do the whole Project without any coaching from the Textbook. Start the Piccadilly Project in Chapter 1.2 Start with the Context.
![]() Promenade: We can spare you the work of doing the Piccadilly Project. In Chapter 2.1 Analysis Models, you will find the reasoning behind our approach to systems analysis.
Promenade: We can spare you the work of doing the Piccadilly Project. In Chapter 2.1 Analysis Models, you will find the reasoning behind our approach to systems analysis.