2.14. New Physical Viewpoint
Before You Reached Here ...
![]() Easiest and
Easiest and ![]() More Difficult: You have verified the integrity of your Piccadilly models in Chapter 1.15 CRUD Check. Now that you know you’ve captured all the events, it’s time to think about the new implementation. In this chapter, we consider the system from the viewpoint of the devices used to implement it.
More Difficult: You have verified the integrity of your Piccadilly models in Chapter 1.15 CRUD Check. Now that you know you’ve captured all the events, it’s time to think about the new implementation. In this chapter, we consider the system from the viewpoint of the devices used to implement it.
![]() Most Difficult: This is not part of your journey. Piccadilly’s implementation waits for you in Chapter 1.17 Piccadilly’s New Environment.
Most Difficult: This is not part of your journey. Piccadilly’s implementation waits for you in Chapter 1.17 Piccadilly’s New Environment.
![]() Promenade: Now that the real requirements are known, it’s time to think of the new implementation. The goal here is to find the most effective way of using the system’s environment to implement the essential requirements.
Promenade: Now that the real requirements are known, it’s time to think of the new implementation. The goal here is to find the most effective way of using the system’s environment to implement the essential requirements.
Implementing the Essential Requirements
Your essential model is an abstraction that intentionally avoids anything to do with the implementation of the system. That’s so you can understand and specify the real business problem. Now that you have defined the essential requirements, the time has come to bring them into the real world.
The new physical viewpoint acknowledges that people, computers, and many other devices are necessary to make the essential requirements function in the real world. The viewpoint makes the transition from pure essential requirements analysis to the beginning of design. It defines how the key interfaces will be implemented using the available technology.
The new physical model is built using a mixture of external and internal design skills. The external design is comprehensible to nontechnical people, because it defines the behavior of the interfaces from the users’ point of view. The internal design, which requires technological expertise, is concerned with the details of how the technology works.
New physical models are built by teamwork. The users, analysts, and systems designers all must bring together their understanding of
• the current environment and how it will be changed by the new system
• the essential requirements, both process and stored data
• the available technology
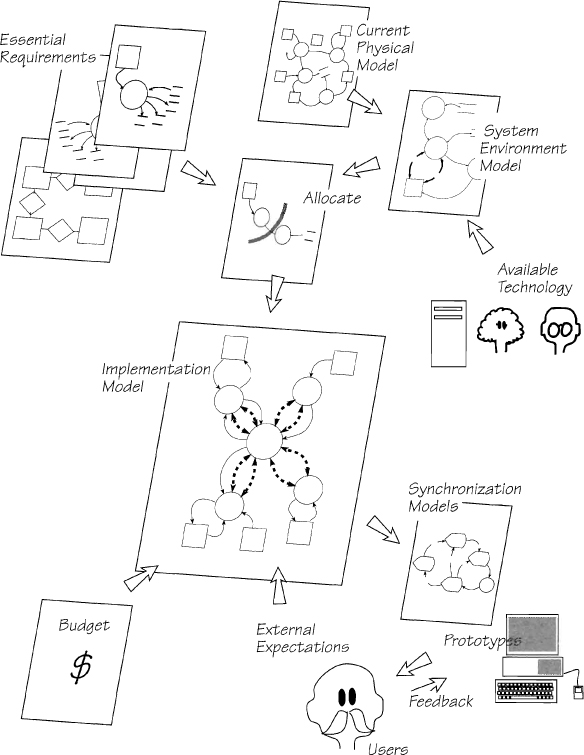
Figure 2.14.1: Building the new physical viewpoint involves several activities that take place more or less simultaneously. The essential requirements are mapped into the system environment by allocating each event-response to the most appropriate device. At the same time, the behavior of the interfaces is agreed with the users by means of synchronization models and prototypes. The implementation model is the final picture of the proposed system; but before it can be finalized, the system must conform to the users’ external expectations and budget.
Additionally, the users or clients of each development project usually have certain external expectations for the automated system:
• the goal for the automated part of the system
• the media and formats of the inputs and outputs
• the processors to drive the system
• the way the users want the system to behave
What’s more, there are always implementation constraints, including
• budget limitations
• deadlines for the delivery of the new system
• expectations about the number of people needed to operate the system
The new physical viewpoint balances these expectations and constraints to make the optimum implementation of the essential requirements.
Defining the System Environment
The system environment is all of the technology—the hardware, software, and people—that is available to the designers of a new system. A system environment model defines the capabilities of each environmental component, specifically the component’s speed, capacity, availability, cost, and interfacing capability. This model is the opposite of the essential requirements model in that it ignores application requirements and focuses on the technology. With this model, designers have a specification of the technological constraints. Since the model is independent of any particular implementation, it can be reused by any systems development project working within the same technological environment.
There are a variety of ways to build the system environment model. One method is to use a data flow diagram to summarize the environment, with each bubble in the diagram representing an environmental hardware or organizational component. Then, for each component, you draw a lower-level model to illustrate the software environments that run on the particular component and the technological interfaces between them.
Examples of software environments are programming languages, operating systems, database management systems, transaction processing monitors, word processing packages, and any other proprietary software that runs within your environment. The mini specification for a software environment bubble could be the manual provided by the supplier of that product. The interfaces between the environments can be defined in the form of data dictionary definitions.
Another way of building the system environment model is to simply list all the technology that is available to the system and provide pointers to manuals, documents, and people who have knowledge about the environment.
Consider your own organization and the variety of technology used. You probably already have some kind of informal system environment models made up of technological knowledge held by a variety of people and project groups. The disadvantage of this fragmented approach is that the knowledge is not centrally available, which usually results in duplication of effort. The best way to avoid this is to build centrally accessible system environment models using a standardized approach.
Processors
The portion of a system environment model in Figure 2.14.2 shows several hardware processors that could be used to implement a new system. Other types of possible processors are discussed below.

Figure 2.14.2: This portion of a system environment model identifies the hardware processors and the interfaces between them. Interactive interfaces are shown by the heavy dotted arrows. The interfaces are defined in detail by means of data dictionary definitions or pointers to manuals and examples of their use. The processors can be further partitioned by software environment, as in Figure 2.14.3.

Figure 2.14.3: A more detailed look at the hardware processor called PC CLIENT. Again, every interface and software processor is defined by means of pointers to manuals or examples of their use.
Human Processor
Organizations normally employ people to carry out data processing tasks. They’ve been doing this for hundreds of years and, despite the arrival of computers, will be doing it for a few more centuries. The human has several advantages over a machine as an implementation processor.
• People are relatively fast to train. It is usually quicker to explain the task to a person than to develop the appropriate software.
• People are good at improvising. When faced with unforeseen circumstances, they can take the appropriate action. However, a computer’s rigid program usually does not allow for ad hoc decisions unless the organization has invested a lot of time in building an expert system. For judgmental processes, it is cheaper to have a person do the job.
On-Line Computer
On-line computers are the workhorses of today’s implementations. Most organizations want their people to have immediate access to the data and to have processing capabilities (spreadsheets, word processors, reporting, and query facilities) that support their tasks.
A problem with on-line computers is their capacity to adequately support the expected processing demands. It seems that each year brings a several-fold advance in the processing power of computers, but during the same period, the demand for processing increases even more.
Client-Server Architecture
Client-server architecture involves a number of machines. All (or most) of the data are centralized and are held by the central server machine, sometimes a mainframe, but often a minicomputer or one of the more powerful personal computers. Each of the system’s users has his own machine, usually a personal computer, which is a client for the server’s data. Clients can download central data, or access as much of the data as they need for their localized processing. Client-server architecture has the advantage of freeing the users from the restraints of queuing to use the central facility, while giving them the flexibility to implement their own systems locally without losing access to central data.
Batch Computer
A batch computer doesn’t produce its response immediately, and users must wait for their output. Although this is old-fashioned computing, there are situations in which the use of a batch computer is desirable:
• The amount or type of processing is such that people don’t want or need to wait for the output.
• The data storage method dictates a batch solution; for example, if large files are being updated sequentially, or if the input is delivered to the system in batches.
• The task should not have an immediate response; for example, waiting for the end of a pay period is preferable to printing a paycheck each time an employee records some hours worked.
Mechanical and Electromechanical Devices
Computers and humans are not the only performers of tasks for a system. Look at any office today, and you see copiers and scanners for processing images; telephones, answering machines, voice mail, faxes, and modems for handling voice and data; envelope openers and stuffers for regular mail; and so on.
Look at the wealth of new electronic devices that are available. Look at the variety of print and broadcast media available, including magazines that cover the wealth of electronic wonders available for data processing and storage. The rapid rise of portable computers has spawned an entire industry of electronic devices that can do an amazing amount of work, and still be carried around in a briefcase or a pocket. It seems that virtually the only limitation in electronics is your budget.
Data Containers
Data containers hold the system’s stored data. If the volume of data is large or if the data must be accessed rapidly, there is little alternative to selecting computerized data containers such as databases and indexed files. Manual containers—such as books, papers, and filing cabinets—are used only when volumes of data and access times permit.
The choice of data containers is somewhat constrained, as when the chosen processor doesn’t support all of the available data containers. For example, not all databases run on all machines. Also, there may be existing databases that must be used. In this case, your choice of processor may be dictated by the data container.
Data Carriers
Data carriers are the media for transmitting data from one processor to another. The carriers may be screens, paper, data lines, and so on. The significance of choosing the data carrier is that it determines the presentation of the data, as well as how the processor is used. For example, compare the interactions between a person and a computer when the output comes out on paper versus a screen. When the data carrier is paper, the user must submit all the input in batch mode before getting any response from the computer; when using a screen, the user enters data in small chunks and gets a response for each entry.
The terminators that surround the context may also have expectations about the carrier selected to convey their data, both to and from the system. You will almost certainly use a variety of data carriers for your implementation, so you must ensure that you select carriers for the boundary data flows that match the expectations of the terminators.
Allocating Processes and Data
Now that you have defined all the elements that make up the system environment, turn your attention back to the application. Your design task is to map the essential requirements into the available environment.
For each event-response, allocate each process to the most appropriate processor, each data store to the most appropriate data container, and each data flow to the most appropriate data carrier.
Stating this rule is a lot easier than doing it. First, what does “most appropriate” mean? For our purposes, we mean the optimum mix of skill, cost, and capacity.
Skill is the ability to accomplish or perform a certain task. Accurate calculations and retrieval of large volumes of data are best done by a computer. Humans are better than machines at making judgments and interacting with human customers. (Of course, if your customers are not human, perhaps another device would be appropriate.) There are many other skills exhibited by other devices that can be assigned to perform certain system tasks.
The cost of a device naturally plays a major part in its selection. While the processing skills of large-scale computers may be attractive, their cost may be beyond the budget for the implementation. When the benefits gained by using a certain level of skill are not worth the cost, then it becomes necessary to settle for a lower skill level. So cost to some extent determines the amount of skill employed for the task.
The third factor is capacity. Before allocating a task to a processor or data container, the system designer must ensure that the processor or container has sufficient capacity for the processing throughput, or quantity of data, both now and in the foreseeable future. Once again, the greatest capacity is almost always associated with the greatest cost, so the designer has to determine the best capacity for an acceptable cost.
With these three factors in mind, the designer must allocate every process, store, and flow to the appropriate device. Allocation involves repartitioning and adding complexity to your model. To help stay in control, use your event partitioning and do the allocation event by event. The result of this work is an allocated event model that is made by repartitioning the essential event-response models to show the various processors that will be used to implement the event. Here is the step-by-step procedure:
For each event, build an allocated event model:
For each process within the event-response,
Allocate the process to the most appropriate processor in the system environment using the optimum mix of skill, cost, and capacity. Don’t forget that some events will be allocated partly or completely to human processors.
If a process is fragmented between two processors,
Then add a new interface between the two fragments.
For each essential data flow,
Add implementation constraints to the data dictionary (volume, frequency, expected growth rate, triggering mechanism).
Choose a data carrier from the system environment and annotate the data flow.
For each essential data store,
Add implementation constraints to the data dictionary (volume, frequency, expected growth rate).
Choose a data container from the system environment and annotate the data store.
For each data flow between two different processors,
Do the external design and, when necessary, demonstrate it with a transaction synchronization model or a prototype.
Add the physical description of all flows and stores to the data dictionary.
Integrate the event with other events that use the same data. Be on the lookout for similar patterns. For instance, you may find that part of the design for one event-response is identical to that for another event-response. In that case, you can avoid duplicating your design effort by reusing the common characteristics.
Add the allocated event to the implementation model.
Implementing External Expectations
External design is when you implement the external expectations, those requirements concerning the physical appearance of the implemented system. Using Piccadilly as an example, let’s say that management wants the sales staff to be able to see the up-to-the-minute status of the breakchart. To achieve this expectation, you must allocate the breakchart maintenance and the sale of spots to a processor that can display the results on-line to all executives. The display may be a large, centralized one, or it may be done via personal computers on the sales executives’ desks.
Note the close link between the external expectations and the data carriers, and between the data carriers and the processors. Whenever the medium of data is specified, the data carrier has to be made available along with the necessary processing capabilities. Similarly, when the external expectations require the system to process two thousand transactions a minute, then it automatically means using one or several processors with the necessary speed to fulfill the expectation.
Introducing the Environmental Processes
While you were building the essential models for Piccadilly, you were able, indeed encouraged, to put aside the harsh realities of the physical world—of corrupted data, incomplete or incorrect data, machine failures, network breakdowns, software glitches, and the several hundred other facts of life that plague automated systems. Now you must deal with these realities.
While you are introducing your perfect essential requirements into this harsh world, you also must introduce the processes that will protect your system from the dangers of the real world. But note the order in which you are doing this. First, determine the business requirement, and then determine how it is to be protected from physical failure. There is little point in being concerned with database recovery procedures before you know what data must be stored.
Many of the environmental processes are introduced after the processors have been selected. For example, if you select two different processors to implement one event-response, you will probably want to install a border guard to edit the data that enter the second processor. Just as a border guard may check your passport as you leave a country, you may need to install a border guard process to check for errors as the data leave a process (see Figure 2.14.4).

Figure 2.14.4: This portion of an allocated event-response shows two processors. The heavy lines are the processor boundaries. The process called BORDER GUARD receives the data flow and edits the flow’s contents to ensure that it contains expected and legal data.
In addition to border guards, you’ll need postmen to put the data into a form that is understandable to the next processor, and to send the data to that processor. For example, keying data into a computer is a postman process, which exists to convert the data into machine-understandable form, and to transport the data to the next processor.

Figure 2.14.5: One processor here is a computer, which works in binary. The other processor is a person who works in English. This necessitates that a postman be installed to translate the computer’s output into a human-readable form.
External Design
External design determines the behavior and appearance of the system from the point of view of someone who is not interested in how that behavior is achieved. Typically, external design is concerned with building models of the intended interaction between two processors, often the end user and a computer.
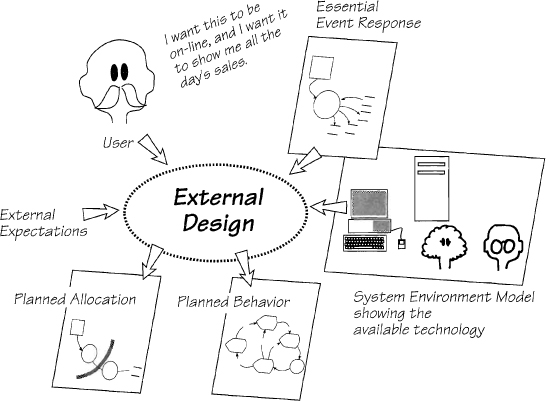
Figure 2.14.6: External design brings together all of the factors that determine the physical behavior of the implemented event-response. External design must use the best of the available technology to make the essential requirements work as closely as possible to the users’ expectations.
External design is closely linked with the selection of data carriers. For example, when screens are selected to carry data from a computer to a human processor, the external design must make the system work optimally using screens. Similarly, the choice of processor has a large effect on the external design.
User Orientation
Perhaps the largest single influence on the external design is the way the users regard each task in the system. Sitting with the users to observe their work is rare for software systems designers, but is normal for other types of businesses. For example, several large U.S. fast-food companies send their head-office executives to the field once a year to work for a few days in one of the outlets. These executives cook hamburgers and French fries, serve customers, and generally get to know that end of the business.
These fast-food companies depend on having good relationships with their customers, and they realize that the head-office executives must understand the retail part of the business if their decisions are to make for better organizational systems as well as better relationships with the customers. The idea of understanding the system from the end user’s viewpoint applies to designers of any kind of system. Time must be spent observing the business that the system is intended to support.
For instance, Figure 2.14.7 illustrates how a user thinks a system responds to his wanting to rent a car. The user is concerned with the car model, the date he has to return the car, the agreement for driving the car (he must be a licensed driver), and the form of payment for the car rental. For a systems design to be successful, it should provide for an automated system that imitates this view. In other words, if you are the designer, you must provide an implementation that allows the user to manipulate cars, drivers, payments, and driver’s licenses—objects that reflect the user’s way of working. Failure to do this usually results in post-implementation modifications to make the system fit the way the user does his work.


In another example, our house in London was being renovated several years ago, and we had the opportunity to design a completely new kitchen. The principles of user orientation told us that we could design a suitable kitchen only if we carefully observed how we prepared our food. We knew that a standard kitchen would not be satisfactory, nor would it be acceptable to use other people’s observations of food preparation, since they eat different food and use different methods of preparation than we do. A kitchen designed for other people would be unsuitable for the kind of cooking that we do. Our diet is largely Asian and vegetarian. Meat-eaters would require more frequent access to the oven and stove top, and less preparation area.
Several weeks of watching each other resulted in a list showing the usage frequency of most items in the kitchen. The cook at our house touched the following items in order of frequency of use: chopping board, knife, water, refrigerator, garbage disposal, other cooking implements, stove top, and pan storage. The kitchen was then designed to put the counters, sink, refrigerator, knife rack, garbage disposal, and other tools in positions such that the most frequently touched items would be close at hand. Items used in an oft-repeated sequence were related to one another. For example, the sequence of taking something from the refrigerator, washing it, and then cutting it was repeated often. This indicated that the refrigerator, sink, and chopping board should form a convenient triangle, with the garbage disposal near the cutting surface. We noted all actions, their frequency and sequence, and the correlation of these gave us the design for the new kitchen.
The design produced a kitchen unlike any we had seen before, and very much unlike the ideas we had before the observation exercise. Cooking in this kitchen is a pleasure. To prepare a meal, we need not take unnecessary steps; the most commonly used storage, implements, and facilities are within reach or one or two steps away. Nothing is hard to find, nor difficult to get. But this has not been achieved by making the kitchen small. On the contrary, it is rather a large room. Washing the dirty dishes takes place in a different part of the kitchen from the food preparation. It has its own traffic flow. To get dirty dishes from the table to the dishwasher, to the storage shelf, and back to the table can all be done without interrupting the cook. The in-sink garbage disposal is accessible to both food preparation and to dish cleaning. The kitchen is usable because it was built only after closely observing the intended task.
Eccentricities and Idiosyncrasies
Personal idiosyncrasies relate to the way someone does their task. The task itself is neutral. We strongly advocate that you observe the users’ work, so that you thoroughly understand the work and the users’ metaphors. But your design should not slavishly imitate the users’ every idiosyncrasy.
Personal eccentricities and idiosyncrasies of the designer or the user must not be allowed to influence the design, nor must anyone’s preconceptions get in the way of orienting the software to the user.
Preconceptions can distort implementations. Sometimes, the users don’t understand or are unaware of the available technology. For example, users who have only worked with a menu-driven system will tend to see any new system as a menu-driven system. The users who are comfortable with manual systems will expect a computer system to mimic a manual one. The external designer has to eliminate the users’ preconceptions by minimizing any existing technological bias.
Road Signs
When we drive along a highway, we expect to see road signs. These signs, typically at intersections, point to various destinations. Now consider the alternative. Suppose all road signs were removed. Navigation on any but the most familiar roads would be difficult, and most drivers without a map would become hopelessly lost. Why is software any different? We cannot expect users to navigate through computer systems without road signs to guide them. Using an interactive computer system is somewhat similar to driving cross country.
Most transactions in business systems require several smaller tasks to be done in order to complete the transaction. Sometimes, users must choose between alternate tasks, and subsequent tasks usually depend on the results of previous ones. At any stage of the processing, they have a right to expect road signs to inform them of where they are in the process, where they are going, and the available options.
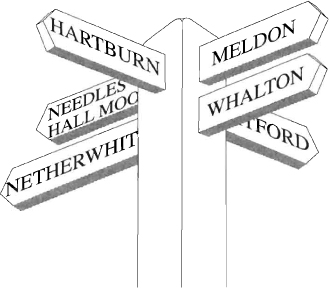
Figure 2.14.8: “From here, turn right to go to Meldon and Whalton. Turn left to go to Needles Hall Moor and Netherwhitton. Straight ahead is Mitford, and behind you is Hartburn.” This is a lot of information, but no more than is reasonable to expect from a road sign.
Computer road signs can be implemented by means of intelligent menus that appear on screen. As an example, let’s say a user adds a new customer to the database. Before returning to the main menu, the system shows the user a menu of possible actions: Add the new customer to the mailing list, or send the optional “Welcome aboard” letter, or quit. These options are much more accessible on the screen, of course, than buried in some user manual. Similarly, screens can display status lines to inform users of the exact state of processing, the results they have gained, and any processing exceptions.
The system should display what it has to offer, as well as keep the users informed about progress. It should provide road signs.
Consistency
Each application written for the Macintosh® computer must follow the interface standard as defined by Apple. A similar situation exists for Microsoft Windows™. This means that every piece of software, regardless of who writes it, has the same appearance to the users. Consider the advantages. Mac users need not learn each new piece of software, nor spend time with the manual; they need only open the application and start using it.
Be consistent across all systems. Use design templates so that every application reflects the same interface design philosophy.
This is really quite an extraordinary feat. The thousands of companies that build software for the Macintosh have proved they can make their programs look and act the same. Why is it, then, that within one company user interfaces can be so radically different? Why does the interface get reinvented for each new system, and sometimes for each new transaction?
One way for organizations to address this problem is that they build reusable templates for the use of all their designers. These templates provide application-independent patterns that can be used to design interfaces. The use of common templates speeds up the design as well as the implementation process. The consistency of behavior patterns between systems thus enables users to learn and use new systems more easily.
Behavioral Models
When you are negotiating with your users about the proposed implementation of the system, you will build several behavioral models to demonstrate how the users will manipulate the system. A behavioral model is a simulation of the yet-to-be-implemented computer system, and it can be either an automated prototype or a paper model called a transaction synchronization model. An automated prototype mimics the behavior of the proposed system and is built with special software tools that allow for the rapid construction of a system. The user tries out the simulation, then agrees to it, or asks for modifications. In this way, behavioral models allow the user to try out several alternatives before selecting a final version. The behavioral model then becomes part of the specification for the production version.
Automated prototyping software has become very popular in recent years, and does offer some distinct advantages:
• Prototypes help in communicating with users who do not relate well to the more abstract data flow and data models. Those people are more physically oriented and less able to think in abstract terms and thus cannot help much to verify pure policy models.
• Prototypes are extremely useful in demonstrating possible implementations of the system. Once the essential requirements are known, the analyst can build a physical simulation of how these requirements might be automated. In this way the prototype is used to demonstrate the automation interface, and so contribute to the negotiation of the final system.
• Prototypes can serve as an adjunct to gathering requirements. When the analyst builds a prototype of the system and shows it to the users, he is inviting criticism and suggestions. The prototype is a representation of the users’ work, and so the users are highly motivated to contribute requirements and suggestions.
Another way to simulate the behavior of the system is to use a paper model called a transaction synchronization model.
Developing the Transaction Synchronization Model
A transaction synchronization model is an elaboration of the data flow diagram. It is built by analysts or designers to demonstrate the intended interaction between a user and a machine. Later, it is used as a basis for designing the interactive software.
We’ve found that nontechnical users can comprehend the transaction synchronization model provided we talk them through it carefully to illustrate the dynamics. The intention is to acquaint users with how they will interact with their future system in order to avoid any misunderstandings that would necessitate changes to the installed system.
The transaction synchronization model is also a transitional model. When dealing with a complex interactive business system, even the most intuitive designer can have trouble making the leap from an essential data flow diagram to a design model. However, it is a relatively straightforward step to convert the synchronization model to a detailed software design.
For example, the transaction synchronization model shown in Figure 2.14.9 portrays a simplified flight reservation system. This model shows that the system starts with the FLIGHT REQUEST SCREEN, which the operator sees when the reservation transaction is selected. He uses the screen to enter the PASSENGER DETAILS.

Figure 2.14.9: A sample transaction synchronization model of a flight reservation system. This scaled-down model illustrates the behavior of the system during the time that one event is taking place.
Next, the operator books a flight for the passenger. If the passenger knows which flight he wants to travel on, the operator keys in the SELECTED FLIGHT with the PASSENGER DETAILS. Otherwise, only the DESTINATION is entered.
When the system is given only the DESTINATION, the process SELECT FLIGHT retrieves all flights to that destination showing seat availability. The operator uses the AVAILABLE FLIGHTS SCREEN to search for one that is suitable for the passenger, reading the options to the passenger over the telephone until the passenger selects one. The SELECTED FLIGHT is recorded by the BOOK FLIGHT process. If no flights are acceptable, the operator can return to the FLIGHT REQUEST SCREEN and enter a new destination.
After booking the flight, a seat for the passenger is selected and booked in a similar manner to the flight. When this has been done, the process PRINT TICKET produces a TICKET. The boarding pass showing the seat will be produced later when the passenger checks in for the flight.
Notation for the Transaction Synchronization Model
The interface process represents an action carried out by a collaboration between the computer and the operator. The screen symbol is used because the computer has a screen to display its information. This symbol represents the display of information, manual decisions that are part of the process, and the act of entering data into the computer.

The interface process may include elementary data validation. Since most modern programming languages have a capability for on-screen field verification, think of the interface process symbol as representing such simple syntactical editing tasks in line with the screen-handling capabilities of the target language. However, the interface process should not be attributed with other automated processing capacities. For example, file lookups and data transformations are considered outside the scope of the interface process. These should be shown as normal processes, as discussed below.
The computer’s screen can remember what has been displayed. Subsequent screens can add to the display and selectively delete information. Each interface process notation need not be implemented as a completely new screen; rather, it may be a variation on a previous display.

A data flow in the transaction synchronization model has the same meaning as in a data flow diagram. It carries data from one process, interface process, or data store to another. Note that in the transaction synchronization model, the data flow coming from an interface process means the operator has entered that data. The system selects a process depending on the content of the data flow. In the flight reservation example (Figure 2.14.9), the system activates either SELECT FLIGHT or BOOK FLIGHT, depending on the data entered by the operator. Its ability to activate processes means that the data flow both carries data and has a control component.
Now look at AVAILABLE FLIGHTS SCREEN. The data flow SELECTED FLIGHT emerges from the interface process if the operator finds a suitable flight. If he cannot find one, he enters either TRY AGAIN to activate the starting screen, or ABANDON to terminate the transaction.
A control flow indicates that some processing condition has occurred and that the system is to activate the process pointed to by the arrow. The label attached to the control flow indicates the condition. In the above example, TRY AGAIN would result if the operator uses a predetermined signal (menu choice, function key, or something else) through the keyboard.

Control flows give sequence to the model. They are used when it is necessary to invoke a process when data flow is needed. For example, the unlabeled control flow between the processes BOOK SEAT and PRINT TICKET indicates that the ticket is printed only after a seat has been booked. The amount of control shown in the model is varied to suit the reader. You can, of course, make a diagram unreadable by including every possible control flow. Instead, the convention is that if there is a data flow, it is unnecessary to also show a control flow. For instance, the user enters the data DESTINATION on the FLIGHT REQUEST SCREEN. It is true to say that the implemented design will also contain a flow of control from the screen to the SELECT FLIGHT process, but for the purpose of behavioral modeling, the data flow is sufficient. The control notation is used only when it adds to the reader’s understanding of the external behavior of the system.

A process is the same as in a data flow diagram. When used in a transaction synchronization model, a process is either a fragment of the essential model, or a new process added because of the system implementation environment. Processes can be allocated to either a human, computer, or any other device. If you want to draw the reader’s attention to the type of processor that will be used for the implementation, then annotate the process with the name of the device.
A data store (enclosed in parallel lines) also has the same meaning as in a data flow diagram. Data stores contain the data used by each process. Sometimes, showing all the data stores makes the model unnecessarily cluttered. In this case, group the data stores into higher-level stores such as are used in the flight reservation system model.
Physical Descriptions of the Data
Now that you are in the preliminary design stage, you can properly think about the implementation of the data. For example, considering the volume, format, size, frequency, and medium of data items is necessary in order to make decisions about their allocation. The physical appearance of the data is now an issue.
Add the physical details to the data definitions in the data dictionary. For example, the data from the Nelson Buzzcott Employment Agency system would be revised as follows:
Applicant = Applicant Name + Applicant Date Of Birth + Applicant Address
+ Date Registered + Salary Required
* Estimated volume: 500,000. Medium: DB2 databases. *
Applicant Details = Applicant Name + Applicant Address
+ Applicant Date Of Birth
* Estimated frequency: 100 per day. Medium: on-line transaction. *
Applicant Address = * Size: 4 lines, 20 bytes each. *
Applicant Date Of Birth = * Format: yyyymmdd. Earliest year: 1900. *
Applicant Name = * Size: 20 bytes. See Boyd’s rules for names. *
Figure 2.14.10: Data dictionary entries updated with the appropriate implementation information. Be careful to add only those details that are necessary for you to make allocation decisions involving that item, but also include the results of those allocation decisions.
The data dictionary reveals what data are to be displayed and their format, and the transaction synchronization models specify the operator’s manipulation of the data. At this stage, you also need to think about how data are to be presented on the screens. We suggest that you use some kind of screen painter or prototyping tool to build mock-up screens for the users to see how their data will appear. In the case of critical or complicated transactions or transactions whose behavior pattern is difficult to decide, it’s a good idea to give the users a chance to give the behavior pattern a detailed test. Build a working model prototype by using a prototyping tool to simulate the behavior you have specified in the transaction synchronization model.
When a data flow from the automated system is allocated to be a report intended to be read by a person, the users need to know how that report will look. You can accomplish this with a standard report layout.
Developing the Implementation Model
An implementation model is a high-level view of how the new system will be implemented. It shows the organization of the major processing components of the system—the people, computers, and other devices—and the interfaces between them. This model is also a high-level summary of the allocated event-response models (Figure 2.14.11).

Figure 2.14.11: A typical implementation model, which shows a central computer accessed by the surrounding people. Each processor shown in the model contains a number of processes and sometimes stored data. The two-way heavy dotted arrow indicates an interactive transaction between a human and an on-line computer.
The details of interactions shown in implementation models can be specified in one of three ways: a transaction synchronization model, a prototype, or a data dictionary definition. In every case, the specification component bears the same name as the two-way flow in the implementation model.
Unbroken data flows in the implementation model indicate a batched activity. For example, a data flow from the computer to a person is a report that can be produced in batch mode. Data flows into the computer are also batches of data being entered without the need for any interaction with the operator.
The data flows to and from the terminators are critical. First, they are the boundary data flows from the context diagram; their content cannot be changed without permission from the terminator. Second, their physical medium cannot be changed unless agreed to by the terminator. Third, if you do not specify every detail of a boundary flow and get approval from the users, then no matter how good your system is, it will exist in a vacuum because it will not fit into the real world. The terminators have expectations about how they deliver their data to the system, and how it is delivered to them. For example, a flow of data from a payroll system to a terminator entitled BANK CLEARING SYSTEM is expected to contain specific data formatted in a specified way and carried on a specified medium. So there is no point in designing an on-line data transfer system if the BANK CLEARING SYSTEM terminator is expecting a magnetic tape.
The implementation model is a high-level guide that shows all the different design tasks and the connections between them. For instance, if you see an interaction between an automated processor and a user department, you know there are two detailed design fragments that must eventually connect to each other. The software designer must design some software using the software environments available within his processor. The users will design some procedures using the organizational knowledge within their processor. Eventually, the products of these two very different design tasks must fit together. The implementation model is a way of managing all the pieces of the project.
Checking the Result Against Expectations
Now that you have a model of the system to be implemented, it’s time to reflect on whether this is the system that was originally envisaged at the beginning of the project, or whether the requirements analysis revealed an altogether different system. This is also the time to check whether the intended costs and benefits for the development effort will be achieved.
Some of the processes from the event-response models have been allocated to a computer. In Controlling Software Projects (see the Bibliography), DeMarco gives a comprehensive method of estimating software development costs based on the data to be processed by the bubbles. Your event-response models already show all the information needed for this estimation technique, so it can be a straightforward task to determine the cost of implementing the software component of your system (so straightforward in fact that we believe this kind of estimation should be provided as an integral part of every CASE tool).
With these estimates, you have a cost of the complete software building effort that is based on small, tangible pieces. If the cost is greater than originally anticipated (it almost always comes as a nasty surprise), you cannot make it cheaper by wishful thinking, nor can you say that you will have to “work smarter” and get it done more quickly. However, one thing you can adjust is the amount of software to be written.
You can do this by altering the automation boundary. If there are fewer processes inside the computer system, it will cost less. You can also negotiate with the users and management for a system containing less functionality.

Figure 2.14.12: A straightforward way to determine the cost of the software is by estimating the cost of each process inside the computer.
Another way to reduce the cost of building software is to make use of the fact that in most commercial computer systems, there is a large amount of similarity between transactions. Look closely at all the event-responses. How many of them act in a similar way? Ignore for the moment that they use different data, and consider whether it is possible to construct a series of program templates that can be reused, with small modifications, for different transactions. By carefully designing the templates, you will find that reuse can significantly cut your software construction cost.
Now is the time to examine the capacity of the target computers to ensure that they can adequately handle the processing and data storage demands. The total traffic the system has to bear is determined by the number of end users and the frequency of their transactions, taking into account the transactions’ demands for stored data.
The capacity of the data containers should also be examined. At this stage, the database designers have enough information to review a database design, and to determine that it will be able to handle the anticipated volumes.
You should audit the external expectations for the system, too, at this stage. Are there expectations that have not been met? Is the cost of implementing them (now that you know what that cost is) beyond the anticipated benefit? Answering these questions will probably uncover discrepancies that must be resolved with the users and management before implementing the system.
Finally, you may want to investigate the emerging discipline of risk management, which advocates determining the greatest risks associated with a project. For example, suppose that you have never before implemented a particular database, and yet the whole project relies on its working correctly. Risk management says that the first thing to do is implement the database; if that doesn’t work, there is no point in doing anything else. The current literature gives techniques for assessing risks, and we particularly recommend the tutorial edited by Boehm (cited in the Bibliography).
Summary
The new physical viewpoint shows the system that you intend to build. As with the other viewpoints, you select whichever models you need to accurately portray this system, and build as much as you need of them and no more.
A system environment model is constructed to illustrate the technical and organizational details of the environment in which the system will operate. While this model can really be seen as a view of the current system, its use is mainly directed toward determining how the new system will be implemented.
New physical modeling starts by allocating each of the essential event-responses to the most appropriate processor and data containers in your system environment. This allocation process determines the interfaces between processors. For each of these interfaces, you need a behavioral model to demonstrate to the users how they will manipulate their automated system. Behavioral models can be transaction synchronization models or automated prototypes. You also need to design its external appearance using a screen painter or report layouts.
The data dictionary definitions for all the flows and stores are enhanced by the addition of physical characteristics and implementation constraints (volume, frequency, and expected growth rate).
The highest-level model of the new physical viewpoint is the implementation model. This model summarizes the implementation by showing all the processors and the interactions between them. The details of the new physical viewpoint are contained in the allocated event-response models supported by the data dictionary, mini specifications, and behavioral models.
Once you know the amount of processing that is to make up the new computer system, you can estimate the cost of implementing the software. Be prepared to negotiate when the costs are greater and the risks higher than anticipated. At this stage, you should also evaluate the high-risk items and implement them first (if you have not already done so).
Although we have presented the new physical viewpoint in procedural terms, we do recognize there are many factors influencing this view. One factor is the time when you build this model. Although we have suggested waiting until all the essential requirements are known, time and resources dictate that most projects need to have activities going on in parallel. While you cannot finish this view until you know all the requirements, you can choose to start it much earlier in the project than we’ve indicated. It is worthwhile to build parts of a preliminary new physical model as soon as you have a basic understanding of the system. For example, as soon as you understand the intended environment, record it in a system environment model, which can help you in planning the implementation activities and in making early estimates about the implementation. Once you have done some essential modeling, you can allocate selected events to give users an early indication of what is possible. This early model can also be used for gathering implementation ideas as the project progresses.
What to Do
Trail Guide
![]()
![]()
![]()
![]() All trails: Go to Chapter 1.16 Strategy: Toward Implementation to see how this viewpoint works for Piccadilly.
All trails: Go to Chapter 1.16 Strategy: Toward Implementation to see how this viewpoint works for Piccadilly.