3.12. Review: More Events
How to Use This Chapter
This chapter contains event-response process models, event-response data models, and mini specifications for each of these sixteen events in the Piccadilly system:
2. Management sets a sales target
3. Bureau prepares TV ratings
4. Agency decides the transmission instructions for a commercial
5. Agency decides a commercial is outdated
6. Supplier wants to sell a new programme
7. Production company makes a commercial
8. Personnel hires a sales executive
10. Agency cancels a spot
11. Agency wants to upgrade a spot
12. Agency chooses spots for a campaign
13. Spots are transmitted
14. Time to analyze revenue
15. Time to analyze the breakchart
16. Time to finalize new programme schedule
17. Another channel sets a schedule
18. Broadcasting Board makes rules
The data dictionary definitions that support these models are packaged in Chapter 3.6. The combined data model is included in this chapter as well.
Compare each model that you have built with the corresponding one in this chapter. If you are happy with the result, return to Chapter 1.13 More Events to find the next event-response you want to model. Keep doing this until you have modeled all the events. If you are dissatisfied with the results you’re getting, consult the ![]() Ski Patrol in Chapter 1.13 More Events for help.
Ski Patrol in Chapter 1.13 More Events for help.
Modeling the Piccadilly Essential Event-Responses
As you build your event-response models, you will discover more about the data. An updated version of the system data model for the Piccadilly Project is included here, as well as the individual event-response data models. Building such individual data models is an effective way to work, for the size and complexity of the system data model make it difficult to focus on the parts that are relevant to one event. Later, you’ll consolidate these individual data models and use them to do a CRUD check of the entire Piccadilly system. This check verifies that you have not missed any events.
Some of the sample event-response models contain questions about the business policy. These questions must be answered by the users before a new system can be built. When you build the essential event-response models, you examine the system in far more detail, so you’ll probably discover missing or undetermined pieces of business policy. Any questions that you raise for the users at this stage are far more valuable than questions later in the Project because the essential models are far easier to correct than the installed system. If it bothers you to have to change a paper specification, think how much more bother it would be to change installed software.
Event 2 Management sets a sales target
Management decides how much revenue Piccadilly can reasonably generate for the upcoming period. This is not quite as simple as it sounds. Management has to estimate the expected revenue for the whole of the independent network, and then estimate how much Piccadilly’s share should be. If the target is set too high, the rates will be too high, and the advertisers will look for better value elsewhere. If the target is set too low, Piccadilly will lose income.
The main part of the response to this event is setting the new ratecard. Figure 3.12.1 shows the system’s current response.

Figure 3.12.1: The current physical model for event 2. The numbers in the bubbles indicate that the response happens in different departments.
You can now start to refine the response. The new ratecard is duplicated and sent to three locations. Usually, duplication like this indicates that the processes that receive the duplicated data are themselves duplicates. For example, bubbles *3.3* and *4.6* are identical because they are storing exactly the same data. Some investigation in the data dictionary proves that bubbles *2.3* and *1.5* are also recording the same data. There is an essential reason for the system to remember the ratecard, but not multiple times. The reason that the current system looks like this is because the four processes all keep their own copies. Essentially, you only need one. The process SET NEW RATES stores the ratecard information, so both the bubbles called FILE RATECARD (*3.3* and *4.6*) and the bubble called UPDATE SPOT RATE FILES (*1.5*) are redundant (see Figure 3.12.2).

Figure 3.12.2: The current physical model for event 2, annotated to show the nonessential processes and data.
The process ENTER SPOT RATES is part of the current system for technological reasons; the ratecard must be entered into the computer. Essentially, all of the system is executed by a single processor, so there is no need to move data from one processor to another. Let’s eliminate this bubble.
UPDATE SPOT RATE FILE is another duplicate. It does the same thing as the bubbles called FILE RATECARD. The file it updates, SPOT RATE FILE, has a data dictionary definition of {RATECARD}. The definition of RATECARD FILE that is updated by the process SET NEW RATES is {RATECARD}. Clearly, the process UPDATE SPOT RATE FILE is repeating some of the function of another bubble. There is no reason for keeping it in the essential model.
You will often find that a single physical bubble is involved in several events. This happens when a person or a processor is involved in multiple tasks, typically because the tasks are part of somebody’s job or because they have related subject matter. The partitioning of the physical model results in a bubble that forms part of the response to several events. However, the tasks that were grouped because of a physical design decision now must be shown as fragments of the different events they respond to.
In the Sales Department, process 3.4 manages the sales policy. Fragments of this process respond to two different events. In event 2, the one we are concerned with here, the bubble SET SALES POLICY RATES represents the fragment of the event-response that records the sales target.
However, the task of recording the sales target is simple enough to be amalgamated with the remainder of the essential process. When we eliminate the duplication from the model in Figure 3.12.2 and amalgamate the sales target recording, we are left with one essential process. The physical files can now be replaced with the essential entities, and the resulting essential model is shown in Figure 3.12.3.

Figure 3.12.3: The essential event-response for event 2. The data stores are entities from the data model.
Now let’s consider the mini specification for this process. The fundamental idea is for the process to set new rates such that they will generate enough revenue to meet the sales target. You were not given all the information you needed, so you may have a different specification. Here’s what we came up with:
Mini specification 2 Set New Rates
Input: SALES TARGET INSTRUCTIONS
With reference to the event-response data model
* First see if a SPOT PRICE on the current ratecard will satisfy the sales target *
For each date within the SALES TARGET FROM and SALES TARGET TO
For each EPISODE with that EPISODE SCHEDULED DATE
For each COMMERCIAL BREAK that has a PROXIMITY relationship
Using the latest RATECARD PERIOD
Find the RATECARD SEGMENT corresponding with the
BREAK START TIME
Find related SPOT RATE with RATE MOVEABILITY= “BROAD” and with
RATE SPOT DURATION = 30 seconds
ESTIMATED BREAK REVENUE =(BREAK DURATION / 30) x (SPOT PRICE)
Add ESTIMATED BREAK REVENUE to TOTAL PREDICTED
If TOTAL PREDICTED < SALES TARGET AMOUNT
PERCENTAGE INCREASE=
(SALES TARGET AMOUNT - TOTAL PREDICTED) / SALES TARGET AMOUNT) x 100
Otherwise
PERCENTAGE INCREASE = 0
Create entities and relationships for new ratecard
Create SALES TARGET
Create BUDGETING relationships between SALES TARGET and all
BREAKCHART DAYs within the SALES TARGET FROM and SALES
TARGET TO
Create RATECARD PERIOD
RATE FROM DATE = SALES TARGET FROM
Per the previous ratecard
Create RATECARD SEGMENT entities per the previous RATECARD PERIOD
Create RATE SETTING relationships with RATECARD SEGMENT entities
For each RATE MOVEABILITY
For each RATE SPOT DURATION
Create SPOT RATE entity
If PERCENTAGE INCREASE > 0
SPOT PRICE = current SPOT PRICE ((current SPOT PRICE x
PERCENTAGE INCREASE) / 100)
Otherwise
SPOT PRICE = current SPOT PRICE
Create LEGAL PLACEMENT relationship with RATECARD
SEGMENTs
Output: RATECARD
The first part of the specification establishes whether the current ratecard can deliver the required revenue. For the ratecard algorithms, Piccadilly management considers the thirty-second broad price to be the average for all spots sold over a period. In other words, Piccadilly makes its prediction by calculating the total revenue for all available airtime at thirty-second broad rates. If this prediction falls short of the requirement, management increases the rates by a percentage that is sufficient to meet the target.
Can the percentage increase be too big, and the advertising agencies refuse to buy Piccadilly’s airtime? Not if management has made reasonable predictions about the revenue to expect as its share of the total advertising money to be spent over the whole network.
Is it safe to estimate the revenue based on the thirty-second broad rate? This is the most common rate used. Additionally, sales management knows how to fine tune the revenue by adjusting the minimum rates for each break.
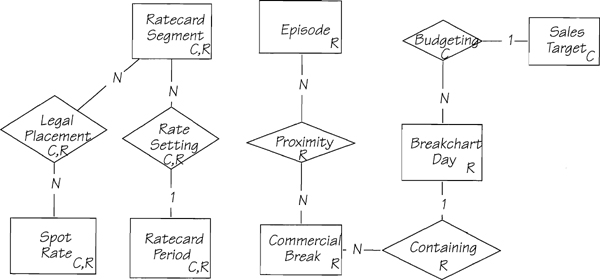
The event-response data model for event 2 is shown in Figure 3.12.4.
Event 3 Bureau prepares TV ratings
The processing for this event-response is relatively simple. Figure 3.12.5 shows the current response, which is to select the applicable ratings and to record them in the store AIRTIME RATINGS HISTORY.

There is something rather suspicious about this model. The process ANALYZE RATINGS REPORT doesn’t access any stored data. So you must ask, “How does it make a decision to select a rating or ratings?” Either the process uses stored data not shown in the model, or the ratings are selected by personal whim. The data dictionary tells you that the flow SELECTED RATINGS is identical to TELEVISION RATINGS REPORT, so you may conclude that SELECTED RATINGS are just those applicable to Piccadilly. For the essential model, this selection process can be merged with the process that stores the data.
Now let’s turn our attention to the data, with the intention of replacing the current physical file with essential data. The data dictionary gives this definition of the incoming data flow:
Television Ratings Report = * Data flow. Statistical analysis of programmes and types of viewers showing ratings that are measured every 5 minutes during the viewing day. *
{Rating Date
+ {Programme Name + Rating Time
+ {Audience Type + Actual Rating Percentage}}}
Why does Piccadilly need these data? Piccadilly needs to know the ratings because the breaks in the more popular programmes are sold at higher rates. The essential task here is to attach the appropriate rating to the programme and the commercial breaks.
We can begin to write a mini specification for the essential process:
For each Piccadilly PROGRAMME NAME in the TELEVISION RATINGS REPORT
Find the EPISODE whose EPISODE START TIME
and EPISODE END TIME contain the RATING TIME
This involves the entities PROGRAMME to match the PROGRAMME NAME, and EPISODE to match the times. These entities should be part of the event-response data model. In theory, there could be a rating time without matching episode times. However, this suggests that people are watching when no programme is being broadcast, and we do not think it a serious possibility.
Ratings are taken at frequent intervals, but there may be no commercial break happening at the rating time. So this part of the specification will read
Find the BREAKCHART DAY that matches the RATING DATE
If RATING TIME is within a COMMERCIAL BREAK
For each COMMERCIAL SPOT that has an OCCUPYING relationship with the
COMMERCIAL BREAK
Create a SPOT MEASURING relationship with the ACTUAL RATING
The ACTUAL KAHNG entity mentioned here is where the system stores the rating information. ACTUAL RATING PERCENTAGE is the key piece of data here, for it refers to the percentage of Piccadilly viewers. This number has to be recorded and related to the spot and the episode.
As you know, the Research Department at Piccadilly predicts ratings for programmes and their breaks. These predicted ratings are recorded before the event takes place. Because they have different meanings, the predicted rating and the actual rating must be modeled separately. We have modeled RATING as a supertype of ACTUAL RATING and PREDICTED RATING (see Figure 3.6.10). However, PREDICTED RATING plays no part in this event so it does not appear in the event-response data model. (If you have forgotten supertypes, reread Chapter 2.5 Data Models.)
Using the description above, look at the data model in Figure 3.12.6. The CRUD operators describe what this event-response is doing.

The essential process model for this event is in Figure 3.12.7, with all the physical files replaced by the essential entities. The complete mini specification is now the most interesting item because it specifies all the details of the event-response.
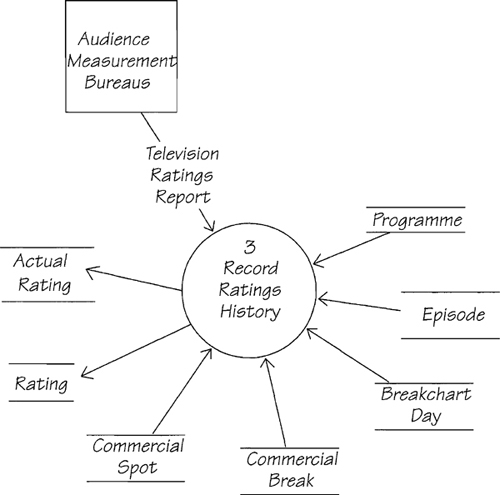
Mini specification 3 Record Ratings History
Input: TELEVISION RATINGS REPORT
With reference to the event-response data model
For each PROGRAMME NAME in the TELEVISION RATINGS REPORT
Find the EPISODE whose EPISODE START TIME and EPISODE END TIME contain the RATING TIME
Create an instance of RATING
Create an instance of ACTUAL RATING
Create an instance of PROGRAMME MEASURING relationship
Find the BREAKCHART DAY that matches the RATING DATE
If RATING TIME is within a COMMERCIAL BREAK
For each COMMERCIAL SPOT that has an OCCUPYING relationship with the
COMMERCIAL BREAK
Create a SPOT MEASURING relationship with the ACTUAL RATING
Note that the event-response finds the appropriate episode and commercial break and relates the rating to it. Why doesn’t the system simply record the rating information and relate it later when analyzing the ratings?
The answer lies in the difference between essential and physical. Physical is what Piccadilly does now, but because the rating carries a time, RATING is logically related to the episode and the breaks. Piccadilly needs to know the ratings for its programmes and spots, so as soon as the data flow enters the system, it becomes part of the system’s data. If there is a logical link between items of data, they are related by the essential process that receives the data flow.
Event 4 Agency decides the transmission instructions for a commercial
For event 4, the response again is to record the incoming information. The current physical model (Figure 3.12.8) shows the data being stored in the COPY REGISTER physical data store.
Let’s examine the dictionary definitions of the data for this response:
Copy Register = * Data store *
{Commercial Copy Number + Product Name + Campaign Number
+ {Copy Transmission Date}
+ (Disposal Date)}
Copy Transmission Instructions = * Data flow. Details of when particular commercial copy is to be transmitted. *
Agency Name + Product Name + Commercial Copy Number
+ {Copy Transmission Date}
The COPY TRANSMISSION INSTRUCTIONS show both the agency’s name and the product’s name. This is an example of nonessential data coming into the system. As a product may be represented by only one agency at a time, and as the product is already known to the system, there is no essential need for the agency name to be stored. Another event has already created the relationship between agency and product. The COMMERCIAL COPY NUMBER uniquely identifies the copy, so that is an essential piece of data. As it is a unique identifier, there must be an entity for it to identify. The natural choice is a COMMERCIAL COPY entity.
The COPY REGISTER tells us that COMMERCIAL COPY NUMBER and PRODUCT NAME are recorded together, thus indicating a relationship between COMMERCIAL COPY and PRODUCT. Sometimes, there are several different copies for one product (as we learned in Chapter 1.4 The Piccadilly Organization), so it is necessary to have a many-to-one relationship between COMMERCIAL COPY and PRODUCT. (That the COPY REGISTER repeats the PRODUCT NAME for each piece of copy is because of the way that the current technology implements the relationship.)
The COPY REGISTER tells us that each piece of copy is logged and the dates on which it is to be played are recorded. We have included {COPY TRANSMISSION DATE} as attributes of COMMERCIAL COPY. The repeating group makes us suspicious of this policy. Further questions might result in changes to the policy and the creation of another entity type and relationship in the data model.
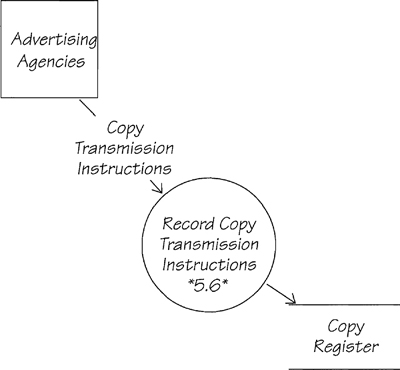
With this description of the data, the task of the essential process becomes that of creating a COMMERCIAL COPY entity and relating it to an existing PRODUCT entity. The relevant part of the data model is shown in Figure 3.12.9, and the essential process model is in Figure 3.12.10.


The mini specification has to describe how the process makes use of the data that are already known to the system, and how the new data are recorded. We wrote this:
Mini specification 4 Record Copy Transmission Instructions
Input: COPY TRANSMISSION INSTRUCTIONS
Match the COMMERCIAL COPY NUMBER in the COPY TRANSMISSION INSTRUCTIONS
with the COMMERCIAL COPY NUMBER on a COMMERCIAL COPY entity
If a match is found
Update COMMERCIAL COPY with {COPY TRANSMISSION DATE}
Otherwise
Match PRODUCT NAME on COPY TRANSMISSION INSTRUCTIONS with
PRODUCT NAME on a PRODUCT entity
Create an instance of COMMERCIAL COPY entity
Create an instance of PUBLICIZING relationship with PRODUCT
This mini spec raises a question. Is it correct to create a new COMMERCIAL COPY entity if one does not already exist? Yes, this is typically the first communication from the agencies about copy. We have not been told what happens if the automated cassette recording containing the commercial copy does not already exist in the library. There should be another event to check that all scheduled automated cassette recordings exist sometime prior to transmission time. None of this was apparent before we wrote the mini spec.
Event 5 Agency decides a commercial is outdated
The current response to this event takes place in the Programme Transmission Department. The process that receives the triggering data flow is insulated from other processes by data stores, so the response does not continue. The current physical model is shown in Figure 3.12.11. The response locates the physical cassette and records its deletion in the register. The essential version will be similar, except that the current physical data stores will be replaced by essential entities and relationships.
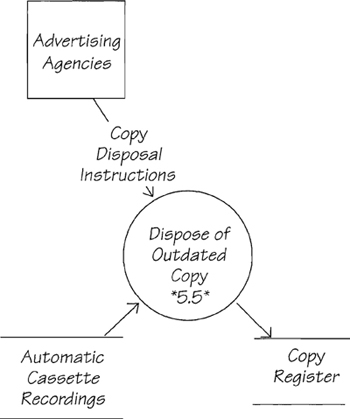
Figure 3.12.11: The current physical model for event 5. Note that the response involves a single process.
The definition for the incoming data shows
Copy Disposal Instructions = * Data flow. Instruction from an agency to dispose of an outdated commercial copy recording.*
Commercial Copy Number + Product Name + Disposal Date
The product name in this flow is nonessential. It is used only by people to check that they have found the correct ACR. Essentially, the system can match by COMMERCIAL COPY NUMBER alone. When the copy is located, the ACR must be removed from the library, and the copy marked as deleted.
The existing data model shows a COMMERCIAL COPY entity, which is the most likely replacement for the physical files. The data dictionary defines
Commercial Copy = * Entity. The material that is transmitted during the time occupied by a commercial spot. *
Commercial Copy Number + Physical Copy
+ {Copy Transmission Date}+ Disposal Date
* Note that this contains an internal repeating group so is not yet fully normalized *
By matching to this entity, the system can remove the copy. Our essential process model is shown in Figure 3.12.12. The mini specification reads
Mini specification 5 Dispose of Outdated Copy
Find the COMMERCIAL COPY that matches the COMMERCIAL COPY NUMBER in the
COPY DISPOSAL INSTRUCTIONS
DISPOSAL DATE on the COMMERCIAL COPY= DISPOSAL DATE from the
COPY DISPOSAL INSTRUCTIONS
Destroy the physical medium of the copy and record the DISPOSAL DATE
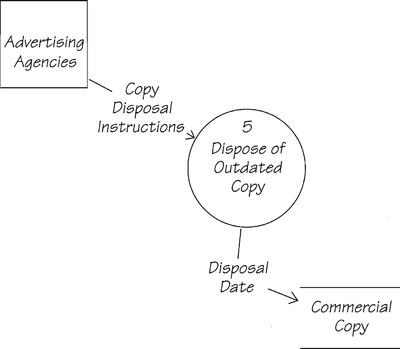
Figure 3.12.12: The essential process model for event 5. As there is only one entity involved in this event-response, you don’t need to draw a data model.
A question raised by this response is what happens if the copy is deleted and there is no other copy available for a campaign that is still running? Does the system refuse to delete the copy (against the wishes of the agency that has said that the copy is not to be used)? Or does the system delete the copy and issue a warning? Perhaps it might even suspend any bookings for the campaign.
Event 6 Supplier wants to sell a new programme
Again, we visit the Programme Transmission Department for the response to event 6. The current response involving one physical data store is shown in Figure 3.12.13.

The task is to determine if Piccadilly wants the NEW PROGRAMME and, if so, to buy it by issuing the PROGRAMME PURCHASE AGREEMENT. We started our essential model by examining the incoming and outgoing data flows to determine the necessary stored data. We used entities and relationships from the current data model to help here. Our version of the essential model is shown in Figure 3.12.14.
Let’s look at the data the system uses to assess the offered programmes:
New Programme = * Data flow. Describes a programme offered by an English or overseas programme supplier.*
Programme Name + Programme Type
Programme Description + Programme Duration
+ Programme Price + Programme Episodes
+ {Performer Name}
+ (Producer Name + Director Name)
+ Supplier Name
The outgoing flow is defined like so:
Programme Purchase Agreement = * Data flow. Terms negotiated with an external supplier. *
Programme Name + Supplier Name + Programme Price
The following mini specifications explain the processes we chose. Although the organization of your specifications may be different, they should contain all the elements of the incoming data flow. If an element is disregarded, you should have a reason for doing so.
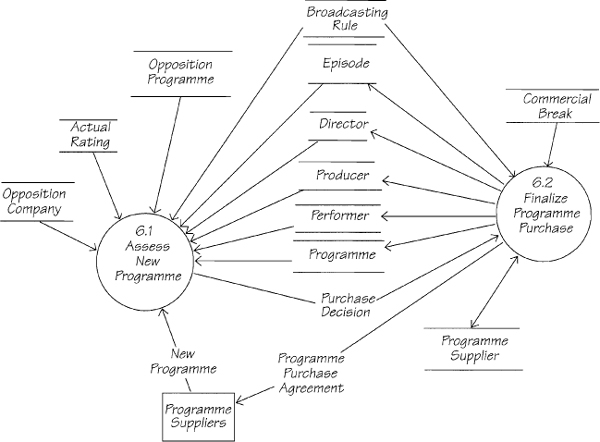
Figure 3.12.14: The essential process model for event 6. It uses two processes. The data stores are essential entities from the data model.

Mini specification 6.1 Assess New Programme
Input: NEW PROGRAMME
* Deciding which new programmes to buy requires experience in programme scheduling. Rather than attempting to define the decision-making process carried out by the buyer, this specification defines the data used to make the decision. We have used this approach because we’ve frequently uncovered data conservation problems with this kind of subjective process. Understanding the data brings us closer to understanding the skills used by the programme buyer.*
Compare NEW PROGRAMME with all PROGRAMMEs of the same PROGRAMME TYPE
Ensure we do not already have the programme
Check that we have had successful ACTUAL RATINGs for this PROGRAMME TYPE
Consider the DIRECTOR, {PRODUCER}, and {PERFORMER}
Consider whether the NEW PROGRAMME satisfies the BROADCASTING RULEs
Compare the NEW PROGRAMME with all OPPOSITION PROGRAMMEs of the same
PROGRAMME TYPE
If a decision is made to buy the NEW PROGRAMME
Include NEW PROGRAMME in PURCHASE DECISION
If a decision has been made about when to transmit the NEW PROGRAMME
For each EPISODE
Include the EPISODE SCHEDULED DATE, EPISODE START TIME,
and EPISODE END TIME in PURCHASE DECISION
Issue PURCHASE DECISION
Output: PURCHASE DECISION
Mini specification 6.2 Finalize Programme Purchase
Input: PURCHASE DECISION
Create an instance of PROGRAMME
Find a DIRECTOR entity that matches the DIRECTOR NAME in the
PURCHASE DECISION
If no match is made
Create an instance of DIRECTOR
Create an instance of DIRECTING
For each PRODUCER NAME in the PURCHASE DECISION
Find a matching PRODUCER entity
If no match is found
Create an instance of PRODUCER
Create an instance of PRODUCING
For each PERFORMER NAME in the PURCHASE DECISION
Find a matching PERFORMER entity
If no match is found
Create an instance of PERFORMER
Create an instance of APPEARING
Find a PROGRAMME SUPPLIER entity that matches SUPPLIER NAME
in the PURCHASE DECISION
If no match is found
Create an instance of PROGRAMME SUPPLIER
Create an instance of SUPPLYING
For each EPISODE SCHEDULED DATE in the PURCHASE DECISION
Create an instance of EPISODE
Create an OCCURRING relationship with PROGRAMME
For each OPPOSITION PROGRAMME in the PURCHASE DECISION
Create a COMPETING relationship with EPISODE
For each COMMERCIAL BREAK that lies between EPISODE START TIME and EPISODE
END TIME with reference to the BROADCASTING RULEs
Create a SCHEDULING relationship
Issue PROGRAMME PURCHASE AGREEMENT
Output: PROGRAMME PURCHASE AGREEMENT
Event 7 Production company makes a commercial
We’re still in the Programme Transmission Department for event 7. Again, the response termination points are at data stores. Figure 3.12.16 shows the current approach to receiving commercial copy.

Examine the stored data for the current model. There is some overlap:
Copy Register = * Data store *
{Commercial Copy Number + Product Name + Campaign Number
+ {Copy Transmission Date}
+ (Disposal Date)}
Automatic Cassette Recordings = * Data store and material store *
{Commercial Copy Number + Automated Cassette Recording
+ Production Company Name + Agency Name + Product Name}
The store AUTOMATIC CASSETTE RECORDINGS holds the physical cassette (ACR) along with the information that is written on the case of the cassette. The copy register is the paper copy of the information. Suppose that you merged the two data stores into one and eliminated the redundant data. Let’s call this working definition INFORMATION ABOUT COPY:
Information About Copy = Commercial Copy Number + Product Name
+ Campaign Number + Production Company Name
+ Agency Name + Automated Cassette Recording
+ {Copy Transmission Date}
+ (Disposal Date)}
How much of these data can be gained from the incoming flow? The definition is
Commercial Copy Recording = * Data flow plus physical cassette. Commercial
copy recording sent by the production company to Piccadilly’s
Programme Transmission Department. *
Commercial Copy Number + Automated Cassette Recording
+ Production Company Name + Agency Name + Product Name
This event-response can only store data that come from the incoming flow; there is no other input to the process. We have already established that products may only be represented by one agency at a time, so the agency name is not essential if the system is told the product name. If you reduce INFORMATION ABOUT COPY to whatever comes from the incoming flow and remove the redundancy from your working definition, you get
Information About Copy = Commercial Copy Number + Product Name
+ Production Company Name + Automated Cassette Recording
Now attribute the elements to entities. The first three elements can be attributed to these entities: COMMERCIAL COPY, PRODUCT, and PRODUCTION COMPANY.
A FILMING relationship between PRODUCTION COMPANY and COMMERCIAL COPY enables Piccadilly to follow up faulty automated cassette recordings. We know that the PUBLICIZING relationship between PRODUCT and COMMERCIAL COPY is certainly interesting (a previous event used it). The data model that emerges is shown in Figure 3.12.17.
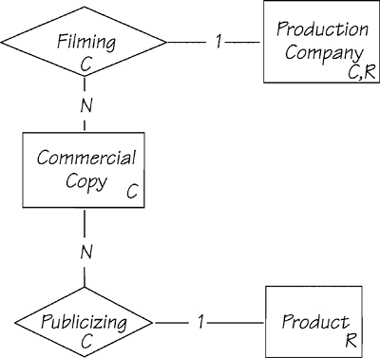
The entities from the event-response data model are now used to replace the physical files in the process model, giving the model in Figure 3.12.18.
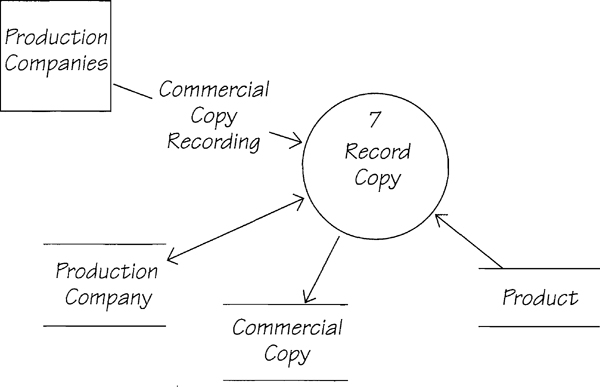
Note that the essential version ignores the reality of the ACR’s being recorded on videotape. How does something tangible come to be recorded along with the intangible data? Remember that you are dealing with the essential view. In this view, there is no technology within your context, so the medium of the data is irrelevant. Commercial copy, the images of the actors and actresses pushing their products, is treated in the same way as the name of the production house and the number of the recording.
What do you gain by ignoring the technology? If you assume for the essential view that there is no technology, then when the time comes to implement the new system, you are not bound by the technological decisions of the past. The essential data model shows an entity COMMERCIAL COPY with attributes of an identifying number and the PHYSICAL COPY itself.
Wouldn’t it be a better implementation if the copy were stored digitally in the same place as the information about the copy? If the cassettes were eliminated, there would be no need for a librarian to extract the cassette some hours ahead of transmission time. If a digital version of the copy could be broadcast, then Piccadilly could continue selling the airtime right up to a few seconds before the break.
Programme ratings can be affected by events outside the station’s control. A sensational, late-breaking story can lift the ratings for the news beyond its expected audience. Advertisers would like to be able to take advantage of this phenomenon, and buy into a break minutes before it went to air.
The moral of the story is the purer the essential model, the better the implementation.
Event 8 Personnel hires a sales executive
In Figure 3.12.19, note that the process ASSIGN AGENCIES TO EXECUTIVE has another incoming flow (NEW AGENCY) and an outgoing flow (NEW AGENCY FORM) in the full version of the current physical model. You can ignore these flows because when modeling this event-response, you are tracking the ripple effect caused by the flow NEW SALES EXECUTIVE. You have already included the other two flows in their appropriate place when you modeled event 9 New agency wants to do business (Chapter 1.9 Modeling an Event-Response and its associated review chapter, 3.8). Remember that the current model reflects how the users currently carry out the business, and they feel that assigning executives is a process regardless of whether it is triggered by a new executive or a new agency.

Looking at the current event-response model, you probably suspect that there is some overlap between the two data stores. The dictionary shows
Agency Register = * Data store. File of agencies and responsible sales executives kept by the Sales Department. *
{Agency Name + Agency Address + Agency Phone Number
+ Sales Executive Name + Servicing Start Date}
Sales Executive Register = * Data store. File of sales executives’ responsibilities kept by the Sales Department. *
{Sales Executive Name
+ {Agency Name + Servicing Start Date + Servicing End Date}}
Suspicions confirmed! If you eliminate the overlap, you get the working definition:
Stored Data For This Event = * This is a hypothetical data store, used only to
explain this event-response*
{Sales Executive Name
+ {Agency Name + Servicing Start Date + Agency Address
+ Agency Phone Number + Servicing End Date}}
Note the use of braces. The agency register shows one sales executive for one agency, but the executive register shows that one sales executive may have many agencies. An agency would have only one address of interest to the system, so all the agency information is collected after the agency name.
These data yield two entities, SALES EXECUTIVE and ADVERTISING AGENCY, and because they have appeared together in files, they must be related. (An earlier exercise discussed this relationship.) The data model appears in Figure 3.12.20.

The first part of the response is straightforward. The new sales executive’s details are to be recorded by the system. The incoming data flow is this:
New Sales Executive = * Data flow *
Sales Executive Name + Sales Executive Address
+ Sales Executive Start Date
All of these elements become attributes of the SALES EXECUTIVE entity. Thus, you can replace the SALES EXECUTIVE REGISTER with the SALES EXECUTIVE entity. The second part of the response is to make the executive work by making him responsible for selling to one or more agencies. To do that, the process must find appropriate agencies and establish the relationship between them and the executive. The mini specification for event 8 reads
Mini specification 8 Assign Agencies to Executive
Input: NEW SALES EXECUTIVE
With reference to the event-response data model
Create an instance of SALES EXECUTIVE
If there are any ADVERTISING AGENCY(s) without a current SELLING
relationship
For up to 10 ADVERTISING AGENCY(s)
Create a SELLING relationship with SALES EXECUTIVE
SERVICING START DATE = today’s date
This mini spec raises some questions: What if there are no unassigned agencies? Is there some way of re-allocating agencies already assigned? What happens if there are more than ten agencies that are not assigned? These will have to be resolved and the answers added to the mini specification. It is unlikely that the users’ input will change the essential model. We show it in Figure 3.12.21.

Figure 3.12.21: The essential process model for event 8. The physical files have been replaced with the essential entities. The relationship is shown because it contains a data attribute stored by this event-response.
Event 10 Agency cancels a spot
To model event 10, let’s start by looking at what happens in the present system. The current physical model is shown in Figure 3.12.22.

The BREAKCHART and the CAMPAIGN FILE probably hold a lot of data that aren’t needed by this event-response. A quick glance at the data dictionary confirms this theory:
Breakchart = * Data store. Board containing hanging files plus breaksheets, used to record available time and sold time. *
{Breakchart Date
+ {Programme Name + Episode Start Time + Episode End Time}
+{Break Start Time + Break End Time + Break Minimum Rate
+ {Spot Number + Product Name + Spot Duration + Spot Price
+ Rate Moveability + Spot Booking Agreement}}}
+{Programming Rule}
Campaign File = * Data store. File kept in the Sales Department. *
{Campaign Requirements + Suggested Campaign}
Campaign Requirements = * Data flow. An agency’s description of requirements for an advertising campaign. *
Agency Name + Product Name + Campaign Budget Total
+ Piccadilly Budget Amount + Target Audience
+ Target Rating Percentage + Campaign Duration
+ Campaign Start Date + Campaign End Date
+ {Required Spot Duration}
Suggested Campaign = * Data flow. Suggestions to an agency about the makeup of an advertising campaign. *
Agency Name + Product Name + Campaign Number
+ Campaign Start Date + Campaign End Date
+ {Required Spot Duration + Spot Price + Rate Moveability
+ ([Breakchart Date + Break Start Time | {Breakchart Date}])}
+ Target Rating Percentage + Campaign Predicted Rating
We could make a data model from these definitions, but this time let’s take a shortcut and use the data model from Chapter 3.6 (Figure 3.6.10). Note the COMMERCIAL SPOT entity. It is identified by a SPOT NUMBER, and that is central to the whole response. The data flow that triggers this event-response looks like this:
Spot Cancellation = * Data flow *
Agency Name + Product Name + Campaign Number
+ Spot Number
A reasonable approach here is to say that the process can locate the spot to be canceled using the SPOT NUMBER. Once that is found, the task is to delete it and sever the relationships between it and the surrounding entities. Look at the data model in Figure 3.6.10 and ask, “Which relationships and which entities are affected?” The SPOT CANCELLATION data flow gives you some clues. It includes AGENCY NAME and CAMPAIGN NUMBER. These are the identifying attributes of ADVERTISING AGENCY and ADVERTISING CAMPAIGN, so it is reasonable to say that those entities are referenced, and the relationship between them and COMMERCIAL SPOT is deleted. The product name is also supplied in the data flow, but as there is no direct connection between COMMERCIAL SPOT and PRODUCT, you cannot delete the relationship. Why is PRODUCT NAME supplied by the agency? It is probably used as a double check by the spot manipulators, but we must ask the question in order to find out whether PRODUCT NAME is essential for this event.
Look further at the data model. Remember that this spot has not yet been transmitted (Piccadilly’s rules sensibly do not allow agencies to cancel spots after transmission), so only the pre-transmission relationships are affected. For example, the spot is OCCUPYING a COMMERCIAL BREAK. That relationship is deleted by this event-response. Similarly, once canceled, the spot does not have a PRICING AGREEMENT relationship with a SPOT RATE, a MOVEABILITY relationship with RATECARD SEGMENTs, a CAMPAIGN MAKE UP relationship with an ADVERTISING CAMPAIGN, a BUYING relationship with an ADVERTISING AGENCY, or an ALLOCATING relationship with a COMMERCIAL COPY. The SPOT MEASURING and BILLING relationships do not yet exist for this untransmitted COMMERCIAL SPOT.
Remember that the data model in Chapter 3.6 is only the first cut, and it doesn’t necessarily show all the relationships and entities needed by this event-response. You will see later how your event-response modeling will result in a proved and updated system data model. Look through the data dictionary definitions of the data stores to see if you find any other relationships or entities that might be concerned with this event-response.
The data that we consider relevant to this response are shown in Figure 3.12.23. The essential process model develops after we figure out the data. Ours is in Figure 3.12.24.
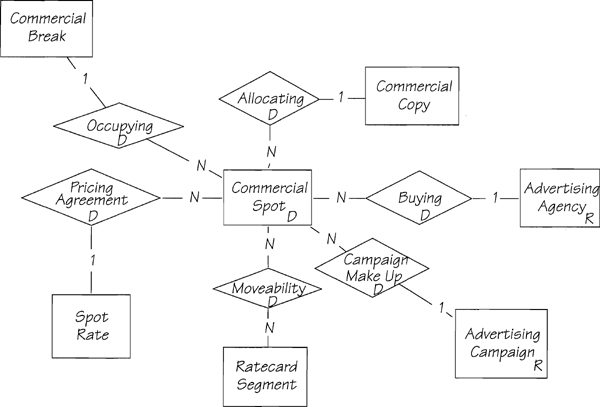
Figure 3.12.23: The data model for event 10, showing the relationships and entities that are affected by this response. Note the CRUD operators.
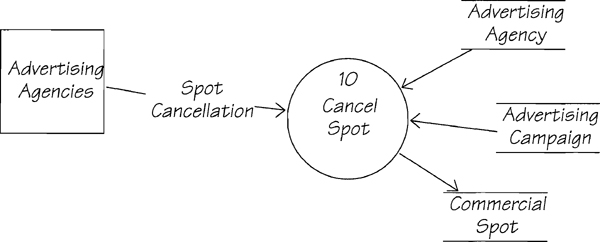
Figure 3.12.24: The essential process model for event 10. No relationship is shown because none has any data attributes. Note the flow going into COMMERCIAL SPOT. This is the correct notation for a deletion.
As all the hard work was done when you figured out the data model, let’s make use of it. This is the mini specification we wrote:
Mini specification 10 Cancel Spot
Input: SPOT CANCELLATION
With reference to the event-response data model
The CRUD notation contained in the entities and relationships, along with the data dictionary definitions, is sufficient to specify this process.
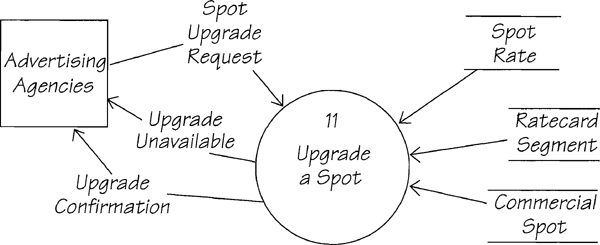
Event 11 Agency wants to upgrade a spot
The current physical model for event 11 is shown in Figure 3.12.25.
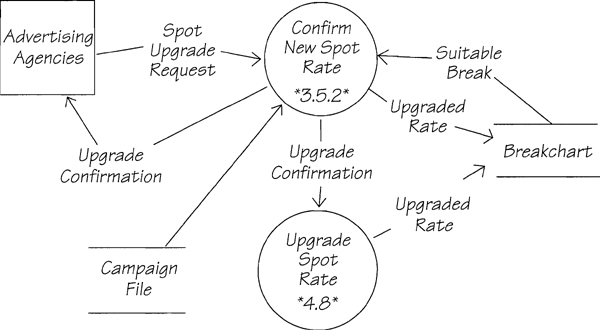
Figure 3.12.25: The current physical model for event 11. This response brings together processes from two departments.
Because the current response to this event takes place in two departments, there will probably be some redundancy in the processing. First, examine the data flows:
Spot Upgrade Request = * Data flow. Increase in rate to avoid preemption.*
Agency Name + Product Name + Campaign Number
+ {Spot Number + Spot Duration + Rate Moveability}
Upgrade Confirmation = * Data flow. Agreement with an agency to upgrade the rate of a spot. *
Agency Name + Campaign Number + Product Name
+ Spot Number + Spot Duration + Spot Price
+ Rate Moveability
From these definitions, we can deduce that CONFIRM NEW SPOT RATE adds SPOT PRICE to the data in SPOT UPGRADE REQUEST to produce UPGRADE CONFIRMATION. The process references the CAMPAIGN FILE, presumably because the agency supplies the CAMPAIGN NUMBER. However, as the breakchart can be accessed using the SPOT NUMBER, there is no need to access the campaign file. The current view also shows a duplicated update of the breakchart. This may be due to incorrect modeling, or it may be because some executives upgrade the breakchart while others leave it to the Commercial Booking Department. Whatever the reason, essentially we only need to update the data once.
This event is now similar to event 10 because essentially it is concerned with a COMMERCIAL SPOT, which we know is identified by SPOT NUMBER. Look at the stored data surrounding COMMERCIAL SPOT and determine which relationships and entities are altered by this response. We derived the data model shown in Figure 3.12.26.
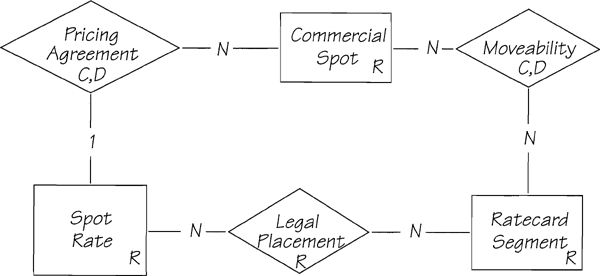
Figure 3.12.26: The data model for event 11. Note how the CRUD operators reveal the essential processing.
Once you have the data, the essential process model is straightforward to build. Ours is shown in Figure 3.12.27. Note that it needs only one bubble, and that none of the relationships is shown as they have no data attributes. The combination of the event-response process and data models tells you everything you need to know about this event. If you feel that by omitting the relationships from the essential process model you are not showing the complete picture, you may add them. However, we have found that the best way to work is to show relationships in the process model only when they contain data utilized by the event-response. This still tells the full story, and avoids unnecessary clutter in your models.
We shall reuse the mini specification from event 10.
Mini specification 11 Upgrade a Spot
Input: SPOT UPGRADE REQUEST
With reference to the event-response data model
The CRUD notation contained in the entities and relationships, along with the data dictionary definitions, is sufficient to specify this process.
Output: UPGRADE CONFIRMATION, UPGRADE UNAVAILABLE
Event 12 Agency chooses spots for a campaign
This event takes place sometime after the sales executive has selected a suggested campaign. The agency considers the executive’s suggestions, and then picks the spots that it considers best for the campaign. The current response involves the Sales Department and the Commercial Booking Department. The processes are collected to make the response shown in Figure 3.12.28.

Because people in different departments want to hold private data, chances are this event-response contains redundant processing and data. Looking at the processes, we can say that essentially the task is to get the selected spots onto the breakchart, and if that activity displaces any spots, to find new homes for the homeless. That there are only two essential processes is an assumption on our part. However, starting with an assumption, and then proving it, is a reasonable way to proceed for this kind of event-response.
We also assumed that the bubbles in the chain before SLOT SPOT are not essential. PREPARE SPOT STICKER is a prime example of an implementation process. Stickers are what Commercial Booking uses at the moment to identify the duration of a spot. It could be done in many other ways, and so is not essential. FINALIZE deal is the executive’s double-checking the campaign availability that was originally offered and recording the selected spots in a file. While both these tasks are essential, we will find they are duplicated by other processes in this event-response. The point is that it is not essential for the same task to be done more than once.
Now let’s examine the task of getting the spot onto the breakchart. The breakchart is a current physical file, so we must find the essential equivalent. Its dictionary entry reads
Breakchart = * Data store. Board containing hanging files plus breaksheets, used to record available time and sold time. *
{Breakchart Date
+ {Programme Name + Episode Start Time + Episode End Time}
+ {Break Start Time + Break End Time + Break Minimum Rate
+ {Spot Number + Product Name + Spot Duration + Spot Price
+ Rate Moveability + Spot Booking Agreement}}}
+ {Programming Rule}
The entry for the incoming flow is
Selected Spots = * Data flow. Spots selected by an agency as part of a campaign.*
Agency Name + Campaign Number + Product Name
+ Campaign Start Date + Campaign End Date
+ {Spot Number + Spot Duration + Spot Price
+ Rate Moveability
+ ([Breakchart Date + Break Start Time | {Breakchart Date}])}
The process of slotting the spots is next. When the sales executive suggests the campaign to the agency, he finds suitable breaks for the suggested spots. However, suggested spots are not booked into breaks before the agency makes its selection. The spot-slotting process is a matter of matching to the spot number; if the agency hasn’t changed the suggested price and moveability, and if there is availability in the time period selected by the agency, the spot is slotted. If the agency changes the suggested price or moveability for a spot, the existing relationships must be deleted and new ones created (Figure 3.12.29).
Mini specification 12.1 Slot Selected Spots
Input: SELECTED SPOTS
With reference to the event-response data model
For each SPOT NUMBER on SELECTED SPOTS
Find the matching COMMERCIAL SPOT
* Identify the criteria for a suitable slot for the spot *
Refer to related SPOT RATE to ensure selection is appropriate for rate
Refer to related RATECARD SEGMENTs to find all legal segments for
the rate
If the existing PRICING AGREEMENT and/or MOVEABILITY
relationships are not consistent with those for SELECTED SPOTS
Delete the existing relationships and create new ones
Refer to BREAK START TIME on SELECTED SPOTS to find selected break
Refer to {BREAKCHART DATE} on SELECTED SPOTS to find selected days
Refer to SPOT DURATION on SELECTED SPOTS to find duration of required slot
Identify the COMMERCIAL BREAKs that satisfy the above criteria
* Select a suitable slot *
If there is a slot that does not have an OCCUPYING relationship
with another COMMERCIAL SPOT
Then you have found a SUITABLE SLOT
Otherwise
If there is a slot that does have an OCCUPYING relationship
with another COMMERCIAL SPOT
If the other COMMERCIAL SPOT has a lower SPOT RATE
Delete the OCCUPYING relationship
Issue DISPLACED SPOT
You have found a SUITABLE SLOT
If you have found a SUITABLE SLOT
Create an OCCUPYING relationship between COMMERCIAL SPOT and
COMMERCIAL BREAK
Create a BUYING relationship between COMMERCIAL SPOT and
ADVERTISING AGENCY
Add COMMERCIAL SPOT to AGREED CAMPAIGN
Otherwise
Add UNAVAILABLE SLOT to AGREED CAMPAIGN
Output: DISPLACED SPOT, AGREED CAMPAIGN
* It would be better to partition this process into smaller processes, partly because this mini specification is too long and complex and partly because many parts of this process are repeated in other parts of the system. For example, RESLOT DISPLACED SPOT uses much of the same logic contained in this process. With this strategy, each smaller process would be specified once and that specification would be pointed to by other processes in the system.*

Mini specification 12.2 Reslot Displaced Spot
Input: DISPLACED SPOT
With reference to the event-response data model
* This specification is virtually identical to SLOT SELECTED SPOTS. The difference is when there is not a suitable slot for DISPLACED SPOT, then the SPOT RATE is upgraded to the next highest rate and another attempt is made to slot the spot. This continues until the spot is successfully slotted or until there are no slots available at the highest rate. *
If the spot has been preempted
PREEMPTION REPLACEMENT is issued to inform the agency
Output: PREEMPTION REPLACEMENT

Event 13 Spots are transmitted
Event 13 is an interesting temporal event. In Figure 3.12.31, the data flow BREAK TRANSMISSION SCHEDULE is actually a false data store. It is created each evening by the Commercial Booking Department and held by the programme transmission controller until the breaks are transmitted. If we ignored the geographical boundary between the two departments and the paper technology that they use, there would be no reason to make up this schedule. The transmission process could look directly at the essential stored data.
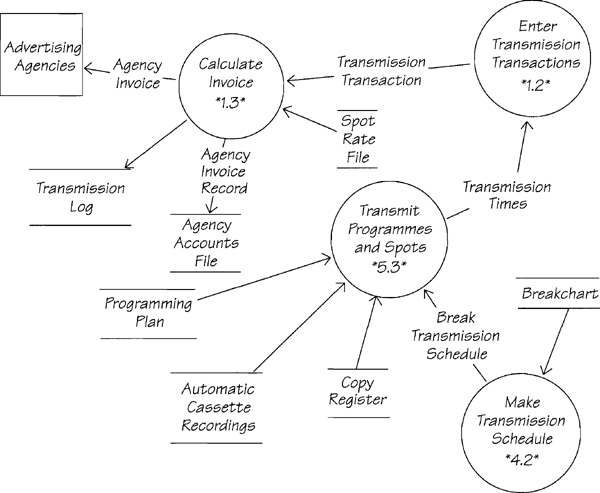
This event-response is unusual in that it takes all day. The invoices are sent to the agencies at the end of each broadcasting day. Why is there no temporal event called Time to produce invoices? Because the production of invoices is part of the response to the transmission event; it takes place after the last spot has been broadcast.

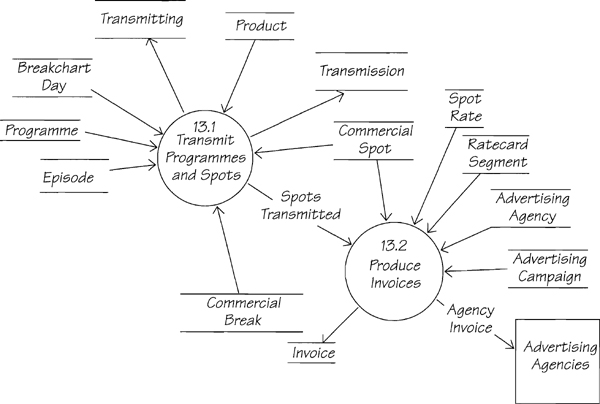
Mini specification 1:3.1 Transmit Programmes and Spots
With reference to the event-response data model
Find the BREAKCHART DAY that has a BREAKCHART DATE corresponding to today’s date
Transmit EPISODEs and COMMERCIAL SPOTs according to the EPISODE START TIME
and the BREAK START TIME
For each EPISODE transmitted
Create a TRANSMISSION relationship between the EPISODE and the
BREAKCHART DAY
PROGRAMME TRANSMISSION DATE and PROGRAMME
TRANSMISSION TIME are the actual transmission date and time of the
EPISODE
For each COMMERCIAL SPOT transmitted
Find the PRODUCT associated with this spot
Find the COMMERCIAL COPY whose COPY TRANSMISSION DATE
matches today’s date
Create an ALLOCATION relationship between the COMMERCIAL SPOT
and the COMMERCIAL COPY
Create a TRANSMITTING relationship between the
COMMERCIAL SPOT and the COMMERCIAL BREAK
SPOT TRANSMITTED TIME and SPOT TRANSMITTED DATE
are the actual transmission time and date of the spot
Add this COMMERCIAL SPOT to the SPOTS TRANSMITTED
Issue SPOTS TRANSMITTED
Output: SPOTS TRANSMITTED
Note how each spot is added to SPOTS TRANSMITTED when it is broadcast. SPOTS TRANSMITTED is input to process 13.2.
Mini specification 13.2 Produce Invoices
Input: SPOTS TRANSMITTED
With reference to the event-response data model
For each AGENCY NAME
For each CAMPAIGN NUMBER
For each SPOT NUMBER on SPOTS TRANSMITTED
Find SPOT RATE with a PRICING AGREEMENT relationship
Add SPOT PRICE to INVOICE TOTAL
INVOICE DATE = today’s date
INVOICE NUMBER= next available number
Create an instance of INVOICE
Create an instance of BILLING relationship between the COMMERCIAL SPOT and the INVOICE
Issue AGENCY INVOICE
Output: AGENCY INVOICE
Event 14 Time to analyze revenue
Event 14 is a temporal event. The current response, shown in Figure 3.12.34, indicates that the essential process will be revealed by inspecting the data flow and determining what stored data are necessary to provide sufficient data for the flow.
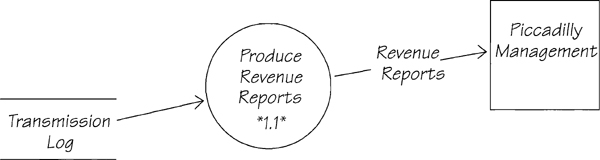
Revenue Reports = * Data flow. Computer reports used by management to help set sales targets.*
Breakchart Date + Daily Revenue
+ {Spot Number + Spot Rate + Product Name
+ Spot Transmitted Time + Spot Price}
Let’s work out what stored data in the form of entities and relationships are needed. The data model in Chapter 3.6 will be of some help, but by now you know enough about the data in this system to figure out the entities needed.
Start with an easy one. SPOT NUMBER is the identifier of a COMMERCIAL SPOT. Even if you have forgotten the name or used a different one, you know that Piccadilly is interested in all the spots that it broadcasts. SPOT RATE is not an attribute of the spot (there are many spots with the same rate), so SPOT RATE must be an attribute of another entity related to the spot. For SPOT TRANSMITTED TIME, there are several spots in a break and they all take up time during the break. So the spot must relate to a break, or COMMERCIAL BREAK as we have called it.
We determined the rest of the necessary entities and relationships by going through the data flow definition. We then checked the data stores to make sure we hadn’t missed anything:
Transmission Log = * Data store *
Spot Transmitted Date
+ {Spot Number + Spot Booking Agreement + Spot Price
+ Rate Moveability + Product Name + Spot Transmitted Time}
The transmission log contains data that are not used by this event. The data may either be used by another event-response or simply be redundant data. You can ignore it. Our data model is in Figure 3.12.35.
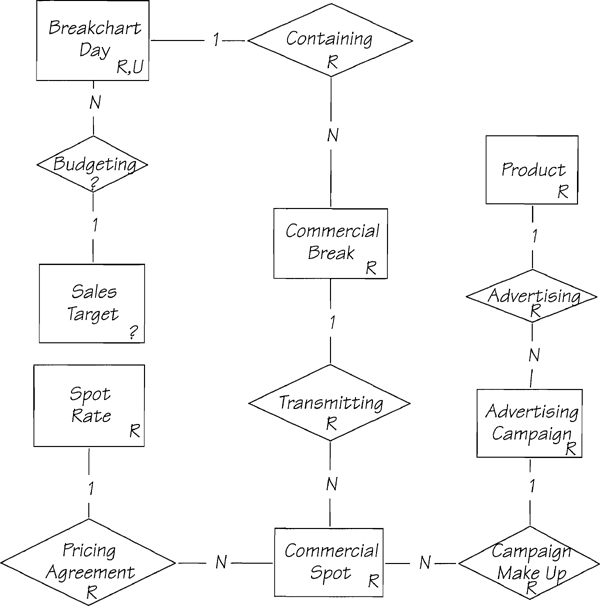
Figure 3.12.35: The data model for event 14, derived from the output data flow. The question mark indicates a question we had about an entity and relationship that are not accessed, but could be useful if they were. Perhaps the report doesn’t use them now because of current technology limitations.
The essential process model is in Figure 3.12.36. We didn’t write a mini specification for this event-response because the data model, its CRUD operators, and this data dictionary entry are sufficient specification in themselves.
Daily Revenue = * Data element. Revenue made by Piccadilly for all the commercial spots transmitted on one breakchart day. Derivable: total of all Spot Prices for every Commercial Spot having a Transmitting relationship with the Commercial Breaks on today’s date.*

Event 15 Time to analyze the breakchart
Event 15 is another temporal event. Its purpose is to issue preemption warnings to the agencies, with the goal of persuading them to raise the rate they are paying for a spot. Agencies want to spend the advertisers’ money, as most agencies are paid a percentage of the airtime booking fee, but they also want to get the best value for their clients’ money, so there will be more of it next year.
The current response (Figure 3.12.37) shows three processes. One, *4.7*, analyzes the airtime position; another, *3.5.1*, prepares the warning and sends it to the agency; and the third, *3.4*, sets the minimum rate for the breaks. Notice that we have only extracted part of process *3.4* from the original physical model. The process in the physical model responds partly to event 15 and partly to event 2. Look back at event 2 to see that the other parts of the original *3.4* are included in the response to this event.
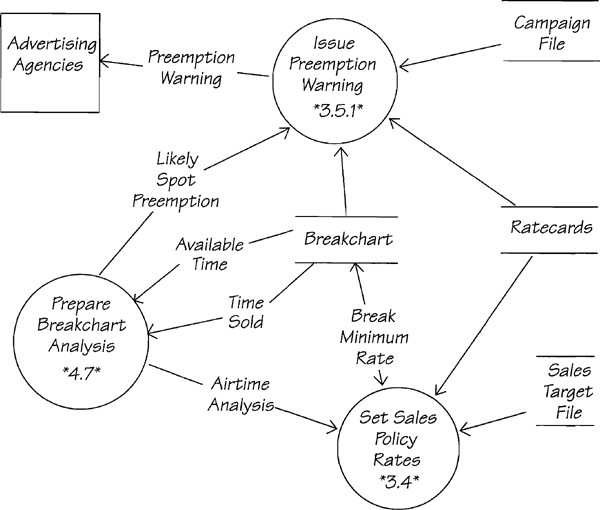
Replacing the breakchart with its essential data equivalent is the next step. Our essential view is shown in Figure 3.12.38.
How did we arrive at the essential data? Again, by looking at the definition of the files to be replaced, and rationalizing them into entities and relationships. The dictionary entry for the first file is
Breakchart = * Data store. Board containing hanging files plus breaksheets, used to record available time and sold time. *
{Breakchart Date
+ {Programme Name + Episode Start Time + Episode End Time}
+ {Break Start Time + Break End Time + Break Minimum Rate
+ {Spot Number + Product Name + Spot Duration + Spot Price
+ Rate Moveability + Spot Booking Agreement}}}
+ {Programming Rule}
Since we’ve done this several times already in this chapter, we’ll simply present the data model (Figure 3.12.39) and let you figure it out. Note that not all of the data in this model are used by all the processes. For example, the process that issues the warning to the agency is the only one that uses the agency and campaign data. In the essential model, the interfaces around each process contain only the data that are necessary for that process to do its work.
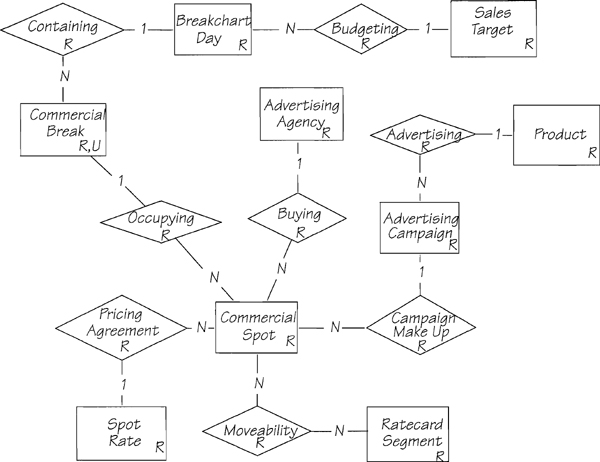
Figure 3.12.39: The data model for event 15. Note how the CRUD operators reveal the essential processing.
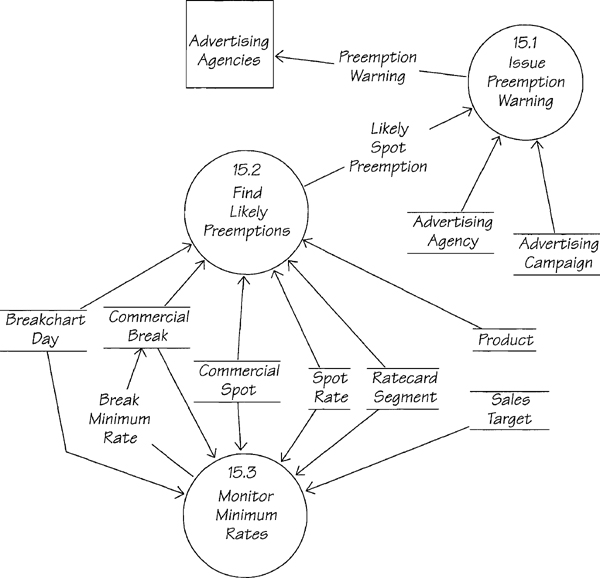
Mini specification 15.2 Find Likely Preemptions
With reference to the event-response data model
At 9 AM each day
For three BREAKCHART DAYs starting from today
For each COMMERCIAL BREAK that has a CONTAINING relationship
* Determine if the break is full *
Accumulate the SPOT DURATIONs of all COMMERCIAL SPOTs having an
OCCUPYING relationship
If the accumulation = BREAK DURATION
For each COMMERCIAL SPOT having an OCCUPYING relationship
Find RATE MOVEABILITY on the SPOT RATE that has a
PRICING AGREEMENT relationship
If RATE MOVEABILITY is not = Fixed
Issue a LIKELY SPOT PREEMPTION
Output: LIKELY SPOT PREEMPTION
You can specify the issuing process by referring to the data model in Chapter 3.6. You can use the technique of referring to the data model to specify most of the policy in processes 15.1 and 15.3. We will need to ask the users about the decision making process for setting the BREAK MINIMUM RATE.
Notice how the process MONITOR MINIMUM RATES interfaces with the other two processes through the essential stored data. This indicates that we really have two event-responses here. Recall that we thought it was only one event because it was presented as TIME TO ANALYZE THE BREAKCHART. Our modeling work has uncovered the truth. There are two very different reasons for analyzing the breakchart, and both are separate temporal events. At this point, we should break this event into two: TIME TO FIND LIKELY PREEMPTIONS and TIME TO MONITOR TARGETED REVENUE.
The event that monitors the targeted revenue is unusual because there are no flows connecting the processing to a terminator. The policy says that at a preset time before transmission, the unsold time is analyzed. If there is an excess of availability, the break minimum rate is adjusted using the sales target as a guideline to try to make the time more attractive to the agencies. This also raises a question about policy: Should there be a flow to the agencies telling them that some cheaper time has become available?
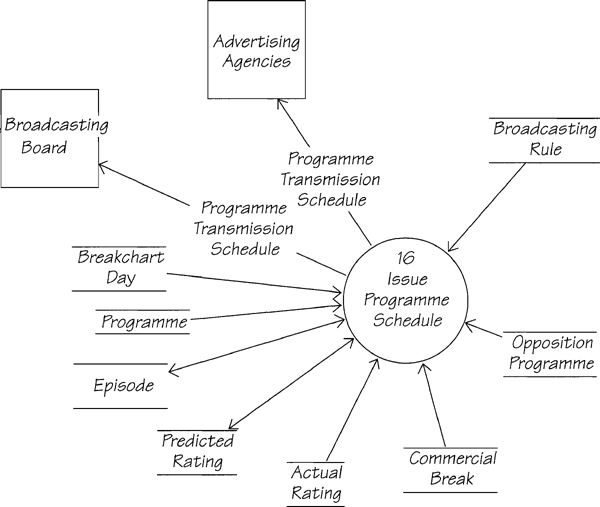
Event 16 Time to finalize new programme schedule
We made the temporal event-response for event 16 into an essential model in the same way as for event 14. One difference, though, is that the data are more complex. The current model is in Figure 3.12.40.

The output data are
Programme Transmission Schedule = * Data flow. Piccadilly’s planned transmission for the next quarter. *
{Programme Transmission Date
+ {Episode Number + Episode Start Time + Episode End Time
+ Programme Name + Programme Description
+ Programme Type + Predicted Rating}
+ {Break Start Time + Break End Time}}
We worked through these data elements and came up with the data model shown in Figure 3.12.41.

There is much overlap in the data stored by the physical event-response. For example, the PROGRAMME TRANSMISSION SCHEDULE is stored three times. The PRELIMINARY SCHEDULE is stored and later retrieved by the same event-response. When the data are reduced to the essentials, the need to have multiple bubbles for this event-response disappears. We fitted all the essentials into the one process shown in Figure 3.12.42.
The mini specification for this event is more complex than we expected:
Mini specification 16 issue Programme Schedule
With reference to the event-response data model
Taking the BROADCASTING RULEs into account
On the first day of the quarter
Prepare a PROGRAMME TRANSMISSION SCHEDULE starting on the first day of the
next quarter
For each BREAKCHART DAY within the next quarter
For each EPISODE having an EPISODE SCHEDULED DATE within the next quarter
Add defined details to the PROGRAMME TRANSMISSION SCHEDULE
For each COMMERCIAL BREAK having a BREAK SCHEDULING relationship
Add defined details to the PROGRAMME TRANSMISSION SCHEDULE
If there is any unoccupied time during the BREAKCHART DAY
Search for a PROGRAMME with a PROGRAMME DURATION to fit into
the unoccupied time
Create an instance of EPISODE
Create a PROXIMITY relationship with the affected COMMERCIAL
BREAKs
If the chosen PROGRAMME does not fit exactly into the unoccupied time
For each of the affected EPISODEs
Update the EPISODE START TIME and
EPISODE END TIME
Delete the PROXIMITY relationship with the COMMERCIAL
BREAKs that no longer fall during, directly before, or
directly after the EPISODE
If the chosen EPISODE does not have an EPISODE PREDICTING relationship with a PREDICTED RATING
For each AUDIENCE TYPE
Take an average of the ACTUAL RATINGs for the other
EPISODEs that are related to PROGRAMMEs of the same
PROGRAMME TYPE of the same type
Create PREDICTED RATING
Create PREDICTING relationship with EPISODE
Issue PROGRAMME TRANSMISSION SCHEDULE
Output: PROGRAMME TRANSMISSION SCHEDULE
After we wrote this mini specification, we decided that the process is too complex and would be better if it were split into three: one process responsible for creating a preliminary schedule, another for predicting ratings, and the third for issuing the final programme transmission schedule.

This is a reasonably straightforward event that has the same pattern as many other external events. The purpose of this event-response is to keep track of which opposition programmes occupy what time slots.
The data that this event-response stores can only come from the incoming data flow, so let’s start there.
Opposition Schedule = * Data flow *
Television Company Name
+ {Opposition Transmission Date
+ Opposition Transmission Time + Opposition Programme Name
+ (Opposition Predicted Rating)}
The definition gives up its first entity right away. TELEVISION COMPANY NAME must be the identifier of an entity. Let’s call it OPPOSITION COMPANY. The braces indicate a number of programmes are attached to this company, so that reveals the next entity. Let’s call it OPPOSITION PROGRAMME and give it a relationship to OPPOSITION COMPANY.
Note that each opposition company’s programme has a time and date (and sometimes a rating) attached to it. This enables the system to locate the appropriate Piccadilly programme and record the opposition company’s programme against it. As we saw earlier, some of the programmes shown by Piccadilly are in the form of a series. We used the entity EPISODE to model each showing of a programme. The opposition company’s programme is competing in the same time slot as one of Piccadilly’s, so a relationship between the OPPOSITION PROGRAMME and EPISODE is appropriate. The data model appears in Figure 3.12.44, and the essential process model in Figure 3.12.45.
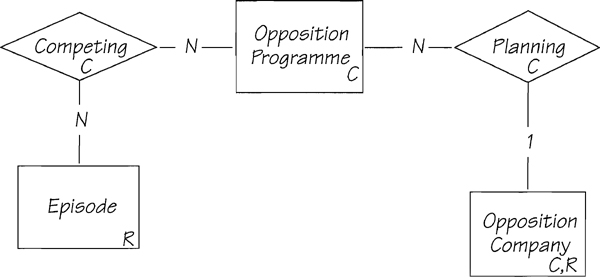
Figure 3.12.44: The data model for event 17. Note the CRUD operators for OPPOSITION COMPANY. If the correct instance of this entity does not exist, the response will create one.
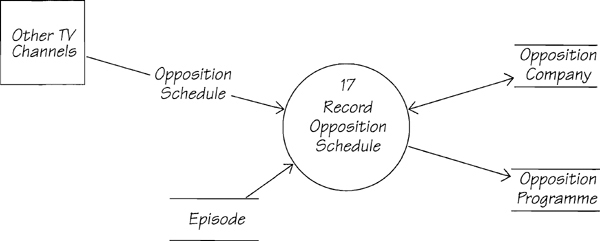
Mini specification 17 Record Opposition Schedule
Input: OPPOSITION SCHEDULE
With reference to the event-response data model
Find the matching OPPOSITION COMPANY that matches the TELEVISION COMPANY
NAME or create one if it does not exist
For each OPPOSITION PROGRAMME NAME
Locate the EPISODE whose EPISODE SCHEDULE DATE and EPISODE START
TIME match the dates and times in the OPPOSITION SCHEDULE
Create an instance of OPPOSITION PROGRAMME
Create the relationships PLANNING and COMPETING
Event 18 Broadcasting Board makes rules
The Broadcasting Board issues programming rules to all television stations. The Board’s intention is to set standards for television programming and for the showing of commercials within these programmes. Piccadilly’s current response is shown in Figure 3.12.46.
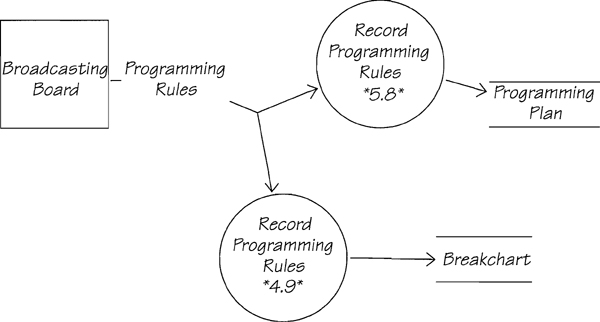
Note that the current system records the rules in two places. This happens because both the Commercial Booking and the Programme Transmission departments need to access the rules. An obvious step to make this into an essential model is to eliminate the duplication.
When the rules arrive, the system’s response is to record the rules, and record the current date as the RULE EFFECTIVE DATE and do nothing else. These rules are used when new programme schedules are being put together and when spots are being added to the breakchart. However, those actions are part of other event-responses. Therefore, the only possible action for the essential model for this particular event is to record the rules. The essential model is shown in Figure 3.12.47.
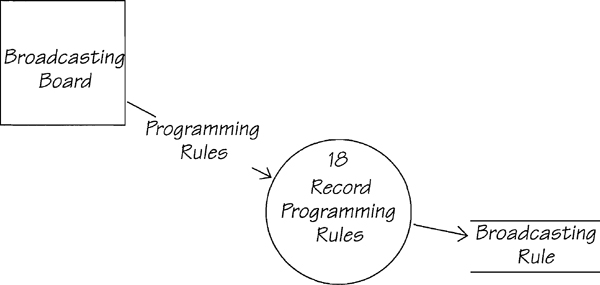
We have not drawn a data model for this event-response, as there is only one entity type, BROADCASTING RULE. Nor have we written a mini specification. The process is specified by a combination of the event-response process model, data dictionary, and data model. Now look at the system data model to see how the BROADCASTING RULE entity is used. The system data model, brought up-to-date with the discoveries you have made by doing essential modeling, appears in Figure 3.12.48.

The Combined Data Model
We derived the system data model in Figure 3.12.48 by combining all the event-response data models, and matching the entities from the various event-response data models. When the same entity appears in several models, combine them by joining at the entity.
Study this model. It represents the final version of the essential data.
 Ski Patrol
This is not a true ![]() Ski Patrol. If you are having problems, the
Ski Patrol. If you are having problems, the ![]() Ski Patrol in Chapter 1.13 More Events has remedial advice. If you made it to this point, we want to congratulate you. It takes a truly heroic effort to work your way through all the events.
Ski Patrol in Chapter 1.13 More Events has remedial advice. If you made it to this point, we want to congratulate you. It takes a truly heroic effort to work your way through all the events.
Along the way, we have tried to show you various approaches to event-response modeling, and we hope you’ve become thoroughly familiar with them.
Take a break now to review what you know about event-response modeling. Also think about any areas that are less than clear. You may wish to go back over some of the models, compare them to what we’ve said in the Textbook chapters, and clarify your understanding of event-responses. You will be using them a lot in your future.
Trail Guide
![]() Easiest and
Easiest and ![]() More Difficult: Go to Chapter 2.13 Modeling New Requirements to see how the next stage of the Piccadilly Project unfolds.
More Difficult: Go to Chapter 2.13 Modeling New Requirements to see how the next stage of the Piccadilly Project unfolds.
![]() Most Difficult: Proceed to Chapter 1.14 Some New Requirements.
Most Difficult: Proceed to Chapter 1.14 Some New Requirements.
![]() Promenade: Chapter 2.13 Modeling New Requirements is the appropriate destination for you.
Promenade: Chapter 2.13 Modeling New Requirements is the appropriate destination for you.