
Chapter 16. Monitoring and Preemptive Support
If you have read this far, you must really be out to impress everyone with a system that is not only scalable and reliable, but also highly available. With the right tools and approach, the five nines once reserved for telecom systems are now easily attainable in whatever other vertical for which you might be developing software. But implementing everything described in the previous chapters is not enough. Just as important as resilient software, redundant hardware, networks, power supplies, and multiple data centers, your secret sauce to high availability is achieving a high level of visibility into what is going on in your system and the ability to act on the information you collect.
Your DevOps team will use all this information for two purposes: preemptive support and postmortem debugging. Monitoring the system will allow them to pick up early warning signs and address problems before they get out of control, either manually or through automation. Is your disk filling up? Trigger a script that does some housekeeping by deleting old logs. Has your load been increasing steadily over the past months as a result of an increase in registered users and concurrent sessions? Deploy more nodes to help manage the load before running out of capacity.
No matter how much of an optimist you might be, you will not be able to catch all problems and bugs before they manifest themselves. Sometimes things go wrong, making you rely on higher layers of fault tolerance to manage failure. When processes or nodes are restarted automatically, you need a snapshot of the state of the system prior to the crash. Together with your historical data, the state snapshot will allow you to quickly and effectively deal with postmortem debugging, figure out what caused the crash, and ensure it never happens again.
If you do not have snapshots of the system, debugging will be not be methodical and you will have to rely on guesswork. Finding a needle in a haystack would be easier. The last thing you want to count on is for errors to politely manifest themselves when you are sitting in front of the computer staring at the screen. They won’t. The system will wait for your lunch or coffee break, or until you’ve gone home, before crashing. Ensuring you have the visibility and historical data will be time well spent prior to launch, paying for itself many times over when you are determining the causes of errors, fixing bugs, and putting in place preemptive measures to ensure the problems you experience do not happen again. In this chapter, we cover approaches to monitoring and preemptive support, introducing some of the most common support automation approaches.
Monitoring
Anyone can see, through a crash dump report, that a virtual machine ran out of memory. But what type of memory caused the crash? Was it the atom table, the memory taken up by the code, the process memory, the binary heap, or system memory? Maybe the system had a surge of login requests that in turn caused the memory spike. Or the latency of a request increased because of a slow third-party API, causing processes to live longer. Or a particular request type failed, triggering an I/O-intensive cleanup procedure, which in turn triggered a lot of other unexpected events or timeouts. Without proper visibility in place, you can only guess the current state of your system and are unable to spot trends and address issues before they escalate. After issues have escalated, lack of historical data makes troubleshooting both time-consuming and daunting. This is why systems need to be monitored, and information stored for later access.
Monitoring is done using a combination of the following facilities:
Logs record state changes in your program. A state change could be part of your business logic, such as a user logging on and initiating a session, or a system state change such as a node joining the cluster.
Metrics are obtained by polling a value at a particular point in time. You could be monitoring system metrics such as CPU utilization and memory usage, ETS table size, the number of open TCP connections, or business metrics such as latency, active sessions, or the number of login requests per hour.
Alarms are a form of event associated with a state. They are raised when certain criteria are met, such as running out of disk space or hitting concurrent session threshold values. Similarly, they are cleared when these criteria are no longer valid: for example, after files are compressed or deleted, or after users log off.
Monitoring should be developed in conjunction with the configuration and management functionality of your system. We refer to this functionality as the operations, administration, and maintenance (OAM) part, or O&M if it does not allow you to configure and manage your business logic. In the remainder of the chapter, we focus on monitoring and use the term OAM to mean both.
In many Erlang systems, especially those designed by architects who
have never had to support a live system, OAM support tends to be missing,
incomplete, or bolted on as an afterthought. If you come across systems
where the only way to find the number of active sessions is by manually
adding the size of the ETS session tables across all nodes, or changing
live configuration is achieved by calling
application:set_env, they’ve done it wrong. All systems
should let you inspect, manage, and do basic troubleshooting without any
knowledge of Erlang or need to access the Erlang shell.
In the telecom world, this noncritical OAM functionality is put in its own node (or node pair for redundancy) for the same reasons discussed in “Node Types and Families”, namely reducing the overhead on the front-end, logic, and service nodes while increasing resilience. The OAM node should be designed to ensure that in case of failure, your system is still capable of servicing requests. This means that only critical OAM functionality is put in non-OAM nodes, usually reduced to a few critical alarms and the ability to check the liveness of the node.
OAM nodes can be used to handle both Erlang and non-Erlang components of your software. They act as a hub toward the wider operations and maintenance infrastructure of the organization where you deploy your software (Figure 16-1). This wider OAM infrastructure would also monitor and manage your network, switches, load balancers, firewalls, hardware, OS, and stack. It could include open source tools such as Graphite, Cacti, Nagios, Chef, or Capistrano; proprietary tools; or the use of SaaS providers such as Splunk, Loggly, or NewRelic. Connectivity could be one of many standards and protocols, including SNMP and standard management information bases (MIBs), YANG/NETCONF, REST, web sockets, or whatever the flavor of the month might be (as long as it is not CORBA).
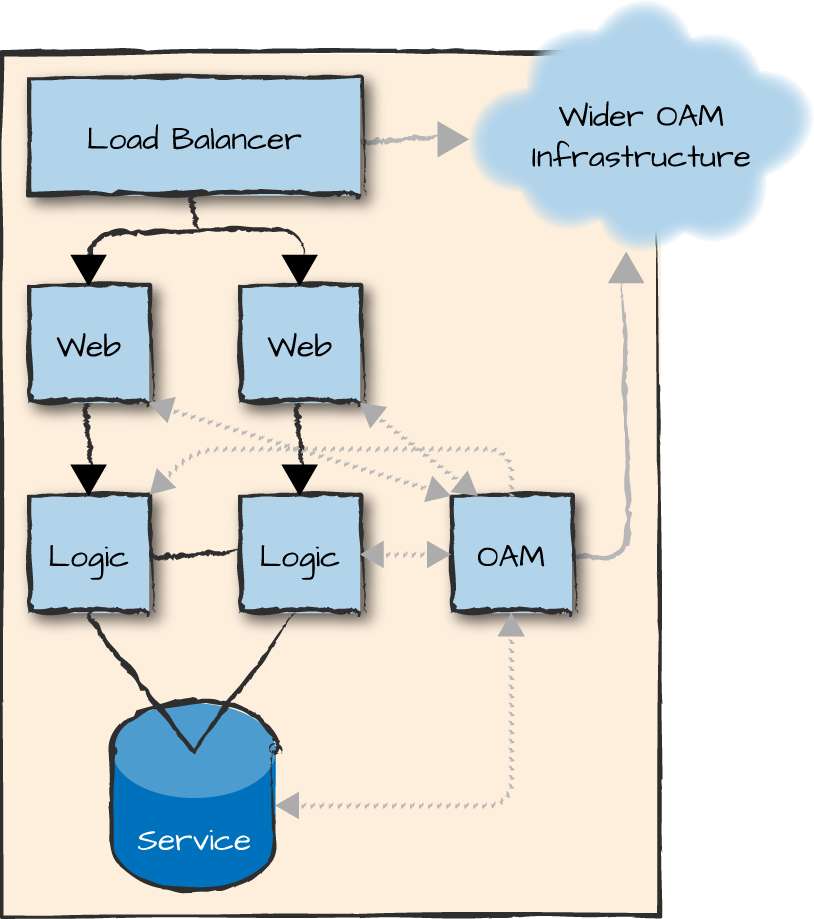
Figure 16-1. Operations and maintenance nodes
Logs
A log is an entry in a file or database that records an event that can be used as part of an audit trail. The entry could reflect a system event in the Erlang VM or operating system, or an event that triggers a state change in your business logic. Logs are used for a variety of purposes, including tracing, debugging, auditing, compliance monitoring, and billing. Different log entries are usually tagged, allowing you to decide the level of granularity of what is stored at runtime. Common tags include debug, info, notice, warning, and error.
The different ways logs are used by different people with varying technical skills and tool sets makes it hard to suggest a “one size fits all” approach. What is important, however, is to have logs that allow those using them to uniquely follow the flow of requests across nodes in order to locate issues or gather required data.
Picture our e-commerce example, where millions of requests run through the system daily. How do you handle a complaint from a customer who claims they never received their package, despite their credit card being charged? How do you narrow down your search and link the missing message to process crash reports or networking issues? You need to quickly find where in your code the request disappeared and admit guilt, or prove your innocence using a solid audit trail as evidence, thereby shifting the focus for finding the problem to your warehouse team or the courier.
Can you then use the same logs to create a customer profile based on the items purchased? Or look at the durations of user sessions to understand their shopping behavior? Understand how many users fill customers’ shopping carts but never check out? Or add up the total number of sales and, for revenue assurance purposes, compare it with the figures provided by the bank handling the credit card transactions? That is the level of granularity to aim for.
We saw the SASL logs that you get for free when using OTP in “The SASL Application”. If configured correctly, you get binary logs with supervisor, progress, error, and crash reports. You can also add your own handlers, forwarding crash and error logs to a central location. But saving the information is just the start to finding all the help it can provide when mined properly. Imagine a system with hundreds (or even thousands) of nodes, elastically scaling up and down. If you did not forward them to a central log repository, you would have to SSH onto a machine, connect to the Erlang shell, start the report browser, and search for crash reports, hoping they had not been rotated. If that were the case, how would you ever find out if something went wrong?
At one site we ran systems where processes were crashing daily. Since they were being automatically restarted, we were not aware of the issues, and the system was perceived as running normally, when in fact, a very small fraction of the requests were failing. Failure had been isolated so well, we had no idea our system was riddled with bugs. That’s not cool. If you want high availability, you need to automate the discovery of the SASL crash and error reports, and then ensure any faults get addressed. Although they may appear to be small in number, a user out there is experiencing each fault. And if many of these issues happen in quick succession, they could cause the supervisor to reach its maximum number of restarts, terminate, and escalate the issue, possibly taking the node down. Increasing the number of allowed restarts in your supervisor specification is not the solution. You need to solve the root problem that causes the crashes.
Users have often added their own log entries to the SASL logs, but this isn’t recommended because it mixes logs of different types and purposes in the same file. It might work for smaller systems with little traffic, but as soon as you have to handle tens of thousands of requests per second or more, where each request results in multiple log entries, you will quickly outgrow the capabilities of the SASL logs and will definitely want separate files (and possibly formats) for every log type.
Lager
Lager is one of the most popular open source logging frameworks for Erlang. It provides highly optimized logging capabilities in Erlang systems that integrate with traditional Unix logging tools like logrotate and syslog. Log levels such as debug, info, notice, warning, error, critical, alert, and emergency can be assigned different handlers, allowing you to decide how to manage the information provided. Default handlers format your logs for offline viewing, for terminal output, and for forwarding to SMS, pagers, and other service providers. Most of the OTP error messages are reformatted into more readable ones. Lager also has overload protection and throttling, allowing logs being sent to it to toggle between asynchronous and synchronous calls depending on the mailbox size. It also introduces the notion of a sink, allowing you to forward only the most critical log entries.
To understand what business-specific items you should be logging, trace the functional information flow of each request, identifying where the request will change the state of the system, and then log items that will get the user to select different branches. Think about what will give the maintainers, support engineers, DevOps team, accountants, auditors, marketing, and customer service representatives a good overview of what is happening or has happened. Every time a notable change in state occurs, log useful information that was not previously stored.
Ensure that you can, through unique identifiers, link together the various log entries, recreating the functional information flow. You cannot rely on timestamps alone, because the quantities of data will be huge. Nor can you rely on the session ID, user ID, or phone number, as they will not be unique across multiple requests. Assign a unique ID every time a unique request is received by an external client. As external requests might consist of several independent requests within your system or other external systems, unique identifiers might vary from one log to another. To link them together, you must ensure they are available in the function call where you invoke the log and store them together. While log entries can be added later, you must think through your logging strategy before you start coding, as the logs might be the only reason for using unique IDs in your business logic. You do not want to refactor all your code because you’ve realized that right before a call to an external API, you do not have the request ID generated elsewhere. You should also be prepared to change what you log based on feedback from maintainers, the DevOps team, and other log consumers.
Try to reduce repetition across logs. Store information only once and link it together with other logs using your identifiers. Using a single log to store everything might work during development, but when tens of thousands of sustained transactions take place per second, it will be hard to efficiently extract useful data out of the file and it could become a potential bottleneck. Ideally, your logs should create a relational model, where depending on the flow, a log entry in a file with a unique ID is linked to an entry in another file. This unique ID could be a session ID, which links items browsed by a user, items placed in and removed from a shopping cart, and items paid for on checkout. One log file could contain all the items browsed by a user, including the time spent viewing an item, another file items added to and deleted from the shopping cart, and a third log file items that were paid for. Items that were paid for on checkout might have another unique ID generated by the payment gateway, linking the session to one or more payments. All payment logs, in turn, would not have to store the session ID, as the link between the two would be made from the checkout log.
Another way to view the logs is as FSMs, where every entry is a state, and transitions to new states take place based on a set of conditional evaluations in your business logic. Replaying the state transitions in the FSM would allow DevOps engineers to retrace the steps taken by users adding items to their shopping baskets and paying for them.
Identify the different levels of logging, and especially what is useful only in debug mode, so as to not overload the system with useless logs. As a minimum requirement, always log the incoming and outgoing requests and results where appropriate so you are later able to identify the problematic system or component. As an example, if you are calling an external API, create a log entry with the request, the latency, and any unique request ID the external API has provided you. If the API request to your external service times out, just replace the result with a timeout tag. You can later analyze the log and see whether you need to increase the timeout values.
You will have to log system-specific items in your business-specific logs irrespective of what the node or system does. We have already discussed SASL logs, which you get as part of OTP. Always log all Erlang shell commands and interactions. You will be surprised to learn how many outages are caused by operations staff who are not used to working in the shell. Knowing what they have done can be just as important for proving that your code was working correctly as it is for restoring the service. How you log shell commands will depend on your target architecture. You could redirect your I/O, use bash commands, or add a hook to log the entries in the Erlang VM itself.
Other items to log could include network connectivity and memory
issues, which are notifications arising from the
system_monitor BIF described in “The System Monitor”. Be careful with the latter, as we have
caused nodes to crash after they ran out of disk space as a result of
logging millions of distributed Erlang port busy notifications in a
24-hour period. The same applies to badly written code that caused
memory spikes, triggering long gc and large heap messages. In these
cases, an incremental counter that bumped up every time such a message
was generated would be better than logging the messages themselves. You
can build in the ability to toggle the logging of the messages, so that
you can switch to retrieving details when you need to debug the
situation.
It is often also worth logging times when code is loaded or purged, node restarts, and the successful saving (and renaming) of crash dumps. Log whatever you believe will make your life easier and help you understand and correlate abnormal behavior or corrupt system state to a series of events.
If you store logs locally, use append-only files, and make sure your data is organized properly. It is common for log files to be stored offline, in databases, or with SaaS providers. Disk space is cheap. Logs could be stored as CSV files in plain text and fed into a variety of systems used for troubleshooting, billing, compliance, and revenue assurance. Logs could follow a standard such as syslog, or have a proprietary format. Make sure the data is accessible in a friendly format for those who need it. To slightly misuse Pat Helland’s wise words, “a database is a cache of your event logs,” if your database (or state) gets corrupted, the logs should tell you why. If it is not corrupt, they will tell you why not.
Metrics
Metrics are sets of numeric data collected at regular intervals and organized in chronological order. Metrics are retrieved from all levels of your application stack. You need to retrieve data on the OS and network layers, on the middleware layer (which includes the Erlang virtual machine and many of the libraries described in this book), and in your business layer. Metrics can be used in many parts of a business and are needed for many reasons, all similar to the reasons you need alarms and logs:
Developers use metrics to improve the performance and reliability of the system and troubleshoot issues after they have occurred.
DevOps engineers monitor the system to detect abnormal behavior and prevent failures.
Operations staff use metrics to predict trends and usage spikes, using the results to optimize hardware costs.
Marketing uses them to study long-term user trends and user experience.
To visualize metrics, imagine an incremental counter called login that is bumped up every time someone tries to log on to the system. If they are successful, login_success could be bumped up, or upon failure, login_failure incremented instead. We could take this further, and create counters for different failure types such as bad_password, unknown_user, user_suspended, and userdb_error. Such metrics could help identify attempts to hack into the system, help monitor fraud attempts, or maybe just prove a poor user experience. If you are getting hundreds of unknown user or bad password errors from the same source, you might want to ask those responsible for security to review the logs and determine what is going on. Marketing might want to determine how many users who fail to log on actually retry and eventually succeed. This would also be determined by examining the logs, but metrics would provide the first hint that something is wrong.
The operations team might want to make sure the system load doesn’t exceed available resources, requesting metrics on the memory usage of the Erlang VM. You can poll not only the total memory usage, but also how much memory is used by processes, the system, the atom table, ETS tables, binaries, and to store the code. You could even take it a step further and differentiate between the space allocated to store process and atom memory versus the memory actually used.
As a developer, you might not think much about these issues as you rush to deliver the system, but once you have gone live and someone who does not speak Erlang has to figure out why it is running low on memory, imagine the power of being able to correlate spikes in process memory usage or large portions of time spent on garbage collecting data with particular user operations such as logging in.
Figure 16-2 plots the different types of memory usage in the Erlang VM, alongside total memory consumption. We can clearly see that the 50% increase in memory is due to an increase in the used process memory, which probably correlates either to increased system usage or to a buildup of processes that aren’t being properly terminated.
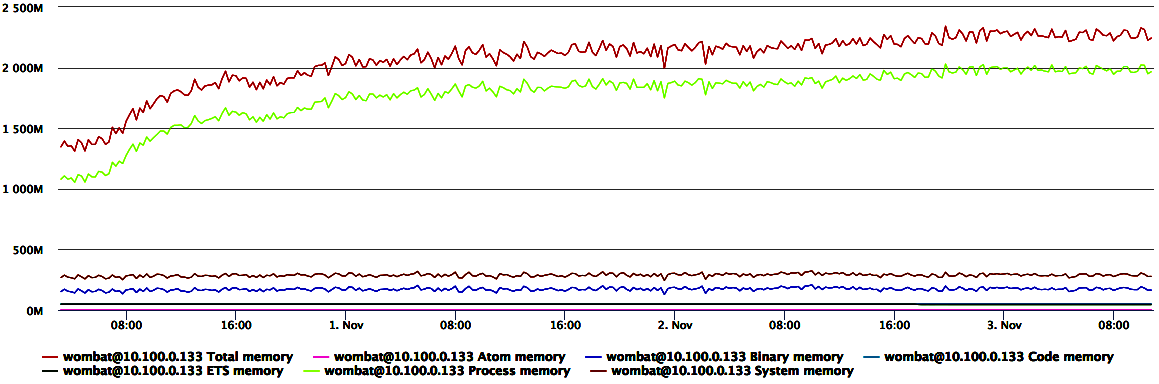
Figure 16-2. Memory usage
Metrics collected take on different values and formats depending on their purpose. One typical value is an amount, a discrete or continuous value with incremental and decremental capabilities. A common form of amount is counters, as we have seen.
Gauges are a form of counter that provide a value at a particular point in time. Although the number of login attempts since we started the system might not help someone in operations, the number of ongoing sessions will. Other typical examples of gauges are to measure memory or hard disk usage.
Time is another common measurement, mainly used to measure latency in all levels of the stack. Data collectors tend to group time readings into histograms, collections of values (not necessarily only time-related) that have had some form of statistical analysis applied to them. Histograms may show averages, minimum and maximum values, or percentiles. As examples, what was the latency of the fastest 1% of the requests? And the slowest 1%?
The third type of metric is a value in a particular unit of time. These are commonly called meters, which provide an increment-only counter whose values are evened out with mean rates and exponentially weighted moving averages. The adjustments ensure you do not see spikes and troughs that might occur.
A spiral is a form of meter with a sliding window count, showing the increment of a counter in a particular time frame. If you are showing a value relative to the last minute, the sliding count could drop readings older than 1 minute and replace them with new ones, each second. Values you could show include the bit rate per second and operations per second, such as the number of initiated sessions.
Metrics have a timestamp associated with them. They are retrieved and stored in a time series database at regular intervals. A time series database is optimized to handle data indexed by timestamps, allowing you to access data in chronological order. Metrics are often aggregated and consolidated over time to provide overviews on a system level. You might want to collect all counters from a particular node type or see the total number of requests for all nodes in the last 15 minutes, hour, day, or month.
Look at the counter in Figure 16-3, which shows the total length of all the process message queues over a 12-hour period. It was plotted based on data collected when investigating a node crash that occurred at 3:34 AM. The node crashed after running out of memory. The metrics not only allowed us to identify what caused the crash, but provided an operational insight: had someone been monitoring the process message queue length, there was a 3-hour window where the issue could have been noticed and addressed.
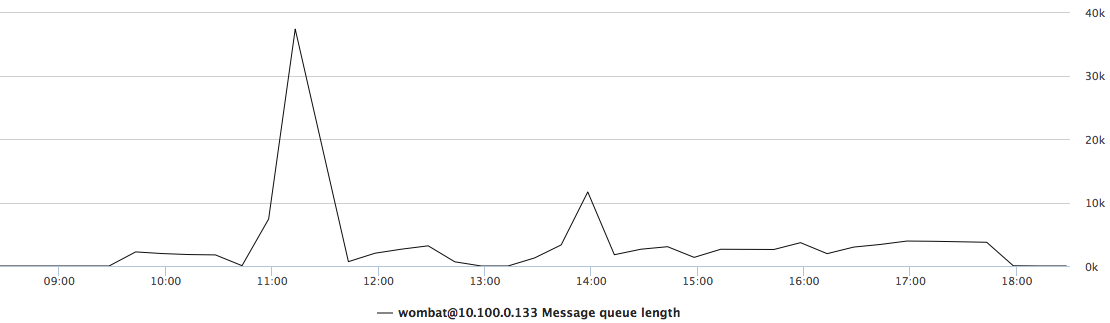
Figure 16-3. Message queue length
In Erlang, ETS tables have the atomic operation
ets:update_counter that allows you to increment and decrement counters. They can
be used for speed, but beware of global locks and bottlenecks when
scaling on multicore architectures. Recommended open source applications
that focus on metrics include folsom
and exometer. They offer some of the basic system metrics you expect out of
your Erlang VM, and let you create your own metrics on a per
node-basis.
Exometer
Exometer consists of a group of applications providing a package to gather and export metrics in individual nodes. It provides predefined data points and metric types that can be sampled, as well as APIs and callback functions to add user-defined metric types. When a state needs to persist between sampling, it is possible to implement probes that run in their own process space, storing state and using it to gather the metrics. Metrics and data points can be exported to third-party tools and APIs, including Graphite, OpenTSDB (via Telnet), AMQP, StatsD, and SNMP. You can also choose to develop and add your own custom reporters. Exometer operates with very low impact on memory, CPU, and network usage so as to minimize its effects on resources required by the applications it’s measuring and monitoring.
Alarms
Alarms are a subset of events associated with a state. While an event will tell you that something happened, an alarm will indicate that something is ongoing. For instance, an event tells you that a socket was closed abnormally, but an alarm warns of your inability to create any socket connections toward an external database.
An alarm is raised when the issue you are monitoring manifests itself. This could represent, for instance, losing the last socket connection toward the database or failing to create a connection at startup. The alarm is said to remain active until the issue is resolved—maybe on its own accord, or through automatic or manual intervention—and the state reverts back to normal. This could happen when connectivity toward the database is restored. When this happens, the alarm is said to be cleared.
Alarms can also be associated with a severity. Severities include cleared, indeterminate, critical, major, minor, and warning. Each alarm severity is configured individually in the OAM node on a system-by-system basis, allowing the DevOps teams (and automated scripts) to react differently to them. For example:
An alarm about a disk that’s 80% full might be associated with a minor severity. You can get notified about it during office hours and deal with it after the coffee break.
However, if the disk continues filling up and becomes 90% full, the severity might rise to major. You can get called about that during office hours, out of office hours, and on weekends, but not between 11 PM and 7 AM.
If the disk becomes 95% full, the severity might then go to critical; regardless of when this occurs, a pager call alerts someone, perhaps getting them out of bed, to investigate and address the cause before the node runs out of space and crashes.
In other systems, however, where nodes can crash without affecting availability and reliability, a node that crashed because its disk is full could be handled when convenient during office hours, assuming there is enough redundancy to guarantee the system can still handle the load. There is no one size fits all solution; each system is unique and must be managed differently.
Alarms can originate from the affected node or in the OAM node itself. They can be based on thresholds or state changes, or a mixture of the two.
In threshold-based alarms, metrics are monitored and the alarm is raised if a limit is exceeded in one of the metrics. Depending on the exceeded value, such as a disk full alarm, you could configure and apply different severities based on the requirements of your system. Other examples of threshold-based metrics include system limits such as memory, number of sockets, ports, open files, or ETS tables. If you are monitoring the number of requests that went through your system using an incremental counter, and this counter has not changed in the last minute, there is probably an issue and you will want to have someone investigate.
Most threshold-based alarms can be managed in the OAM node, but there are exceptions created by the frequency at which you transfer the data and the volumes you are willing to move. As an example, processes with very long message queues are usually a symptom of issues about to happen. They are easy to monitor, but the monitoring and raising of alarms has to happen on the managed nodes, as it is not feasible to send the message queue lengths of all processes to the OAM node. There will also be times where you want to detect these issues and raise an alarm immediately, without having to wait for the OAM node to receive the metrics and raise a threshold-based alarm.
State-based alarms are triggered when a potentially harmful state change occurs. They include alarms highlighting hardware issues such as a cabinet door being opened or a cooling fan failing. Other examples include the connectivity toward an external API or database being unresponsive or a node going down.
It’s up to you to decide how many alarms to send and the levels of detail to include in these alarms. You might want to do sanity checks in your system. What happens if a .beam, .boot, .app, or sys.config file gets corrupted? You will not notice until the node is restarted. Although a node can take a few seconds to restart, marginally affecting your uptime, identifying the corrupt file is enough to kiss your five nines goodbye. Isolating the corrupt file and fixing it is not easy and will take time, drastically increasing your downtime. If you think it will not happen to you, think again, because it has happened to many others, us included!
SASL has a basic alarm handler, which we cover in “The SASL Alarm Handler”. It allows you to raise and clear alarms, but does not handle severities and dependencies. The idea behind the SASL alarm handler is to manage alarms on the affected nodes. These can be forwarded to more complex alarm applications in your OAM node or external tools. But if you do write your own OAM node, you will need something more complex and configurable, handling alarm duplication, severities, and operator interaction.
Elarm
The elarm application is the de facto Erlang-based alarm manager used in production systems to manage alarms. It allows you to configure severities and actions, as well as implement handlers that forward requests via email or SMS, or to external systems such as Nagios or pager duty. Users (or the system) can acknowledge and clear alarms as well as add notes for other members of the DevOps team. You can configure alarms to provide users with default information such as severity, probable cause, and repair actions. All alarm events are logged, and the current state of alarms can be queried and filtered. While the SASL alarm handler is ideal for basic alarm handling, elarm is what you should be running in your OAM nodes, making it the focal point where all of the alarms are collected, aggregated, and consolidated. This information is then used to make decisions on actions and escalation, be it automated or manual.
No two systems are alike. Based on their functionality, traffic load, and user behavioral patterns, they will need to be managed and configured differently. A critical alarm in one system might be a nonissue or a warning in another. Once you’ve gone live, you will need to configure and fine-tune your alarms. This is commonly done when you handle false positives and false negatives. A false positive is an alarm generated because of a nonissue. It could be caused by an overly sensitive threshold or even paranoid management asking you to monitor too much. In cases where disks fill up slowly, a 70% disk full alarm could be active for months without any need for intervention. But in systems where disks fill up quickly, such an alarm might warrant waking someone up in the middle of the night, as it might be a warning that the node is going to crash within the hour. It is important to fine-tune your system and eliminate false positives, as too many of them will result in serious alarms being ignored.
It is also important to do the opposite: namely, manage false negatives. A false negative is when alarms should have been raised, but are not. This could be because of threshold configuration or lack of coverage in particular parts of the system. After every failure or degradation of service, review which alarms could have been raised (if any) and start monitoring events that might indicate that failure or service degradation is imminent.
We see alarms in systems too rarely, and when they do exist, they have often been added as an afterthought. The majority are threshold-based, with the only state-based alarms being based on external probes sending requests to the system. Alarms play a critical role in detecting and addressing anomalies before they escalate and have been a must in the telecoms space for decades. It is time for other verticals to adopt these practices widely and apply the lessons learned about them. It will greatly facilitate support automation (covered in the following section) and be one of the pillars you can count on when trying to achieve five-nines availability.
Preemptive Support
Support automation is the building of a knowledge base that is used to reduce service disruption by reacting to external stimuli and resolving problems before they escalate. If you are allowed only minutes of downtime per year, downtime is something you need to plan for when designing your system. It is no good detecting something has gone wrong and expecting a human to intervene and manually run a script. Being allowed a few minutes of downtime per year means running that script through automation. Automation is achieved through the collection and analysis of metrics, events, alarms, and configuration data. If certain patterns are detected in the metrics and sequence of events, a set of predefined actions are taken, preemptively trying to resolve the problem before it occurs. It could be something as simple as deleting files, configuring a load balancer, or deploying a new node to increase throughput while decreasing latency.
You need to keep three main areas of support automation in mind when designing your Erlang system:
Proactive support automation is focused on reducing downtime using end-to-end health checks and diagnostic procedures. It could be implemented through an external system that sends requests to test availability, latency, and functionality.
Preemptive support automation gathers data in the form of metrics, events, alarms, and logs for a particular application; analyzes the data; and uses the results to predict service disruptions before they occur. An example is noticing an increase in memory usage, which predicts that the system might run out of memory in the near future unless appropriate corrective actions are taken. These actions could include enabling load regulation and backpressure, request throttling, starting or stopping nodes, and migration of services using capability-based deployment.
Self-support automation describes the tools and libraries that can be used to troubleshoot solutions and to diagnose and resolve problems. They are invoked as the result of proactive and preemptive support automation.
An example of proactive support automation is external probes that simulate users sending HTTP requests, monitoring the well-being of the system by sending requests to different parts of it. In our e-commerce example, probes could include tests to ensure that the product database is returning search results, that users can log on and start a session, and that checkout and payment procedures are successful. There is, after all, no point in having a shop where customers can browse the items, but not buy them!
You want to know about issues with your system long before your customers find out, and already be working on a resolution before the moaning on social media starts. Make sure that the probes run outside of your network. We’ve been caught out as a result of a defective switch, where probes within the firewalls were not detecting anomalies but customers outside the perimeter network were not able to access the system.
In the case of preemptive support, if you know what needs to be done when an alarm is raised or the thresholds of certain metrics are met, you should automate actions. In the disk full example we gave in “Alarms”, upon receiving the 80% disk space alarm, you could start compressing logs. If compressing logs doesn’t help and the alarm severity is raised with a 90% disk full alarm, you could change the wraparound time of your logs and shut down those that will not affect service. If you are unfortunate enough to get a 100% disk full alarm, start deleting anything not required and not critical to the correct functioning of the system.
Other examples of automated preemptive support include deploying of new nodes when existing system capacity is not enough, reconfiguring load balancers, and changing thresholds used to trigger load regulation and backpressure. As an example, clients using lager send log entries asynchronously for speed, but as soon as the lager mailbox hits a certain size, the asynchronous calls are replaced by synchronous ones in an attempt to slow down the producers and allow lager to catch up.
Preemptive support does not have to be completely automated. Do not underestimate the value of having your DevOps team analyze logs, alarms, and metrics, especially under peak or extended heavy load, to predict and avoid outages that you might not have thought of.
Summing Up
Monitoring systems is never dull. If you want five-nines availability, do not take anything for granted; monitor everything, and spend the time necessary to regularly review alarms, logs, and metrics. The reviews should be both manual and automated. You never know what you or one of your tools is going to find. The only thing you can be sure of is that these issues will manifest themselves, and will do so when you least expect it.
Just because you’ve isolated failure on a function, process, application, and node level does not mean allowing processes to crash is acceptable. The “let it crash” approach gives you the programming model you need to reduce crashes through simplicity. Make sure you are aware failure is occurring, and fix the issues as soon as you detect them. You need to be aware something is about to happen with enough margin to allow you to react to it before your users notice.
And finally, don’t waste time looking for needles in a haystack. Have all the data at hand so that you can prove your innocence (or admit guilt) when anomalies do manifest themselves.
That’s it! Who ever said designing systems that are scalable and highly available was hard? All you need to do is follow our 10 easy steps:
Split up your system’s functionality into manageable, standalone nodes.
Choose a distributed architectural pattern.
Choose the network protocols your nodes, node families, and clusters will use when communicating with each other.
Define your node interfaces, state, and data model.
For every interface function in your nodes, pick a retry strategy.
For all your data and state, pick your sharing strategy across node families, clusters, and types, taking into consideration the needs of your retry strategy.
Design your system blueprint, looking at node ratios for scaling up and down.
Identify where to apply backpressure and load regulation.
Define your OAM approach, defining system and business alarms, logs, and metrics.
Identify where to apply support automation.
And finally, when all of these pieces are in place and running, keep on revisiting your tradeoffs and assumptions as your requirements evolve. Add more resilience and visibility as and when you need it. Identify the reason for every outage and put in place the early warning signals in your monitoring system, along with resilience in your software and infrastructure, to ensure it never happens again.
For further reading, we suggest you look at the documentation that comes with lager, elarm, exometer, and folsom. You can find it in their respective repositories on GitHub. Stuff Goes Bad, Erlang in Anger is an ebook by Fred Hébert we warmly recommend. The Erlang/OTP system documentation also has a user’s guide on OAM principles, mainly focusing on SNMP. It should be read alongside the documentation for the operations and maintenance applications os_mon, otp_mibs, and snmp.
What’s Next?
This is the last chapter we are planning on writing—at least for a while. You will be the one writing the next chapter when applying the knowledge from this book in designing your scalable and highly available systems using Erlang/OTP and its programming model. In doing so, keep in mind the words spoken by Håkan Millroth at one of the very first Erlang User Conferences: to run a successful project, you need good tools, good people, and a little bit of cleverness. You’ve discovered the good tools, and you have the cleverness, and hopefully good people. We are now looking forward to hearing all about your success stories! Thank you for reading so far, and good luck!