
Debugging and Tuning
Developer Console is the first place to look to troubleshoot unexpected behavior from a Visualforce user interface. While Developer Console is open, every interaction with Force.com is logged and can be examined in depth. In Figure 6.11, Developer Console is active and contains six entries, shown in the bottommost table.
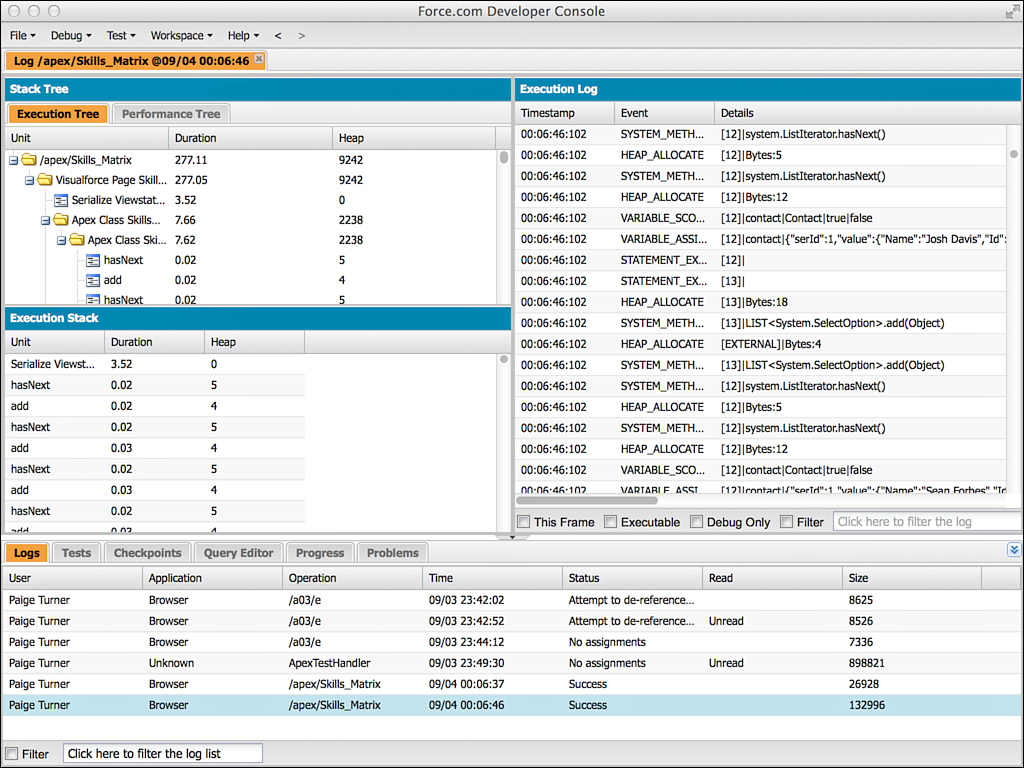
The last log entry has been clicked, and the other panels of Developer Console are refreshed with detailed information. This information is centered around the Apex code executed in the controller associated with the page, as well as any Apex code executed as a result of controller code. If a bug exists in your controller code, it should be obvious in the Execution Tree, Execution Log, and Stack Tree panels as you trace the flow of instructions.
The next place to look for bugs is the Visualforce page markup. If Force.com encounters something invalid in the course of rendering a Visualforce page, such as a null reference in your controller, it can interrupt the processing of your page entirely and display an error message. Trial and error can be helpful in these situations. Comment out portions of your Visualforce page using HTML comment tags (<!-- sample comment -->) until the page functions again and you’ve isolated the troublesome portion. An in-browser development tool such as Firebug or Chrome Developer Tools is also helpful if the page renders successfully but has a client-side presentation or logic issue. These tools enable close inspection of the JavaScript, HTML, and CSS in the page.
When you’re ready to improve the performance of your Visualforce page, examine the view state. The view state contains the values of local variables in your controller. They are encoded and embedded in the page itself in a hidden field and sent back to Force.com upon every user action. Sending the view state back and forth to the browser and processing it in Force.com can reduce the responsiveness of your user interface. View state is limited to 128K, but performance can be impacted well before the limit is reached.
The Visualforce development mode footer contains a tab called View State, shown in Figure 6.12. With it, you can examine the contents of the view state: the variables saved there, along with their sizes and contents. Double-clicking one of the folders opens a dialog with charts showing the contribution of various types of view state toward the limit.
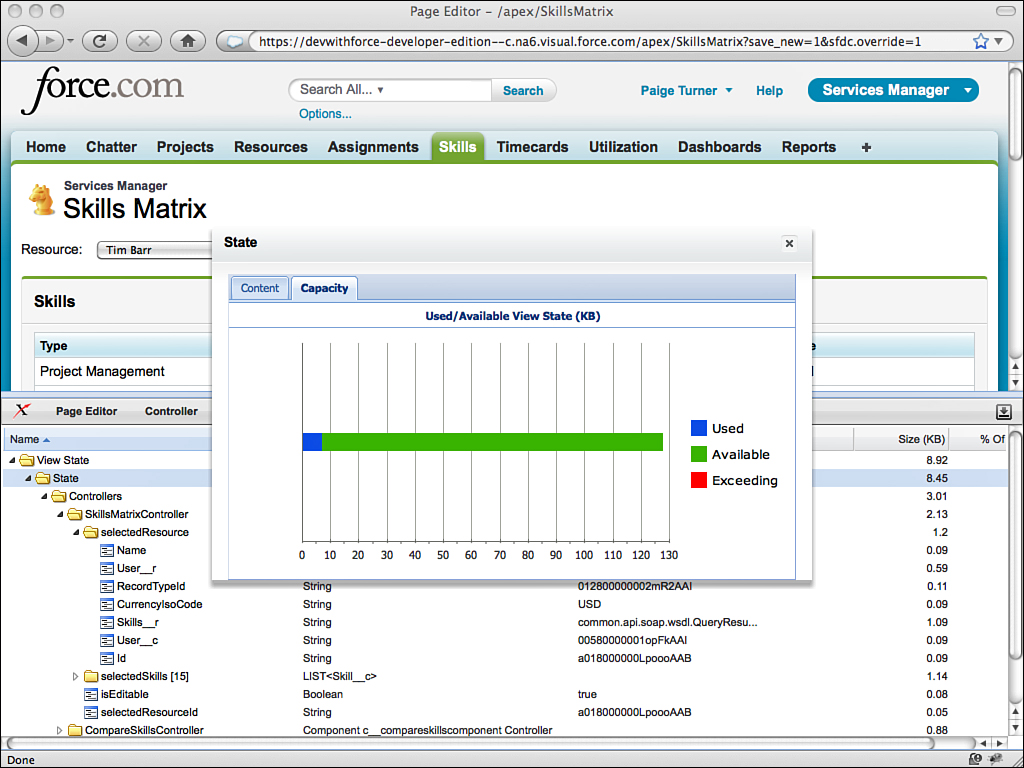
Your goal is to minimize the view state. Look for controller variables that do not need to persist across page views, and add the transient keyword to them. The transient keyword tells Force.com not to save the state of the variable in the Web page, removing the round-trip cost of transporting that data to and from the Web browser. Avoid querying extraneous information from the database in your SOQL calls. Also, simplify and streamline any nested data structures that are required in the view state.
Performance tuning Visualforce pages is a complex subject beyond the scope of this book. An excellent resource is a best-practices document from Salesforce itself, available at http://www.salesforce.com/docs/en/cce/salesforce_visualforce_best_practices/salesforce_visualforce_best_practices.pdf. Learning these best practices early in the development process can prevent costly rework. Additionally, test all of your Visualforce pages with realistic data volumes. This helps to expose performance issues prior to a production deployment.