Working with Time Dimensions
There’s practically no such thing as an OLAP database without a Time dimension. Often, a Time dimension contains months as the lowest level of detail—aggregated into quarters and years. Sometimes, a Time dimension will contain days as the lowest level of detail. On occasion, particularly if you’re monitoring a manufacturing operation, you might create a dimension with minutes or even seconds as the lowest level of detail. Whatever the level of detail, a Time dimension has certain unique qualities.
For example, time typically occurs in regular intervals. Each hour contains 60 minutes, each day contains 24 hours, each quarter contains 3 months, and each year contains 4 quarters. This repetitive nature of time encourages certain questions, such as “How does this month compare to the same month of last year?” The multidimensional expressions (MDX) language, which you’ll learn about in Part 2, “Multidimensional Expressions,” has functions that make it easy to answer this type of question. By flagging certain dimensions as Time dimensions, and certain levels within a dimension as specific units of time, you can make those functions easy to use.
Of course, time isn’t completely uniform because the 365 days in a year aren’t evenly divisible by the 7 days in a week or the 12 months in a year. Some months have 30 days; some have 31, or 28, or occasionally 29. Months begin on different days of the week. Irregularities are a fact of life in Time dimensions, and when working with time, you need to be prepared for both the regularities and the irregularities.
Create a Calendar Date Hierarchy
One irregularity that frequently arises when dealing with time is that many organizations use a fiscal year—where the starting day of the year isn’t January 1. Sometimes, a company uses a fiscal year for internal purposes but must still use a calendar year when communicating with certain customers. The same lowest level date—for example, March 1, 1998—could be the first month of a fiscal year and the third month of the calendar year. To choose which way to display that lowest level date, you must use two different hierarchies. Analysis Services allows you to do that when you create the dimension. Since you can’t rename an existing shared dimension, you must plan for multiple hierarchies before creating the dimension.
As you saw in Chapter 2, the Dimension Wizard can construct an entire hierarchy from a single Date/Time column. In this chapter, you’ll re-create the Time dimension, again using the Dimension Wizard to create the hierarchy of levels. This time, however, you’ll create a calendar hierarchy within the Time dimension. You’ll also see how the Dimension Wizard uses expressions in the Member Name Column and Member Key Column properties to create a hierarchy from a single date value.
|
Shared dimensions and virtual cubes are discussed in “Creating Virtual Cubes” in Chapter 4, “Advanced Dimensions and Cubes.” |
1. | |
2. | When asked how you want to create the dimension, click the single table option and click Next. Select TimeMonth as the dimension table, and click Next. Click the Time Dimension option, and click Next. Select Year, Quarter, Month for the time levels, and click Next. Click Next to skip the Advanced Options screen. |
3. | |
4. |
When you create an explicit hierarchy in a dimension, Analysis Services creates a compound name, with the dimension name followed by a period, which is followed by the hierarchy name. A dimension with an explicit hierarchy is simply an ordinary dimension. Technically, all dimensions have at least one hierarchy. If you create a dimension name without a period, the dimension has one unnamed hierarchy. The only effect of creating multiple hierarchies for a dimension is that Analysis Services makes it possible for a client application to indicate that the hierarchies are somehow related.
|
You can’t include more than one period in a dimension name. |
Set Time Dimension Properties
For the time being, the Time dimension contains only a single hierarchy. Before creating a second hierarchy for the dimension, look at some of the special time-related properties that the Dimension Wizard sets for you.
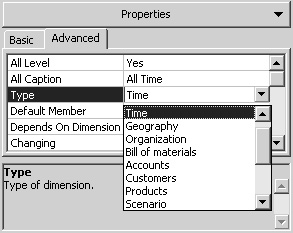
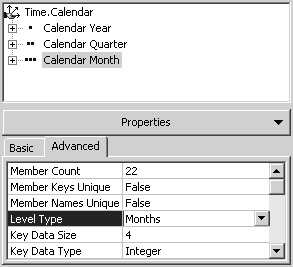
1. | In the Dimension Editor, select the Time.Calendar dimension in the dimension tree and click the Advanced tab in the Properties pane. The value of the Type property is Time. The Type property has many possible values, but the only ones automatically set by the wizards are Time and Standard.
Note A dimension’s Type property has no direct effect on Analysis server. The Type property is available for a client application to inspect—and certain MDX functions, as explained in Part 2, do behave differently based on the Type property of a dimension—but the server does not. You could change the Type property of the Time. Calendar dimension to Standard or that of the Product dimension to Time, and it would make no difference to the server. |
2. | Change the name of the Year level to Calendar Year, the name of the Quarter level to Calendar Quarter, and the name of the Month level to Calendar Month. After renaming the levels, switch to the Advanced tab and notice the value of the Level Type property as you select the levels in turn. The Dimension Wizard sets the value of each Level Type to match the type of time data stored in the level.
Note As with the Type property of the dimension, the Level Type property has no effect on the server; it’s available only as information to a client application and to certain MDX functions. You can assign one of the time-related values to the Level Type, even if the dimension is not flagged as a Time dimension. Likewise, you can change the Level Type for a level to Regular, even if it is within a Time dimension. |
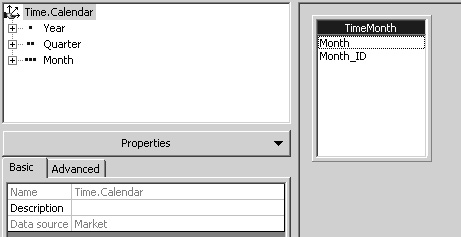
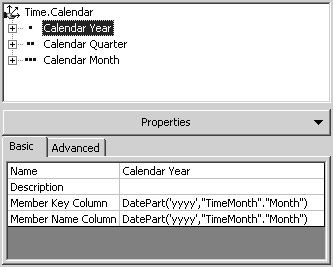
3. | Select the Calendar Year level, and click the Basic tab of the Properties pane. Compare the values of the Member Key Column and the Member Name Column properties.
|
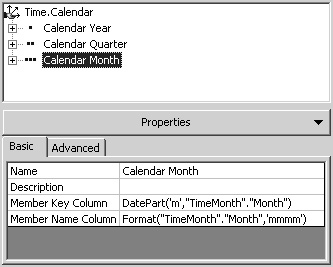
4. | Select the Calendar Month level, and compare the values of the Member Key Column and the Member Name Column properties.
|
5. | You can easily modify the member name expression to display the three-character abbreviation for a month. Change the formatting string portion of the Member Name Column property from ’mmmm’ to ’mmm’. Press Enter, and browse the dimension to see the shortened names. |
6. | Select the Calendar Quarter level, and look at the expression for the Member Name Column. It is, ’Quarter ’ + Format$(DatePart(’q’,“TimeMonth”.“Month”)). Suppose that you want the quarter label to display only Qtr as a prefix instead of Quarter. |
7. | |
8. | Click the Save button to save the Time.Calendar dimension. |
The Type property of a dimension and the Level Type property of a level are significant only when dealing with a Time dimension. Even in a Time dimension, however, these properties are not critical. When the Dimension Wizard constructs a hierarchy from a Date/Time column, it creates expressions for the member name and the member key of each level. You can modify those expressions or even add new levels of your own, inventing appropriate expressions for the levels.
Create a Fiscal Date Hierarchy
Many organizations use fiscal dates in addition to calendar dates. The Dimension Wizard can create a fiscal date hierarchy from a Date/Time column, but you might need to adjust some of the properties to get the dimension to work properly, particularly if the dimension is created as the second hierarchy of a single parent dimension.
1. | In the Dimension Editor, click the File menu, point to New Dimension, and click Wizard. | |
2. | ||
3. | Select Year, Quarter, Month for the time levels, but select March as the starting month for the year. Then click Next twice. 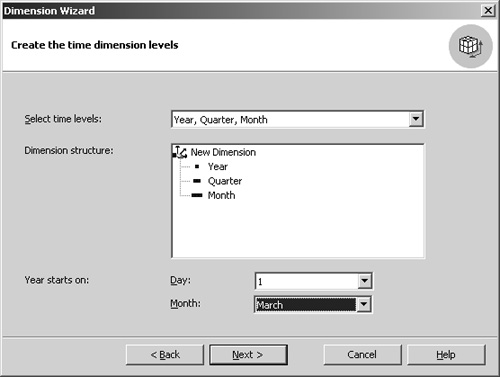
| |
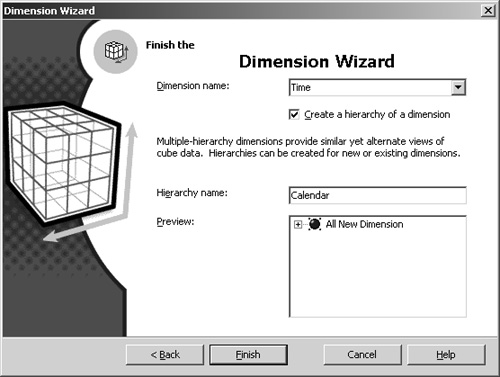
4. | On the finish screen, type Time as the name of the dimension, select the check box for an explicit hierarchy, type Fiscal as the name of the hierarchy, and click Finish. This creates a second hierarchy for the Time dimension. Whenever the Dimension Wizard constructs a time dimension from a Date/Time column, it always sets the Type property of the dimension to Time. Both the Time.Calendar dimension and the Time.Fiscal dimension have Time as the value of the Type property. The purpose of the Type property, however, is merely to allow certain MDX functions to identify the default Time dimension. If you have two Time dimensions, only one of them can be the default. When you add dimensions to a cube, you add them in a particular order. The default Time dimension for an MDX function is the first dimension in the cube that has Time as the value of its Type property. One way to explicitly determine the default Time dimension is to explicitly determine the order of dimensions in a cube, as explained in “Add a shared dimension by using the Cube Editor” later in this chapter. Another, perhaps more straightforward, approach is to change the Type of one of the dimensions to Standard. Suppose you want Time.Calendar to be the default Time dimension. You would need to change the Type of the Time.Fiscal dimension. | |
5. | In the dimension tree, select the Time.Fiscal dimension. On the Advanced properties tab, change the Type property to Standard.
| |
6. | Change the names of the levels—from Year to Fiscal Year, from Quarter to Fiscal Quarter, and from Month to Fiscal Month. Note The expression generated for the Member Key Column of the Fiscal Year level is DatePart(’yyyy’,iif (Month(“TimeMonth”.“Month”) < 3 or (Month(“TimeMonth”.“Month”) = 3 and Day(“TimeMonth”.“Month”) < 1), “TimeMonth”.“Month”,DateAdd(’yyyy’, 1, “TimeMonth”.“Month”))). The Quarter level has similar expressions. While you can simply be grateful that the wizard created the expression so that you don’t have to, this expression is also much more complicated than it needs to be. A fiscal date is simply a calendar date that has been shifted by a certain number of months (and, possibly, days). You could equally well convert to a fiscal year beginning in March with the formula DatePart(’yyyy’,DateAdd(’m’, -2, “TimeMonth”.“Month”)). | |
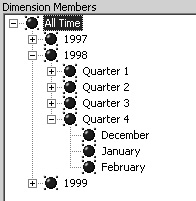
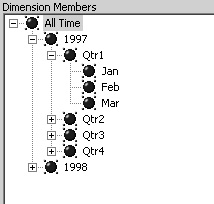
7. | In the Data pane, expand All Time, 1998, and Quarter 4. The months of the quarter appear, with December correctly preceding January.
| |
8. | In the dimension tree, select the Fiscal Month level and look at the Member Key Column property. Note The expression generated by the wizard is (DatePart(’yyyy’,“TimeMonth”.“Month”) * 100) + DatePart(’m’,“TimeMonth”.“Month”). There’s no adjustment for the fiscal time shift, but the year is included with the month and December of 1997 will always precede January of 1998, regardless of the fiscal year. The same effect would be achieved by simply using the Date/Time column “TimeMonth”.“Month” as the member key. | |
9. | Click the Save button to save the Time.Fiscal dimension, and close the Dimension Editor to return to Analysis Manager’s console view. |