
CHAPTER 11
Elements of Acoustics
In this chapter, you will learn about
• How sound is produced
• Acoustics-related intensity and pressure
• Sound reflection, reverberation, diffusion, absorption, and transmission
• Measuring background noise and specifying maximum allowable background noise levels for a given environment and application
The first question designers consider when planning a sound system is whether such a system is even required. If a space is small, the acoustics are good, and the background noise level is low enough, there may not be a need for any system that seeks to amplify sound.
If, however, an audience can’t adequately hear a presentation, performance, videoconference call, and so on, then using microphones, audio mixers, signal processors, power amplifiers, and loudspeakers to amplify a sound source electronically will probably be necessary. This way, the sound can also be distributed to a larger or more distant audience.
The second question is how much privacy a space requires, both from sound originating outside the space and from sound leaking out. Depending on the answers, infrastructure decisions will play a pivotal role in sound system design.
This chapter assumes knowledge of sound reinforcement needs assessment and specifications, which were discussed in detail in Part II, “Environment,” of this guide. This chapter does not provide the level of knowledge required of an acoustician or sound engineer but will help you to make informed infrastructure decisions and design for a comfortable listening experience.
Acoustic Engineering
Acoustic engineering is an important allied trade to the AV industry. Acoustics is the science and technology of sound in all its aspects. When acousticians look at a room, they consider the following properties of sound:
• Production How the energy is generated; in other words, the source of the sound
• Propagation The pathway of the energy
• Control How (sound) energy is generated and subsequently propagated
• Interaction How material responds to the sound energy imposed upon it
• Reception How hearers’ ears and brains will respond to the stimuli placed upon them
Ideally, any application where audio quality is crucial will require an acoustical consultant’s expertise during the programming phase. As an AV professional, you should be aware of your design environment’s acoustic properties and be prepared to make recommendations regarding acoustic criteria.

NOTE This chapter will cover each of the listed sound properties, but you’ll find control-related information in discussions of sound transmission class (STC) and impact insulation class (IIC).
Sound Production
When you think about where sound comes from, it’s probably easiest to envision vibrating objects, such as a moving loudspeaker cone or a vibrating string, producing waves in the air. However, sound is produced by any disturbance that creates changes in pressure or velocity in an elastic medium such as air. For example, air escaping from an air-conditioning outlet comes out of a vent that’s much smaller than the duct. This increases the velocity of the air, resulting in a whoosh of air. The change in velocity and pressure, rather than mechanical vibration, produces the sound.
Not only is mechanical vibration not required to produce sound, you don’t even really need air. Sound waves do need a physical medium in which to propagate, but that medium can be water, other liquids, or solids. The fact that sound can be carried by so many different media is part of what makes acoustics such a complex field.
In his book Music, Physics, and Engineering (Dover Publications, 1967), Harry F. Olson wrote, “Sound is an alteration in pressure, particle displacement, or particle velocity which is propagated in an elastic medium, or the superposition of such propagated alterations. … Sound is produced when the air or other medium is set into motion by any means whatsoever. Sound may be produced by a vibrating body, for example, the sounding board of a piano, the body of a violin, or the diaphragm of a loudspeaker. Sound may be produced by the intermittent throttling of an air stream as, for example, the siren, the human voice, the trumpet or other lip-reed instruments, and the clarinet and other reed instruments. Sound may also be produced by the explosion of an inflammable-gas mixture or by the sudden release of a compressed gas from bursting tanks or balloons.”
From these lines we learn that any disturbance that creates changes in air pressure or air-particle velocity will be processed by our ear/brain system as sound.
Sound Propagation
Sound waves have physical length, or wavelength. Wavelength is the distance between two corresponding points of two consecutive cycles. Knowing how a sound wave of a certain size interacts when it comes into contact with surfaces of different sizes and materials helps us to understand sound wave behavior.
You may be wondering about the effect altitude plays in relation to the speed of sound. It turns out that temperature has a much more pronounced effect on the speed of sound than atmospheric pressure.
The speed of sound depends on the temperature and molecular weight of atmospheric gas. It does not depend on pressure changes. The pressure decreases with an increase in altitude and therefore only slightly affects the speed of sound. The speed of sound in air is 1,130 ft (344 m) per second.
You can obtain the wavelength value if you divide the speed of sound by frequency, as shown in the following formula:
λ = v / f
where:
• λ is the wavelength measured in feet or meters.
• v is the speed of sound in feet (meters) per second.
• f is the frequency in hertz.
If the speed of sound in air is 1,130 feet per second, the wavelengths covering the entire audible spectrum, from 20 Hz to 20 kHz, range from 56.5 ft (17.2 m) long to less than 3/4 in (19 mm) long in air (in other words, 1130 / 20 = 56.5 and 1130 / 20000 = 0.0565). Considering such a vast range of wavelengths, it’s important that you have a solid understanding of how waves of certain physical dimensions behave in a given space.
Although the sounds you hear every day are complex waveforms, each can be broken down into individual sine waves of all the frequencies that make up each particular sound. In Figure 11-1, a USB oscilloscope shows the complex waveforms from the left and right tracks of a music CD.

Figure 11-1 Complex waveforms
Frequency and wavelength are inversely proportional. This means that as one gets larger, the other gets smaller. The lowest frequencies have the longest wavelengths, and the highest frequencies have the shortest wavelengths.
We’ll now discuss sound characteristics as they pertain to propagation, including intensity, pressure, and particle displacement.
Sound Intensity
When you talk about how “loud” a sound is, you are referring to its power. This is the amount of sound power falling on (or passing through or crossing) a unit area. Power is measured in watts, so the unit for sound power is watts per square meter (W/m2).
However, sound is not measured using a power meter. Measuring sound power requires complex, expensive instruments capable of detecting power in watts over a specified area. Instead, sound is typically measured in terms of pressure. When you measure sound pressure, you are measuring the amplitude of sound over an area, rather than power over an area. You can measure pressure with a microphone because microphones, like the human eardrum, detect pressure.
Sound Pressure
The decibel describes a base-10 logarithmic relationship of a power ratio between two numbers. It’s a logarithmic scale used to describe ratios with a large range of values that can vary over several orders of magnitude.
We compare one power against another power and take the logarithmic relationship of those two powers. The result is in Bels, but Bels are a bit too large for practical use, so we multiply the result by 10 for a result in decibels (dB).
dB = 10log (P1 / P2)
That works for comparing two powers, but don’t we also use decibels to compare other values such as distances and voltages? Certainly. We also use the decibel for quantifying differences in voltage and distance as they relate to power.
Voltage, distance, and sound pressure are related to power in the same way that power dissipated in an electrical circuit is proportionally related to the square of the voltage in Ohm’s law. In other words, power is proportional to the square of the voltage (electrical pressure), distance, or sound pressure (see Figure 11-2).

Figure 11-2 Power is proportional to the square of the voltage.
Here we compare two voltages:
dB = 10log (V12 / V22)
The voltages are squared and compared with one another. The log of that relationship is multiplied by 10. The resulting change is expressed in decibels. The following example compares two distances:
dB = 10log (D12 / D22)
Or, we could work it in by squaring the voltages or distances or other nonpower numbers that we are comparing, but we can simplify the equation by using 20 times the log instead.
dB = 20log (V1 / V2)
dB = 20log (D1 / D2)
Therefore, you would use the 10log equation for comparing two powers and a 20log equation when comparing like values of anything else.
Particle Displacement
Another important part of sound measurement is particle displacement, measured in meters (m). Particle displacement is the distance of a particle’s movement from its equilibrium position in a medium as it transmits a sound wave.
Sound Interaction
Sound energy moves out and away from the source in all directions. Unless the sound is generated in a completely free space, the energy will encounter a boundary or surface. If you are outdoors, the only likely boundaries may be the ground or nearby buildings. There are many boundaries and surfaces when you are indoors. Besides the walls, ceilings, and floors that you may be thinking of, furniture and people also affect what happens with the sound energy in the environment.
So, what happens to the sound energy produced by either a sound reinforcement system or other source of generated sound? The Law of Conservation of Energy tells us that energy can be transformed from one form to another and transferred from one body to another, but the total amount of energy remains constant.
When sound energy encounters a surface or room boundary, one or more of the following three things occurs (see Figure 11-3):

Figure 11-3 Sound interaction
• Reflection
• Absorption
• Transmission
Before getting into the specifics of what happens to sound within a space, we’ll give you a good overall view of what is occurring in that space.
The separate “sound events” that occur over time have a significant effect on the quality of sound as experienced by the listener. An acoustical consultant, understanding how a venue is to be utilized, can predict each of these events by evaluating and making recommendations regarding the venue’s size, optimum shape, finishes and materials to be used, and so on.
Let’s discuss each event in detail.
Reflection
Figure 11-4 shows the types of sound events that occur in a space. Of such events, you will always have direct sound—sound that arrives directly from the source to the listener.

Figure 11-4 Reflection
If a space has boundaries (such as walls, ceilings, floors, furniture, and so on), there will also be reflections—sound that arrives to the listener after the direct sound as reflected energy. This sound takes an indirect path, taking more travel time before arriving at the listener.
If the sound energy is not absorbed by some material or transmitted into an adjoining space, it will be reflected back into that space. Reflections can be direct, diffuse, or somewhere in between.
Direct Reflections
Direct or specular reflections (Figure 11-5) bounce directly off a surface like light bouncing off a mirror. Like light, the incoming angle (the angle of incidence) will equal the outgoing angle (the angle of reflection).

Figure 11-5 Direct reflections
Scattered Reflections
The second type of reflection energy is scattered or diffused (Figure 11-6). Diffusion is the scattering or random redistribution of a sound wave from a surface. It occurs when surfaces are at least as long as the sound wavelengths but not more than four times as long.
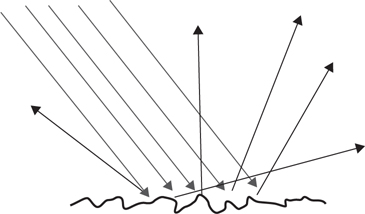
Figure 11-6 Scattered reflections
When sound hits rougher surfaces, it reflects in varying directions. Whether the energy is reflected in a specular or diffused fashion depends on how “smooth” the surface is, relative to the wavelength. Either way, the energy remains in the space.
When the sound energy is diffused, it is dispersed and therefore less noticeable. Dispersed sound can have a tendency to do some self-canceling, in that as it is scattered, the hearer will receive diffused energy from all directions, causing some canceling.
This is similar to the properties exhibited by a matte-white front-projection screen. With a matte-white screen, all incident light that strikes the screen is scattered evenly in all directions. This “even scattering” or “even distribution in all directions” is easily accomplished with visible light energy because light visible to humans covers less than an octave.
Audible sound energy covers ten octaves, making diffusion or any other acoustical control over a wide frequency range difficult to implement. Again, this directly relates to wavelength. For reflecting surfaces to function as diffusers, they must be heavily textured and irregular—the dimensions of irregularities should be nearly equal to the wavelength of sound.
Diffusers Diffusers (pictured), as the name implies, are a good complement to sound absorption because they reduce echoes and reflections without removing sound energy entirely. Their various shapes, sizes, and materials provide a surface for sound to scatter or disperse in different directions. With diffusion, the energy is reflected back at different angles rather than the majority of the energy being reflected at a single specific angle. They are useful for breaking up dead spots from phase cancellation, but they also smooth out the peaks or the response of the room. Additionally, diffusion, like any other acoustical treatment, is effective only over a limited frequency range.

A space without diffusion can feel cavernous, so many professionals include diffusers to improve speech intelligibility and the overall experience for listeners.

TIP Do not confuse diffusers with bass traps. Bass traps are sound absorbers for lower frequencies. They are used mainly for reducing standing waves and low frequency that build up within a space.
Flutter Echoes
One type of hard reflection is a flutter echo. A flutter echo is a series of reflections that continue to bounce back and forth between parallel hard surfaces, such as large walls, ceilings, windows, and floors. Flutter echoes are distracting and should be avoided.

Take a break to check out a brief video demonstrating flutter echoes at www.infocomm.org/FlutterVideo. Note how the sound bounces back and forth off the walls of the room. Appendix C provides links to many helpful videos.
Other types of flutter echoes are “pitched-roof” flutter echoes and flutter echoes created by concave surfaces, but these concepts are beyond the scope of this guide.
Room Modes
A mode (or standing wave or room resonance) is the amount of energy at fixed positions within a room. Room modes significantly affect the perceived low-frequency performance in smaller rooms, such as boardrooms, conference rooms, classrooms, home theaters, music practice rooms, and small studios—really, any relatively small room.
A standing wave occurs when a sound wave travels between two reflecting surfaces, such as two parallel walls. At some frequency, the room’s dimension equals exactly one-half a wavelength at a particular frequency, as well as multiples of that one-half wavelength. The wave reflects back on itself, producing fixed (standing) locations of high and low pressure.
For example, let’s take a room that is 23 ft (7 m) deep. Dividing the speed of sound in the air of 1,130 by 46 (double the room dimension), you get 24.57 Hz. You’d get the same result if you divided 344 by 14 for the metric equivalent. Therefore, a frequency of 24.57 Hz is about 46 ft long; half of that is 23 ft.
The following are standing waves based on the example:
• 23 feet One-half wavelength at 25 Hz
• 46 feet One wavelength at 49 Hz
• 34.5 feet One-and-a-half wavelengths at 74 Hz
• 23 feet Two wavelengths at 98 Hz
In practice, the nulls (minimal pressure) can cancel well enough that they could be indiscernible from the room’s acoustic noise floor.
NOTE This chapter takes into account only axial modes (involving one pair of surfaces). There are also tangential modes (involving two pairs of surfaces) and oblique modes (involving all three room surface pairs) that are not discussed here. Critical room design would include consideration for tangential and oblique modes.
Note in Figure 11-7 that the modes would cover the full width and length of the room. It also illustrates only a slice of the modal distribution. The floor-to-ceiling dimension normally is the room’s smallest dimension (RSD) and sets the frequency at which model behavior becomes dominant.

Figure 11-7 Fixed energy locations in a room
At what point do room modes dominate the low-frequency performance of the room? A simple formula is used to approximate the Schroeder frequency.
Fc = 3 × 1130 / RSD
where:
• Fc is critical frequency.
• 1130 is the speed of sound in air (344 m per sec).
• RSD is the room’s smallest dimension.
As we’ve already noted, the room’s smallest dimension will be the distance from the floor to the ceiling. Also, Fc is not to be considered a single frequency but a transition area. Below the Fc, you would expect room modes to dominate the low-frequency performance of the space.
For example, take a meeting room that is 14 ft wide and 30 ft deep, with a floor-to-ceiling height of 10 ft. The distance from the floor to the ceiling is the variable used in the calculation.
Fc = 3 × 1130 / 10
Fc = 339 Hz
In this example, the transition area into where room modes dominate would be from around 339 Hz below.
During system equalization, placing a measurement microphone in specific locations of either high or low energy will result in an erroneous representation of the actual sound system response.
These areas of high and low energy distribution will also be revealed by the levels shown on an audio spectrum analyzer. With room modes, the energy level shown by the analyzer is completely dependent on the relationship between the microphone’s position and the mode. If the microphone is placed in the location of a peak (maximum energy), the analyzer would show an excessive energy level that one might think needs to be “EQ’d out.” If the microphone is placed in the location of a null, the sound energy might not show at all but would appear as part of the noise floor. And of course, there are locations for all the energy levels in between those two states. Unfortunately, there isn’t a way to equalize electronically based on a room’s physical characteristics.
Figure 11-7 shows fixed energy locations in the room, illustrating only a slice of modal distribution. Note that the modes would cover the full width and length of the room.
Rooms having dimensions that are multiples of one another are least desirable, a cube being the absolutely least desirable room shape. Table 11-1 lists the best room proportions suggested by various researchers. These ratios will yield reasonable low-frequency room quality, as far as the distribution of axial model frequencies is concerned.

Table 11-1 Room Modes
Generally speaking, tangential modes will be –3 dB of the axial mode energy, and oblique modes will be –6 dB less than the axial mode energy. This is because tangential and oblique modes involve greater distances and involve more surfaces. The difference in levels between these types of modes will be more pronounced in a room with acoustical treatment.
Room modes will dominate the low-frequency performance of the room. Because these areas of maximum and minimum pressure (peaks and nulls) are created by the relationship between wavelength and room dimensions and are location specific, these locations will be evident and can be displayed on a spectrum analyzer. Determining the frequency below which room modes dominate helps us to know where our analyzer provides unreliable data. In other words, the data displayed by the analyzer completely depends on microphone placement at those room mode frequencies. Was it placed in an area of maximum or minimum pressure?
Because the analyzer data is unreliable, it is best to set low frequencies on an equalizer by ear. After equalizing an audio system effectively, there may still be unavoidable issues caused by the physical shape and size of a space. In other words, there is no way to “equalize a room.” Different room dimensions cause sound to react in different ways.
Ultimately, the AV professional needs to know when the data seen on the analyzer is completely unreliable. Rooms with dimensions that are multiples of one another reinforce modal frequencies. This can be mitigated by spreading out the room modes—using room dimensions that are not multiples of one another. Those involved with small studio or home theater design might know these as the so-called golden room ratios.
Although smaller rooms, such as conference rooms and boardrooms, are characteristically dominated by room modes, reverberation is an issue in larger rooms.
NOTE The “sound” of a small room is impacted not only by the modal behavior at lower frequencies (around 300 Hz and below—the bottom four octaves of our hearing spectrum) but also by early reflections. Direct sound combines with the energy from early reflections (10 ms or less), and the result is severe tonality shifts. In other words, these severe tonal shifts in the sound occur when early reflected energy combines with direct energy. This doesn’t require a sound system to occur and helps to explain why a small room “sounds like a small room.” Small rooms sound poorly because the dimensions create this direct and early reflection problem.
Reverberation
Reverberation is the sound that persists in a room after the energy that created it is stopped. Adding audio equipment cannot compensate for a room with undesirable acoustic properties.
Reverberation is the combination of many acoustic reflections, which are dense enough that they don’t sound like reflections, but rather act as a sonic decay “tail” to the sounds in a room.
True reverberation is really only a large-room phenomenon and can be a significant issue in large rooms used for speech or contemporary music styles. Examples include gymnasiums used for assembly purposes, an armory used as a reception hall, or a cathedral-style house of worship introducing contemporary-style music. Longer reverberation times are more appropriate for liturgical houses of worship, cathedrals, chamber music, and some concert halls.
You can think of a reverberant room being a sound energy storage tank. The room cannot drain off the energy being introduced into it either by absorption or by transmission.
A statistical reverberant field is reverberation that is well enough spatially diffused that it is essentially the same at all points in a room. Many of the formulas used in acoustics and sound systems assume the existence of a statistical reverberant field, but this does not always exist. A reverberant field doesn’t exist in a small room because the sound energy is not able to develop a diffuse, uniform, random distribution.
When we talk about the reverberation time (RT60) of a room, we assume the room has a statistical reverberant field.
Reverberation Time Persistence of sound energy (reverberation) is measured in terms of time and level. It is also frequency specific. The reverberation time of a space (Figure 11-8) is said to be the number of seconds it takes for the sound to decay to one-thousandth of its original level, or 60 dB. Therefore, we call this RT60.
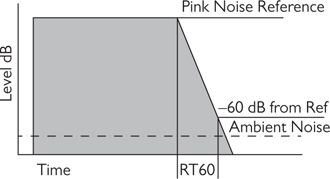
Figure 11-8 Reverberation time
The RT60 value will vary with frequency and environment. In general, spaces primarily intended for speech or more contemporary music require shorter RT60 levels than music, depending on the style. An acoustician can quantify acceptable RT60 times and design the venue accordingly.
Figure 11-9 illustrates some examples of reverberation times in certain types of venues. Note how the reverberation time directly relates to the volume of a room.

Figure 11-9 Reverberation times of various venues
Whether the reflections are either useful or distracting depends on when in time the reflection arrives to the listener after the direct sound, as well as the energy level of the reflection in comparison to the direct sound energy level. See the “Sound Reception” section in this chapter for more information about sound integration.
Absorption
Sound can also be absorbed. Absorption is about slowing down particle velocity (power) using various surfaces, such as porous absorbers. It is the friction between the air molecules and a material.
The effectiveness of different types of absorbers, such as porous or resonant absorbers, is frequency (wavelength) dependent. An absorber effective for a wavelength of 6 in (152.4 mm, or approximately 2000 Hz) will be of little use for a wavelength that is more than 4 ft (1.22 m, or 250 Hz). Such effectiveness is quantified as a coefficient (sabin) over a single octave band.
The noise reduction coefficient (NRC) takes an average of the four middle test frequencies (250, 500, 1000, and 2000). Generally speaking, NRC values smaller than 0.20 are considered to be reflective, while values greater than 0.40 are considered to be absorptive.
While absorption reduces the amount of sound level energy within a room, absorption does not prevent sound energy from being transmitted into an adjoining room. In other words, absorption is not an acoustic barrier.
Another absorption metric gaining popularity is the sound absorption average (SAA). The SAA is a single-number rating that is the average, rounded off to the nearest 0.01, of the sound absorption coefficients of a material for the 12 one-third octave bands from 200 through 2500 Hz. Although the SAA replaces the NRC rating, as directed by the ASTM C423 in 2000, most product literature still uses NRC values.
While air absorption will not be a factor in a typical conference room, boardroom, or meeting room, it is a factor in larger rooms. As you get farther away from the source, the sound energy spreads out, and some of the energy is absorbed by the air as well.
The absorption coefficient of a surface is the ratio of the energy absorbed by the surface to the energy incident. It typically lies between 0 and 1, which represent nonabsorbing and totally absorbing surfaces, respectively. Values greater than 1 are often found in random incident measurements, although theoretically impossible. This usually occurs because of diffraction/edge effects. The absorption coefficient can be defined for a specific angle of incidence or random incidence as required.
Absorption coefficients are measured at 125, 250, 500, 1000, 2000, and 4000 Hz, according to ASTM C423-09a, Standard Test Method for Sound Absorption and Sound Absorption Coefficients by the Reverberation Room Method.
Table 11-2 shows air attenuation coefficient values for some of the frequency levels.

Table 11-2 Air Attenuation Coefficient
The amount of absorption varies with frequency (wavelength), and porous absorbers have limited effectiveness below about 250 Hz (a 4.5 ft, 1.37 m wavelength).
Porous Absorbers
As the displaced air molecules pass through a porous absorber, the friction between the molecules and the material of the absorber slows down the molecules. While there may still be some reflected sound back into the room, a much greater portion of the sound has otherwise been absorbed.

Typical porous absorbers include carpets, acoustic tiles, acoustical foams (pictured), curtains, upholstered furniture, people, and their clothing. The effectiveness of different types of absorbers, such as porous or resonant absorbers, is frequency (wavelength) dependent.
Porous absorbers are primarily effective at middle and high frequencies. Fittingly, this range is where the ear is most sensitive and where noise control is most needed in many environments.
Resonant Absorbers
Resonant absorbers are used to manage frequencies where the size or thickness of porous absorbers in those cases would be too expensive or difficult to manage. Additionally, resonant absorbers are typically placed in room boundaries or wall surfaces where porous absorbers fail to affect low-velocity sound waves. Typical resonant absorber construction consists of a gypsum panel and spacing filled with absorbent, insulating material.
NOTE Make sure the absorber is compliant with ASTM E84, Standard Test Method for Surface Burning Characteristics of Building Materials. Foam material, such as craft foam, which is not fire-rated, should never be used in acoustical engineering applications.
Transmission
We know sound can be transmitted through walls and other building materials. Certain materials and construction methods can also be rated on their ability to attenuate sound passing through them.
The greater a material’s mass, the higher the transmission loss. The less energy transmitted, the more energy reflected. You can predict the transmission loss of single-layer, impermeable materials using a simple formula known as the acoustic mass law.
TL = 20 * log (m * f) – 47.2
where:
• TL is the transmission loss in dB.
• m is the mass in kg/m2.
• f is the frequency in Hz.
According to the formula, the greater a material’s mass, the higher the transmission loss of any given frequency. In addition, the higher the frequency, the higher the transmission loss of any given mass of material. This explains why you can hear bass thumping outside a music venue but not the vocals.
The formula for mass law (see Figure 11-10) demonstrates a concept, but it doesn’t translate directly to the real world.

Figure 11-10 Mass law
As an AV professional, you won’t typically be expected to perform acoustical calculations such as the total absorption of a space or the transmission loss of a partition. These are the purview of an acoustical engineer.
However, knowing the basics of how sound wave behavior can be predicted and manipulated can help you make recommendations that prevent adjacency issues and improve the performance of the AV system.
Also remember to keep these factors about mass law in mind:
• It doesn’t account for acoustic effects that occur at very low frequencies (below 50 Hz) where transmission loss is more dependent on resonance effects and material stiffness than mass.
• It doesn’t account for acoustic effects that decrease transmission loss at high frequencies (above 5 kHz). Transmission loss also drops at the critical frequency—the frequency at which incident sound waves graze the surface because they are parallel to it.
• Finally, the mass law cannot account for any leakage that allows sound to be transmitted through the air around the material.
Still, the mass law remains a good general guideline—denser materials provide better transmission loss, reflecting more sound than less dense materials.
Sound transmission class (STC) rates transmission loss at speech frequencies from 125 to 4000 Hz plotted against a standard contour as the reference. STC does not evaluate performance at frequencies below 125 Hz, where music and mechanical equipment noise levels can be high.
Table 11-3 shows typical STC ranges associated with certain expected levels of privacy, assuming background noise levels of approximately 35 dB SPL A-weighted. Note that these ranges will not provide isolation from low-frequency energy.

Table 11-3 Typical Speech Privacy Associated with STC Ratings
Also note that these ratings assume no significant flanking paths or partition openings. Slight breaches, such as gaps around conduit or plumbing or unsealed cracks at the ceiling or floor, allow sounds to come through walls that are supposed to be barriers. They are undesirable and defeat the purpose of the barrier.
TIP Because STC doesn’t account for the low frequencies produced by music and mechanical noise, it is useful only for measuring the transmission properties of a material with respect to speech.
Selecting proper building materials and construction techniques can help to keep the conference room quiet. A concrete block wall where each block is 8 in thick will yield an STC 45 rating. If there were a 92 dB SPL sound on one side of the wall, the sound could penetrate but be reduced to a level of about 47 dB SPL (barring any other means for the sound to get over, around, or through the wall).
This same block wall can become an STC 56 by applying plaster to both sides. Additional construction materials applied can further increase the STC rating.
Figure 11-11 compares the STC ratings of various wall constructions. These are using 5/8 inch (15.8 mm) gypsum and assume no penetrations or flanking paths.
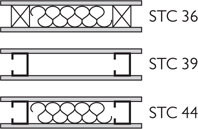
Figure 11-11 Sound transmission coefficient ratings 36, 39, and 44
The STC 36 utilizes wooden studs and absorptive material. The STC 39 and STC 44 use metal studs. Metal studs are often more effective because their flexible nature provides certain isolation from vibration. They decouple one side from another so it reduces noise transmission through the structure.
Figure 11-12 shows staggered-stud and doubled-studded wall construction, again using 5/8 in (15.8 mm) gypsum. The double-studded wall assumes a 1 in (25.4 mm) air gap.

Figure 11-12 Sound transmission coefficient ratings 46 and 57
The STC 46 uses staggering studs that also can support further mounting of shelves and hardware. Typically wood is chosen. It is difficult to stagger metal studs because of the need to use a continuous runner at the top and bottom plates. Staggered studs represent a compromise between single-stud and double-stud construction.
STC 57 implements a double-stud technique. In both cases, the studs don’t touch, providing more airspace and less possibility that vibrations will resonate through the wall via the studs.
Impact insulation class (IIC) is a rating used to quantify impact sound absorption. It is an average of the attenuation in decibels that occurs at frequencies ranging from 100 to 3150 Hz. The higher the IIC rating is, the better insulation from impact noise the material provides.
The higher the IIC rating, the better the insulation from impact noise. An IIC rating of 50 is considered the minimum for flooring in residential buildings like apartment high-rises.
IIC ratings are especially important with respect to barriers between floors. Think about how the spaces above and below the AV environment will be used. How much impact noise will result from the activities in the space above yours? What about in the AV space itself? Ensure that the IIC of the floor above is sufficient to keep listeners from being distracted by impact noise. You should also make sure that the IIC of your own floor keeps the occupants of the space below from being bothered by activities in the AV space.
Table 11-4 shows IIC ratings for 6 in (152.4 mm) concrete slab with various toppings.

Table 11-4 Impact Insulation Class Ratings
NOTE Like STC or NRC, IIC is a one-number metric that is an average of performance across a frequency range. It doesn’t tell the whole story, especially since the impact of a high-heel shoe on a tile floor produces sound at a different frequency from a boot on a wooden joist.
Sound Reception
Many things can distract from the intended message in a meeting space. The lights may emit a buzzing sound. The water cooler in the corner may turn on and off. The ventilation system may rattle as it heats or cools the room. Noise from outside the space, such as traffic or nearby construction, can intrude into the space. Each of these items adds to the overall background noise in a space.
Because excessive noise levels interfere with the message being communicated, ideally background noise–level limits will be specified by an acoustician, audiovisual consultant, or designer appropriate to the type of room and its designed purpose. In other words, the criteria and limits for background noise levels for a gymnasium will be much different from those of a conference room. The heating, ventilation, and air conditioning (HVAC) system, partitions, and any necessary acoustical treatment will be designed and applied so that the background noise–level criteria is not exceeded.
A room’s acoustical properties (such as reflections and types, amount of transmission allowed) and background noise levels are significant contributors to a sound system’s overall effectiveness. We’ll discuss the effects of each and how they can be handled in design.
Integration Process
Within certain time frames, our ear/brain system processes direct and reflected energy as one sound event (the integration process). And within a certain time frame, many of these reflections can be useful, adding apparent “fullness” to the direct sound.
An important unseen effect is an increase in loudness, which occurs when the reflected sound is within what is colloquially called the integration interval—about 30 ms for speech and 50 ms for music, depending on the temporal structure of the sound.
Small conferencing rooms often have reflections arriving 10 ms or less after the direct sound. These short time frames often require room treatments, especially in conferencing rooms with tele- or videoconferencing capabilities. Large fan-shaped auditoriums often have late reflections arriving later than 50 ms after the direct sound.
While possibly acceptable for music (depending on musical style—more contemporary styles of music don’t work well with the later reflection times), reflections arriving later than 50 ms are not acceptable in a speech application. That’s because late reflections hinder speech intelligibility.
Some “early” reflections are actually useful reflections in that if they arrive close enough in time behind the direct sound, your ear/brain system actually integrates both the direct and delayed reflection and perceives only one sound. The perception of integration will depend somewhat on what you are listening to. Your brain can integrate a greater delay with music than it can with speech.
Our brain uses the comparison between direct and reflected sound to determine the direction of the sound’s origin, a psychoacoustic effect called precedence effect and first described by Helmut Haas in his Ph.D. thesis (hence the name Haas effect). We use the direct sound—the sound arriving first at the listener—for directional cues.
This has important implications for sound system design in presentation environments.
In some situations, it may be required to have some loudspeakers on a delay line, such as underneath a balcony, for example. If you want listeners’ attention to be drawn to a presentation area at the front of the room, the sound from loudspeakers at the front must reach them before the sound from loudspeakers in other parts of the room. Also, sound from the latter loudspeakers can’t be allowed to drown out sound from the former. Delay and sound pressure level of loudspeakers must be set accordingly.
This integration of direct and reflected sound (see Figure 11-13) is similar to the human visual system integrating a series of still pictures resulting in apparent motion. The presentation of a moving image, either by a movie projector or by a video screen, depends on an attribute of human eyesight called persistence of vision. In simple terms, this means that if a succession of images are presented to us rapidly enough, we do not see them as separate images. As the presentation rate is slowed down, we become more and more aware of flicker, which can be highly objectionable.

Figure 11-13 Integration of direct and reflected sound
If sound reflections arrive after these integration times listed for music and speech, we will perceive these reflections as discrete echoes, and these later reflections can diminish intelligibility.
What about reflections arriving within 10 ms of the direct sound? Again, knowing that sound travels about 1,130 feet per second or 1.13 feet per millisecond in air, you can determine the wavelength of various frequencies by using the wavelength formula (see the “Sound Propagation” section). For a frequency of 1000 Hz, the wavelength is 1.13 ft. A complete cancellation will occur at one-half that wavelength. So if a reflection takes an additional path length of 0.565 ft over the direct sound, cancellation, or a notch in frequency response, will occur at 1000 Hz and subsequently every multiple of 1000 Hz, creating an overall comb filter response.
You can discover the frequency of the first notch by using the following formula:
F = 1 / 2t
where:
• F is the frequency.
• t is the time in seconds.
So, calculating for a 5 ms delay would look like this:
F = 1 / 2 (0.005) = 100 Hz
The first notch of the comb filter would be at 100 Hz and create additional notches at every multiple of 100 Hz. The first notch of a 10 ms delay would be at 50 Hz, with its subsequent multiples. These notches take out large chucks of the audible spectrum, especially in the speech region. Once you get out to about 15 ms or 33 Hz, the subsequent multiples become much denser, and the notches created by the delayed wave energy become less noticeable.
In small rooms, the additional path lengths taken by reflections are quite short when compared to larger rooms. This explains why smaller rooms devoid of acoustical treatment and with lots of hard, highly reflective surfaces, sound like they do. The listening environment in a small room is not always pleasant.
Not all reflections are bad. Figures 11-14, 11-15, and 11-16 show how an acoustician may direct reflections in an auditorium in a useful way. Bear in mind that these illustrations show only energy reflected off the ceiling. Reflections from the floor and walls should also be taken into consideration. This is where an acoustician can provide recommendations for room shapes and materials.

Figure 11-14 Auditorium with a flat ceiling

Figure 11-15 Auditorium with segmented ceiling

Figure 11-16 Auditorium with stepped flat ceiling
Noise Classes
Figure 11-17 shows a side-by-side comparison of the NC, RC, and NCB graphs. An acoustician, AV consultant, or AV designer will specify the maximum background noise limits to the architect, other consultants on the project, and the owner. These limits will inform the other parties in regard to certain decisions about construction techniques, devices, and implementation of various aspects of the building services.

Figure 11-17 Comparing NC, RC, and NCB
The prevalent method for defining the maximum permissible background noise generated by mechanical systems in buildings has been developed by the American Society for Heating, Refrigerating, and Air-Conditioning Engineers (ASHRAE).
The method consists of comparing the octave band pressure levels of a noise with a family of curves known as noise criteria (NC) or room criteria (RC). Notice that the shape of the curves compensate for the loudness response of the ear, permitting higher levels at the low frequencies. RC curves are slightly more restrictive than the NC curves at the lowest and highest frequencies and are preferred by many mechanical system designers because the slope of the contours presumably matches more closely a well-balanced, bland-sounding spectrum.
RC ratings have suffixes that indicate the character of the sound.
• N indicates a balanced, or neutral, spectrum.
• R indicates a rumbly sound.
• H indicates a hissy sound.
• RV indicates perceptible vibration.
The balanced noise-criterion (NCB) curve is part of the ANSI/Acoustical Society of America (ASA) S12.2-2008 standard, Criteria for Evaluating Room Noise. This standard offers two methods for evaluating the sound in an occupied space. It is used before construction to specify acceptable octave-band noise levels and is used after construction to rate the noises’ effect on speech communications. It can be used to identify spectral imbalance, such as noise or hiss. The curve also recommends the number of decibels of noise reduction needed to eliminate the problem.
Background Noise
Background noise can be a large factor in the effectiveness of an AV system. Excessive ambient noise levels result in less effective communication because of listener fatigue. Background noise can come from outside of the room and could include sounds from adjacent rooms, foot traffic from spaces above, structure-borne vibrations, and traffic on the street. Background noise can come from sources within the room as well, particularly from the HVAC system and from AV equipment such as projectors, displays, power amplifiers, and IT equipment.
Ambient noise is the background noise that originates from all sources other than the desired source. It is any sound other than the desired signal. While an electronic sound system has inherent noise in the electronic components, rooms also have noise associated with them. Unwanted background noise in a room can come from equipment fans, office machines, the HVAC system, or the actual people in the room. Noise can intrude from outside the room as well, through partitions or windows. Outside sources can include vehicular traffic, adjoining corridors, and structure-borne vibrations. See the “Reception” section later in this chapter for background noise recommendations.
Background Noise Recommendations
Table 11-5, adapted from the ANSI/ASA Standard S12.60-2010 and Sound System Engineering, Third Edition, provides recommendations for background noise levels for certain types of venues.


Table 11-5 Background Noise Recommendations
TIP Do not use A-weighted sound pressure levels for specification or noise analysis. dB-SPL A-weighted measurements are only rough approximations and provide no information regarding spectrum shape and frequency content.
Chapter Review
You have just reviewed the impact that a facility’s acoustical properties can have on audio system design. Sound is a huge factor when you’re designing in a space. There are many important considerations that you as a designer need to incorporate into your plans. Now that you know what to look out for, you’ll be able to design successfully your AV systems around the space you’re working in.
Review Questions
The following questions are based on the content covered in this chapter and are intended to help reinforce the knowledge you have assimilated. These questions are not extracted from the CTS-D exam nor are they necessarily CTS-D practice exam questions. For an official CTS-D practice exam, download the Total Tester as described in Appendix D.
1. What formula is used to predict the transmission loss of single-layer, impermeable materials?
A. Ohm’s law
B. Mass law
C. Frequency coefficient
D. Inverse square law
2. What is the STC range for adequate privacy?
A. 0–20
B. 20–40
C. 40–55
D. 55–65
3. If sound transmission class measures a material’s ability to halt sound traveling through the air, how is transmission of sound resulting from impacts, such as footfalls on the floor above, quantified?
A. Noise reduction coefficient (NRC)
B. Sound transmission class (STC)
C. Impact insulation class (IIC)
D. Noise criteria (NC)
4. What unseen effect occurs when the reflected sound is within the integration interval—about 30 ms for speech and 50 ms or more for music?
A. Scattering of the sound throughout the venue
B. Echo
C. Amplitude modulation
D. An increase in loudness
5. Which device will reveal areas of high and low energy distribution?
A. Peak level indicator
B. Spectrum analyzer
C. Oscilloscope
D. Pink noise generator
Answers
1. B. Mass law allows designers to predict the transmission loss of single-layer, impermeable materials.
2. C. The STC range for adequate privacy is 40–55.
3. C. The transmission of sound resulting from impacts, such as footfalls, is quantified by impact insulation class (IIC).
4. D. When reflected sound is within what’s known as the integration interval, you’ll hear an increase in loudness.
5. B. A spectrum analyzer will show you areas of high and low energy distribution.