 Graphical Analysis of Pass-By-Value and Pass-By-Reference
by Harvey M. Deitel, Abbey Deitel, Paul J. Deitel
C++11 for Programmers, Second Edition
Graphical Analysis of Pass-By-Value and Pass-By-Reference
by Harvey M. Deitel, Abbey Deitel, Paul J. Deitel
C++11 for Programmers, Second Edition
- Title Page
- Copyright Page
- Dedication Page
- Contents
- Preface
- 1. Introduction
- 2. Introduction to C++ Programming, Input/Output and Operators
- 3. Introduction to Classes, Objects and Strings
- 3.1. Introduction
- 3.2. Defining a Class with a Member Function
- 3.3. Defining a Member Function with a Parameter
- 3.4. Data Members, set Member Functions and get Member Functions
- GradeBook Class with a Data Member, and set and get Member Functions
- Access Specifiers public and private
- Member Functions setCourseName and getCourseName
- Member Function displayMessage
- Testing Class GradeBook
- Software Engineering with Set and Get Functions
- GradeBook’s UML Class Diagram with a Data Member and set and get Functions
- 3.5. Initializing Objects with Constructors
- 3.6. Placing a Class in a Separate File for Reusability
- 3.7. Separating Interface from Implementation
- 3.8. Validating Data with set Functions
- 3.9. Wrap-Up
- 4. Control Statements: Part 1; Assignment, ++ and -- Operators
- 4.1. Introduction
- 4.2. Control Structures
- 4.3. if Selection Statement
- 4.4. if...else Double-Selection Statement
- 4.5. while Repetition Statement
- 4.6. Counter-Controlled Repetition
- 4.7. Sentinel-Controlled Repetition
- Implementing Sentinel-Controlled Repetition in Class GradeBook
- Program Logic for Sentinel-Controlled Repetition vs. Counter-Controlled Repetition
- Floating-Point Number Precision and Memory Requirements
- Converting Between Fundamental Types Explicitly and Implicitly
- Formatting for Floating-Point Numbers
- A Note About Unsigned Integers
- 4.8. Nested Control Statements
- 4.9. Assignment Operators
- 4.10. Increment and Decrement Operators
- 4.11. Wrap-Up
- 5. Control Statements: Part 2; Logical Operators
- 5.1. Introduction
- 5.2. Essentials of Counter-Controlled Repetition
- 5.3. for Repetition Statement
- for Statement Header Components
- Off-By-One Errors
- General Format of a for Statement
- Comma-Separated Lists of Expressions
- Expressions in the for Statement’s Header Are Optional
- Increment Expression Acts Like a Standalone Statement
- for Statement: Notes and Observations
- for Statement UML Activity Diagram
- 5.4. Examples Using the for Statement
- 5.5. do...while Repetition Statement
- 5.6. switch Multiple-Selection Statement
- GradeBook Class with switch Statement to Count A, B, C, D and F Grades
- GradeBook Class Header
- GradeBook Class Source-Code File
- Reading Character Input
- Entering the EOF Indicator
- switch Statement Details
- Providing a default Case
- Ignoring Newline, Tab and Blank Characters in Input
- Testing Class GradeBook
- switch Statement UML Activity Diagram
- Notes on Data Types
- C++11 In-Class Initializers
- 5.7. break and continue Statements
- 5.8. Logical Operators
- 5.9. Confusing the Equality (==) and Assignment (=) Operators
- 5.10. Wrap-Up
- 6. Functions and an Introduction to Recursion
- 6.1. Introduction
- 6.2. Math Library Functions
- 6.3. Function Definitions with Multiple Parameters
- 6.4. Function Prototypes and Argument Coercion
- 6.5. C++ Standard Library Headers
- 6.6. Case Study: Random Number Generation
- 6.7. Case Study: Game of Chance; Introducing enum
- 6.8. C++11 Random Numbers
- 6.9. Storage Classes and Storage Duration
- 6.10. Scope Rules
- 6.11. Function Call Stack and Activation Records
- 6.12. Functions with Empty Parameter Lists
- 6.13. Inline Functions
- 6.14. References and Reference Parameters
- 6.15. Default Arguments
- 6.16. Unary Scope Resolution Operator
- 6.17. Function Overloading
- 6.18. Function Templates
- 6.19. Recursion
- 6.20. Example Using Recursion: Fibonacci Series
- 6.21. Recursion vs. Iteration
- 6.22. Wrap-Up
- 7. Class Templates array and vector; Catching Exceptions
- 7.1. Introduction
- 7.2. arrays
- 7.3. Declaring arrays
- 7.4. Examples Using arrays
- 7.4.1. Declaring an array and Using a Loop to Initialize the array’s Elements
- 7.4.2. Initializing an array in a Declaration with an Initializer List
- 7.4.3. Specifying an array’s Size with a Constant Variable and Setting array Elements with Calculations
- 7.4.4. Summing the Elements of an array
- 7.4.5. Using Bar Charts to Display array Data Graphically
- 7.4.6. Using the Elements of an array as Counters
- 7.4.7. Using arrays to Summarize Survey Results
- 7.4.8. Static Local arrays and Automatic Local arrays
- 7.5. Range-Based for Statement
- 7.6. Case Study: Class GradeBook Using an array to Store Grades
- 7.7. Sorting and Searching arrays
- 7.8. Multidimensional arrays
- 7.9. Case Study: Class GradeBook Using a Two-Dimensional array
- 7.10. Introduction to C++ Standard Library Class Template vector
- Creating vector Objects
- vector Member Function size; Function outputVector
- Function inputVector
- Comparing vector Objects for Inequality
- Initializing One vector with the Contents of Another
- Assigning vectors and Comparing vectors for Equality
- Using the [] Operator to Access and Modify vector Elements
- Exception Handling: Processing an Out-of-Range Subscript
- The try Statement
- Executing the catch Block
- what Member Function of the Exception Parameter
- Changing the Size of a vector
- C++11: List Initializing a vector
- 7.11. Wrap-Up
- 8. Pointers
- 8.1. Introduction
- 8.2. Pointer Variable Declarations and Initialization
- 8.3. Pointer Operators
- 8.4. Pass-by-Reference with Pointers
- 8.5. Built-In Arrays
- 8.6. Using const with Pointers
- 8.7. sizeof Operator
- 8.8. Pointer Expressions and Pointer Arithmetic
- 8.9. Relationship Between Pointers and Built-In Arrays
- 8.10. Pointer-Based Strings
- Characters and Character Constants
- Strings
- Pointer-Based Strings
- String Literals as Initializers
- Character Constants as Initializers
- Accessing Characters in a C String
- Reading Strings into char Built-In Arrays with cin
- Reading Lines of Text into char Built-In Arrays with cin.getline
- Displaying C Strings
- 8.11. Wrap-Up
- 9. Classes: A Deeper Look; Throwing Exceptions
- 9.1. Introduction
- 9.2. Time Class Case Study
- Time Class Definition
- Time Class Member Functions
- Time Class Member Function setTime and Throwing Exceptions
- Time Class Member Function printUniversal
- Time Class Member Function printStandard
- Defining Member Functions Outside the Class Definition; Class Scope
- Member Functions vs. Global Functions (Also Called Free Functions)
- Using Class Time
- Calling setTime with Invalid Values
- Looking Ahead to Composition and Inheritance
- Object Size
- 9.3. Class Scope and Accessing Class Members
- 9.4. Access Functions and Utility Functions
- 9.5. Time Class Case Study: Constructors with Default Arguments
- 9.6. Destructors
- 9.7. When Constructors and Destructors Are Called
- 9.8. Time Class Case Study: A Subtle Trap—Returning a Reference or a Pointer to a private Data Member
- 9.9. Default Memberwise Assignment
- 9.10. const Objects and const Member Functions
- 9.11. Composition: Objects as Members of Classes
- 9.12. friend Functions and friend Classes
- 9.13. Using the this Pointer
- 9.14. static Class Members
- 9.15. Wrap-Up
- 10. Operator Overloading; Class string
- 10.1. Introduction
- 10.2. Using the Overloaded Operators of Standard Library Class string
- 10.3. Fundamentals of Operator Overloading
- 10.4. Overloading Binary Operators
- 10.5. Overloading the Binary Stream Insertion and Stream Extraction Operators
- 10.6. Overloading Unary Operators
- 10.7. Overloading the Unary Prefix and Postfix ++ and -- Operators
- 10.8. Case Study: A Date Class
- 10.9. Dynamic Memory Management
- Obtaining Dynamic Memory with new
- Releasing Dynamic Memory with delete
- Initializing Dynamic Memory
- Dynamically Allocating Built-In Arrays with new []
- C++11: Using a List Initializer with a Dynamically Allocated Built-In Array
- Releasing Dynamically Allocated Built-In Arrays with delete []
- C++11: Managing Dynamically Allocated Memory with unique_ptr
- 10.10. Case Study: Array Class
- 10.11. Operators as Member vs. Non-Member Functions
- 10.12. Converting Between Types
- 10.13. explicit Constructors and Conversion Operators
- 10.14. Overloading the Function Call Operator ()
- 10.15. Wrap-Up
- 11. Object-Oriented Programming: Inheritance
- 11.1. Introduction
- 11.2. Base Classes and Derived Classes
- 11.3. Relationship between Base and Derived Classes
- 11.3.1. Creating and Using a CommissionEmployee Class
- 11.3.2. Creating a BasePlusCommissionEmployee Class Without Using Inheritance
- 11.3.3. Creating a CommissionEmployee–BasePlusCommissionEmployee Inheritance Hierarchy
- 11.3.4. CommissionEmployee–BasePlusCommissionEmployee Inheritance Hierarchy Using protected Data
- 11.3.5. CommissionEmployee–BasePlusCommissionEmployee Inheritance Hierarchy Using private Data
- 11.4. Constructors and Destructors in Derived Classes
- 11.5. public, protected and private Inheritance
- 11.6. Software Engineering with Inheritance
- 11.7. Wrap-Up
- 12. Object-Oriented Programming: Polymorphism
- 12.1. Introduction
- 12.2. Introduction to Polymorphism: Polymorphic Video Game
- 12.3. Relationships Among Objects in an Inheritance Hierarchy
- 12.4. Type Fields and switch Statements
- 12.5. Abstract Classes and Pure virtual Functions
- 12.6. Case Study: Payroll System Using Polymorphism
- 12.7. (Optional) Polymorphism, Virtual Functions and Dynamic Binding “Under the Hood”
- 12.8. Case Study: Payroll System Using Polymorphism and Runtime Type Information with Downcasting, dynamic_cast, typeid and type_info
- 12.9. Wrap-Up
- 13. Stream Input/Output: A Deeper Look
- 13.1. Introduction
- 13.2. Streams
- 13.3. Stream Output
- 13.4. Stream Input
- 13.5. Unformatted I/O Using read, write and gcount
- 13.6. Introduction to Stream Manipulators
- 13.7. Stream Format States and Stream Manipulators
- 13.7.1. Trailing Zeros and Decimal Points (showpoint)
- 13.7.2. Justification (left, right and internal)
- 13.7.3. Padding (fill, setfill)
- 13.7.4. Integral Stream Base (dec, oct, hex, showbase)
- 13.7.5. Floating-Point Numbers; Scientific and Fixed Notation (scientific, fixed)
- 13.7.6. Uppercase/Lowercase Control (uppercase)
- 13.7.7. Specifying Boolean Format (boolalpha)
- 13.7.8. Setting and Resetting the Format State via Member Function flags
- 13.8. Stream Error States
- 13.9. Tying an Output Stream to an Input Stream
- 13.10. Wrap-Up
- 14. File Processing
- 14.1. Introduction
- 14.2. Files and Streams
- 14.3. Creating a Sequential File
- 14.4. Reading Data from a Sequential File
- 14.5. Updating Sequential Files
- 14.6. Random-Access Files
- 14.7. Creating a Random-Access File
- 14.8. Writing Data Randomly to a Random-Access File
- 14.9. Reading from a Random-Access File Sequentially
- 14.10. Case Study: A Transaction-Processing Program
- 14.11. Object Serialization
- 14.12. Wrap-Up
- 15. Standard Library Containers and Iterators
- 16. Standard Library Algorithms
- 16.1. Introduction
- 16.2. Minimum Iterator Requirements
- 16.3. Algorithms
- 16.3.1. fill, fill_n, generate and generate_n
- 16.3.2. equal, mismatch and lexicographical_compare
- 16.3.3. remove, remove_if, remove_copy and remove_copy_if
- 16.3.4. replace, replace_if, replace_copy and replace_copy_if
- 16.3.5. Mathematical Algorithms
- 16.3.6. Basic Searching and Sorting Algorithms
- 16.3.7. swap, iter_swap and swap_ranges
- 16.3.8. copy_backward, merge, unique and reverse
- 16.3.9. inplace_merge, unique_copy and reverse_copy
- 16.3.10. Set Operations
- 16.3.11. lower_bound, upper_bound and equal_range
- 16.3.12. Heapsort
- 16.3.13. min, max, minmax and minmax_element
- 16.4. Function Objects
- 16.5. Lambda Expressions
- 16.6. Standard Library Algorithm Summary
- 16.7. Wrap-Up
- 17. Exception Handling: A Deeper Look
- 17.1. Introduction
- 17.2. Example: Handling an Attempt to Divide by Zero
- Defining an Exception Class to Represent the Type of Problem That Might Occur
- Demonstrating Exception Handling
- Enclosing Code in a try Block
- Defining a catch Handler to Process a DivideByZeroException
- Termination Model of Exception Handling
- Flow of Program Control When the User Enters a Nonzero Denominator
- Flow of Program Control When the User Enters a Denominator of Zero
- 17.3. Rethrowing an Exception
- 17.4. Stack Unwinding
- 17.5. When to Use Exception Handling
- 17.6. Constructors, Destructors and Exception Handling
- 17.7. Exceptions and Inheritance
- 17.8. Processing new Failures
- 17.9. Class unique_ptr and Dynamic Memory Allocation
- 17.10. Standard Library Exception Hierarchy
- 17.11. Wrap-Up
- 18. Introduction to Custom Templates
- 19. Class string and String Stream Processing: A Deeper Look
- 19.1. Introduction
- 19.2. string Assignment and Concatenation
- 19.3. Comparing strings
- 19.4. Substrings
- 19.5. Swapping strings
- 19.6. string Characteristics
- 19.7. Finding Substrings and Characters in a string
- 19.8. Replacing Characters in a string
- 19.9. Inserting Characters into a string
- 19.10. Conversion to Pointer-Based char * Strings
- 19.11. Iterators
- 19.12. String Stream Processing
- 19.13. C++11 Numeric Conversion Functions
- 19.14. Wrap-Up
- 20. Bits, Characters, C Strings and structs
- 20.1. Introduction
- 20.2. Structure Definitions
- 20.3. typedef
- 20.4. Example: Card Shuffling and Dealing Simulation
- 20.5. Bitwise Operators
- 20.6. Bit Fields
- 20.7. Character-Handling Library
- 20.8. C String-Manipulation Functions
- 20.9. C String-Conversion Functions
- 20.10. Search Functions of the C String-Handling Library
- 20.11. Memory Functions of the C String-Handling Library
- 20.12. Wrap-Up
- 21. Other Topics
- 22. ATM Case Study, Part 1: Object-Oriented Design with the UML
- 22.1. Introduction
- 22.2. Introduction to Object-Oriented Analysis and Design
- 22.3. Examining the ATM Requirements Document
- 22.4. Identifying the Classes in the ATM Requirements Document
- 22.5. Identifying Class Attributes
- 22.6. Identifying Objects’ States and Activities
- 22.7. Identifying Class Operations
- Identifying Operations
- Modeling Operations
- Operations of Class BankDatabase and Class Account
- Operations of Class Screen
- Operations of Class Keypad
- Operations of Class CashDispenser and Class DepositSlot
- Operations of Class ATM
- Identifying and Modeling Operation Parameters
- Self-Review Exercises for Section 22.7
- 22.8. Indicating Collaboration Among Objects
- 22.9. Wrap-Up
- 23. ATM Case Study, Part 2: Implementing an Object-Oriented Design
- 23.1. Introduction
- 23.2. Starting to Program the Classes of the ATM System
- 23.3. Incorporating Inheritance into the ATM System
- 23.4. ATM Case Study Implementation
- 23.4.1. Class ATM
- 23.4.2. Class Screen
- 23.4.3. Class Keypad
- 23.4.4. Class CashDispenser
- 23.4.5. Class DepositSlot
- 23.4.6. Class Account
- 23.4.7. Class BankDatabase
- 23.4.8. Class Transaction
- 23.4.9. Class BalanceInquiry
- 23.4.10. Class Withdrawal
- 23.4.11. Class Deposit
- 23.4.12. Test Program ATMCaseStudy.cpp
- 23.5. Wrap-Up
- A. Operator Precedence and Associativity
- B. ASCII Character Set
- C. Fundamental Types
- D. Number Systems
- D.1. Introduction
- D.2. Abbreviating Binary Numbers as Octal and Hexadecimal Numbers
- D.3. Converting Octal and Hexadecimal Numbers to Binary Numbers
- D.4. Converting from Binary, Octal or Hexadecimal to Decimal
- D.5. Converting from Decimal to Binary, Octal or Hexadecimal
- D.6. Negative Binary Numbers: Two’s Complement Notation
- E. Preprocessor
- E.1. Introduction
- E.2. #include Preprocessing Directive
- E.3. #define Preprocessing Directive: Symbolic Constants
- E.4. #define Preprocessing Directive: Macros
- E.5. Conditional Compilation
- E.6. #error and #pragma Preprocessing Directives
- E.7. Operators # and ##
- E.8. Predefined Symbolic Constants
- E.9. Assertions
- E.10. Wrap-Up
- Index
Graphical Analysis of Pass-By-Value and Pass-By-Reference
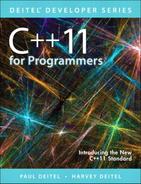
Figures 8.8–8.9 analyze graphically the execution of Fig. 8.6 and Fig. 8.7, respectively. In the diagrams, the values in rectangles above a given expression or variable represent the value of that expression or variable. Each diagram’s right column shows functions cubeByValue (Fig. 8.6) and cubeByReference (Fig. 8.7) only when they’re executing.
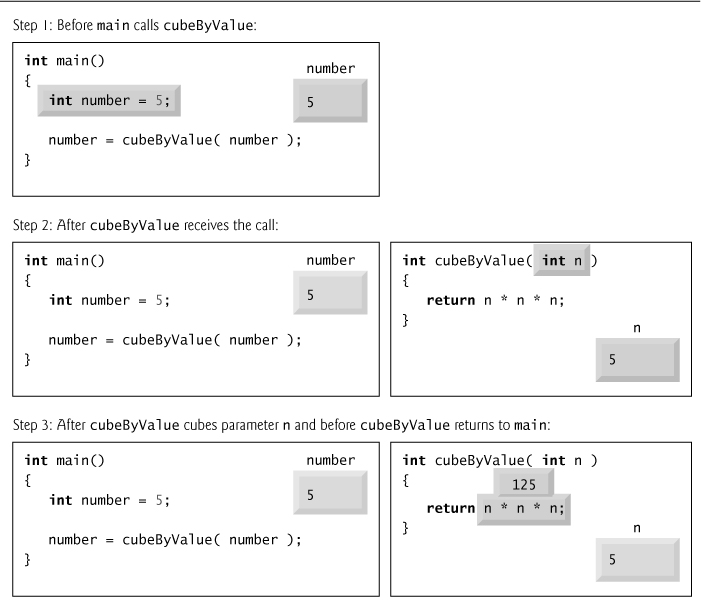
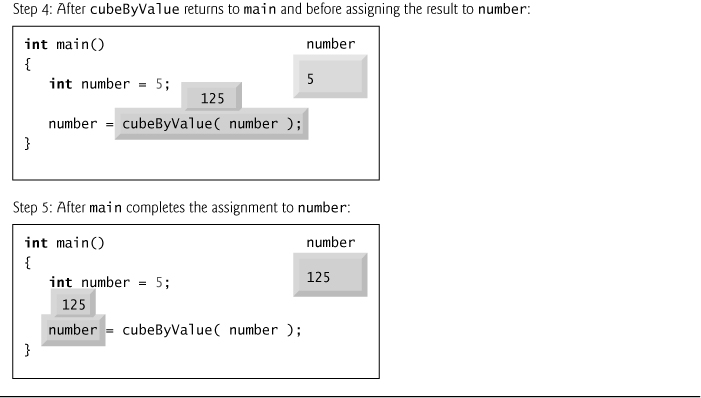
Fig. 8.8. Pass-by-value analysis of the program of Fig. 8.6.
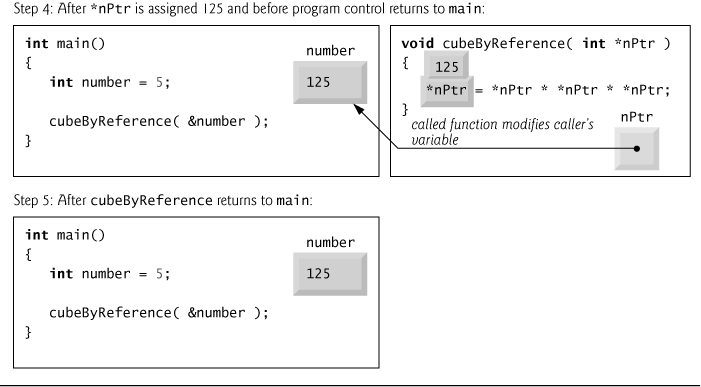
Fig. 8.9. Pass-by-reference analysis of the program of Fig. 8.7.
-
No Comment
..................Content has been hidden....................
You can't read the all page of ebook, please click here login for view all page.