
Chapter 3. Features and Benefits of the IDEFO Activity Modeling Method
This chapter presents the basic principles of IDEFO—the assumptions behind its graphics and the rules for applying its analytical process. Expanding on Chapter 1, the discussion examines the scope of topics that can be handled by IDEFO, the benefits of its use, and a comparison to other popular graphical diagramming methods. Chapter 4 gets even more specific as it presents the detailed syntax and semantics of the IDEFO graphical language, as officially defined in the Federal Standard.
The Seven Basic Principles
There are seven principles—or rules of conduct—that must be followed in order to apply IDEFO techniques successfully:
1. The method must accurately represent the problem area: A graphical model of a system should be developed so that the system elements and their interactions can be defined, documented, communicated, discussed, and analyzed effectively.
2. The model must have a top-down, modular, hierarchical structure: The model should depict the system top-down by defining modular system elements that interact to form a hierarchy.
3. The model must separate function from design: By definition, what the system does (function) must be kept separate from how it does it (design). That is, more than one design can be developed for a single function; this distinction is important. Because of this, design improvements may be developed without disturbing the basic function. If a more drastic (functional) change is called for, then basic functions can be changed and a new design created to meet the new functional requirements.
4. The model must reflect both objects and actions—things and happenings: The modeling method must be able to depict all forms of things and happenings. Restriction of the modeling scope to raw data would leave out the people, resources, raw materials, human factors, and other important influences on the operation of the enterprise, all of which are critical in managing change.
5. The model form must be graphical: The form on which the model is recorded must be graphical, not mathematical or textual. The graphical form must communicate concisely and rigorously to the people who must validate that the model reflects the real functions and processes of the enterprise.
6. The model must be the product of disciplined, coordinated teamwork: To build a model and to achieve consensus among the enterprise staff requires disciplined, coordinated teamwork. The IDEFO method must therefore contain the working rules and procedures for developing and validating the model in an organized way (reader/author cycle forms and procedures, librarian configuration management procedures, and the like).
7. The model must present all information in writing: By having a standardized form on which all information (interview notes, conclusions with their rationale, definitions of terms, and so on) is retained, the method assures that information is not lost during the early stages of the planning cycle. With its forms and procedures, IDEFO provides a convenient means of retaining information.
Scope of Subject Matter That Can Be Handled by IDEFO
As we have stated, IDEFO is a method for analyzing enterprises. An enterprise may be a company, a division of a company, a group of companies working together in a joint venture, a field office of a parent company, a support function within an office (for example, publications, accounting, or payroll), a government agency (for example, the Department of Defense or the Commerce Department), an individual running a small business, or a project within a company. All of these are enterprises, since they are composed of one or more people working to accomplish some form of product development or to provide some service.
The scope of the analysis encompasses manual as well as computerized aspects of the enterprise. IDEFO is particularly useful for rigorously defining the juncture at which manual actions interface with the computer (the so-called man-machine interface). For example, using the viewpoint concept of IDEFO, the author may develop a model from the user’s viewpoint as well as from the software developer’s viewpoint, thus providing a requirements definition from both important aspects of a software system to be developed. The model bridges the communication gap between user and software cultures.
IDEFO analysis does not stop at the man-machine interface, but may be used to model the operation of the software system itself. In fact, the method has been successfully used for many years to model the requirements, top-level design, and detailed design of software systems.
Benefits Resulting from the Use of IDEFO
The primary goal of IDEFO is to facilitate change management, a goal that was introduced in Chapter 2, under the topic “Use of IDEFO for Military Downsizing and Reorganization.” In this chapter, we discuss specific benefits that can be expected from the IDEFO modeling effort.
Stated simply, the goal of the modeling effort must not stop at developing a model. Such a goal leads to models that sit on a shelf and do not achieve real operational benefits. Instead, the purpose of an IDEFO model should be “to provide a baseline on which to plan and manage change.” The model serves as a communication vehicle for streamlining existing processes, for introducing new technology, for evaluating the impact of a change on related processes, and for achieving consensus among the staff involved in the change.
The initial benefits are achieved by the analyst as he creates (authors) the model. In developing the model, the analyst cannot help but identify problems and potential improvements in the operation of the enterprise. When the analysis is complete, the paper model is available, thereby providing documentation on-the-fly and not requiring a separate, after-the-fact documentation phase at the end of the analysis. Specific benefits of IDEFO modeling are as follows:
Identifies Needs: A good IDEFO model will look very simple and easy to understand. Needs and opportunities for improvement revealed during the modeling effort may seem obvious at first, but they would have gone unnoticed otherwise.
Builds Consensus: The diversity of a staff’s background, training, skills, and knowledge can impair communication. The reader/author model critique method can establish a well-defined common basis for understanding by the entire staff. Real consensus, not just imagined consensus, can be reached.
Enhances Vision: The condensed, graphical picture provided by the model presents a thought-provoking baseline on which to consider improvements. An analyst or an enterprise planner who considers potential use of a new technology or new method in light of this baseline may identify specific application opportunities.
Provides a Basis for an Open Architecture: The model structure may be used to define the interfaces between system elements, and to identify precise interfaces for the definition of an open systems architecture. The model bounds the scope precisely by showing where the modeled system fits into the bigger picture.
Broadens Automation and Commonality Potential: Almost any model of any size will reveal activities that are similar to those already modeled in other parts of the structure. These similarities can be used to define improvements, such as a subsystem to support these common activities.
Supports Management Control Through Metrics: The model may serve as a baseline for cost, time, flow capacity, peak loads, and other metrics relevant to the design of a new system. If the model detail is not sufficient to attach specific metrics, the lack of detail should be used to identify where further decomposition is needed. Finer detail in the modeling will facilitate more precise measurement.
Defines Variants for Broader Support System Use: Support systems that are applied to several activities in the model may benefit from a careful analysis of the actual functionality needed at each point of usage. Variants and versions of the support system could save considerable cost if the support system can be fine-tuned for each specific usage point.
Features of IDEFO Analysis
The IDEFO method analyzes a subject by investigating how it operates, by modeling the operational details uncovered, and by applying evaluation techniques (such as “value added” criteria) to identify potential improvements. The author of the model uses two-dimensional, simple graphics as a means of capturing and communicating the results of the analysis.
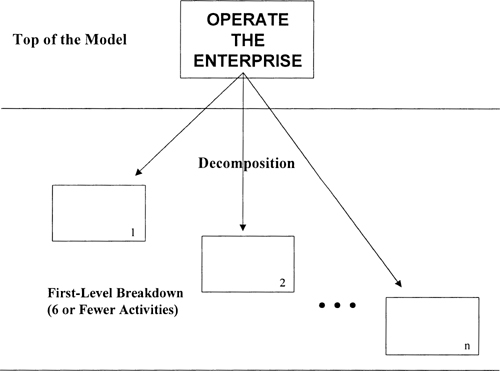
Applying IDEFO to the analysis of an enterprise thus results in a paper, two-dimensional graphical model of the enterprise. The model is hierarchical in nature, consisting of a set of diagrams in which each diagram represents three to six activities of the enterprise. At the top of the IDEFO model, the enterprise is decomposed into three to six very large activities or subsystems that represent the activities of the enterprise (see Figure 3-1). These activities are shown as rectangular boxes.
Once the top-level activity breakdown has reached consensus among the enterprise staff, each of the boxes is further broken down into the next level of detail on a new three-to-six activity diagram. Thus, the entire IDEFO model provides a tree structure of diagrams. Anyone wishing to inspect a particular aspect of the enterprise may scan the tree structure, identify the activity and level of detail that is useful for his purposes, and then retrieve the corresponding IDEFO diagram to study the complete description of the selected activity at the selected level of detail. Figure 3-2 shows a graphical representation of an IDEFO model that breaks down an enterprise into three levels of detail.
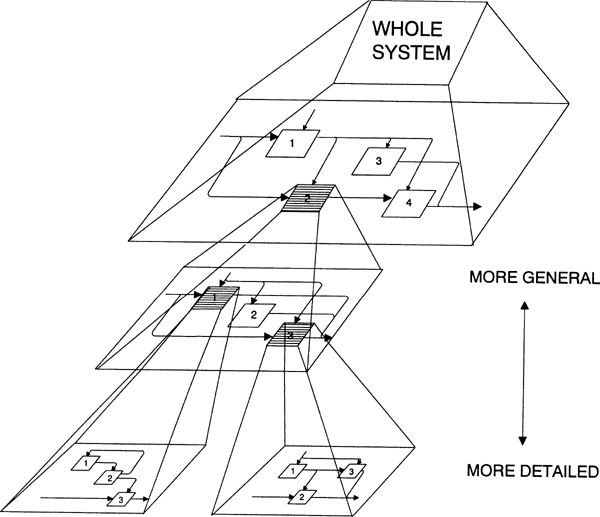
At the top level, the entire system being modeled (labeled Whole System in the figure) is shown as broken down into four parts, labeled 1, 2, 3, and 4. Part 2 is further broken down into a three-part diagram, shown below the initial diagram as emanating from a shaded box 2. Finally, boxes 1 and 3 of the detailed part 2 box are broken down into yet finer detail in the two diagrams displayed at the bottom of the figure. This illustrates an important feature of the IDEFO model: Any aspect may be broken down to be as detailed as necessary, while other aspects may be less completely decomposed. This permits the analyst to zero in on the most critical aspects to be analyzed, while putting off the other aspects until needed.
Comparison to Data Flow Diagramming
Most popular in past decades, the data flow diagram approach to modeling a computer software system is still used today for software design. It provides a picture of the data that are input to and output from the software. Figure 3-3 shows that Location of Assembly and Quality Measurements are input to a Scheduling Database of information about the status of a part. When a process has been completed, the assembly machine sends a “Process Complete” Status signal to the database, as an additional input. Thus, the database has a running record of where the part is located and which processes have been performed. As output, the software produces a report on the status of the part.
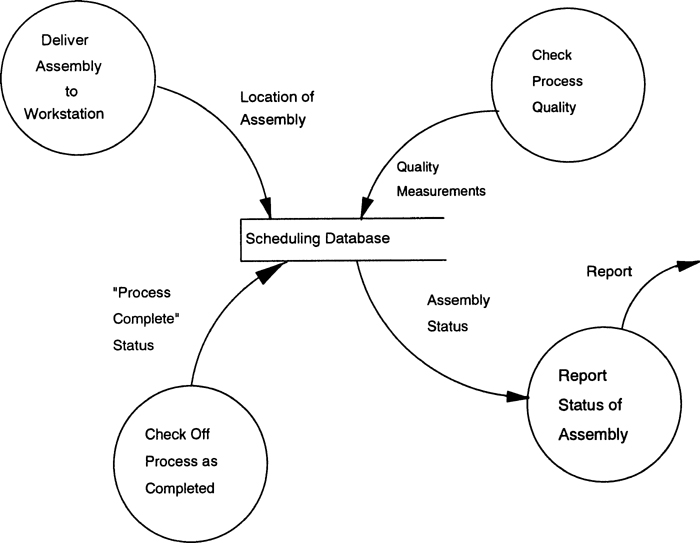
Figure 3-4 shows the same information as Figure 3-3, but this time as an IDEFO diagram.
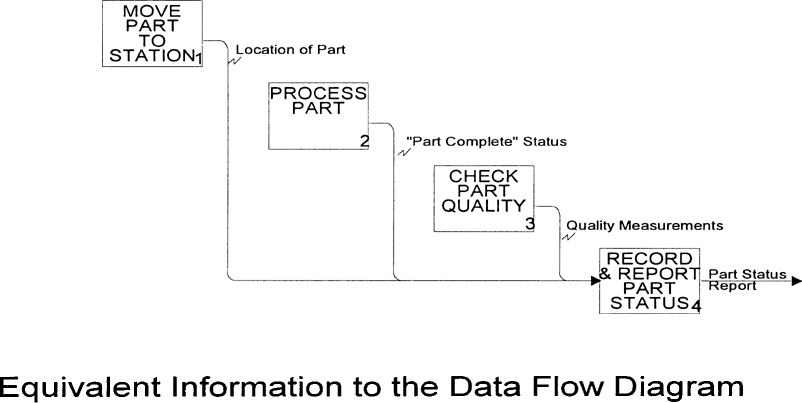
Note that the interfaces between the activity boxes in the IDEFO diagram are represented by arrows, depicting one activity supplying input to or controlling one or more other activities (as we shall see in Figures 3-5 through 3-7). Unlike the simpler data flow diagram, the interactivity relationship can include data flow, raw material flow, management and other forms of control, resources (such as people, machines, and computers), and whatever else must be included to model the complete enterprise’s operational details.
Figures 3-5 through 3-7 detail information that is not shown on the data flow diagram. Whereas a data flow diagram is adequate to depict information needed by a computer software program, it is not adequate for reengineering purposes, since there are other factors influencing an enterprise’s operations. These other factors must be included if the reengineering process is to be understood and designed, and the changeover process controlled. The IDEFO model shows what controls each activity and who performs it, as well as the resources needed by each activity.
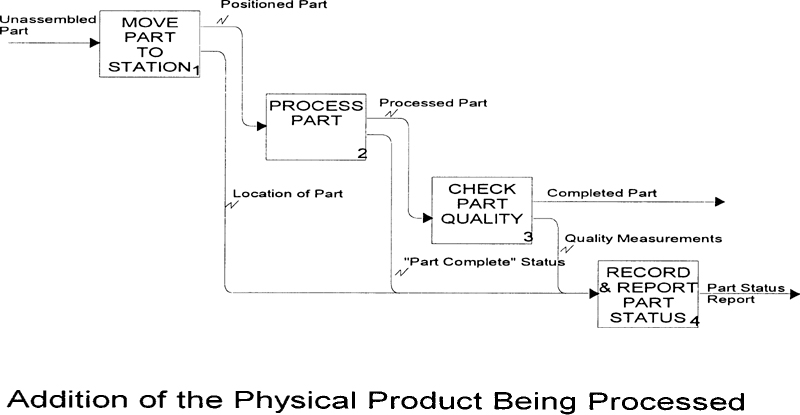
Figure 3-5 shows the addition of the physical part proceeding through the stages of manufacturing, from Unassembled Part entering box 1 to Completed Part leaving box 3.
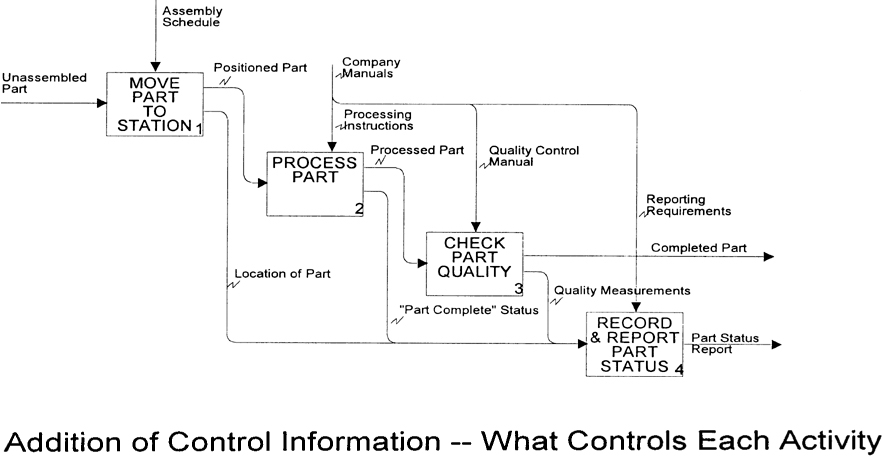
Figure 3-6 adds controls to each IDEFO activity box. For example, we see that there is an Assembly Schedule that controls when the part is prepared for processing. Company Manuals are used to control the remaining three activities. These controls must be carefully considered when making changes, and therefore are important to include in the reengineering effort.
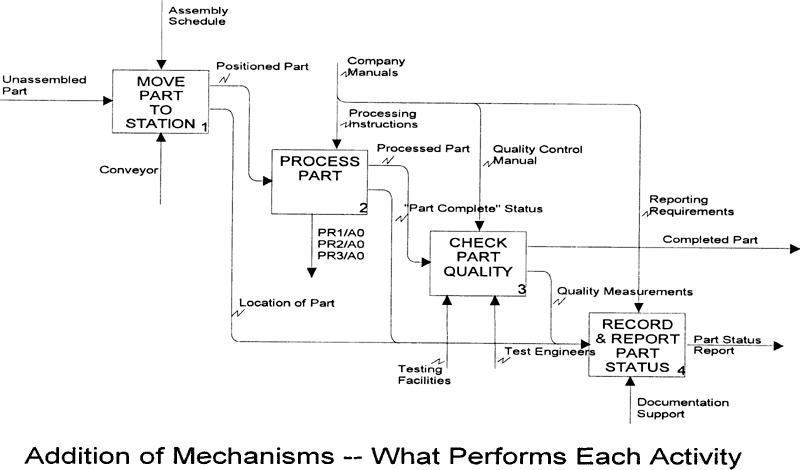
Finally, Figure 3-7 shows what mechanism performs each process. This includes people (for example, Test Engineers for box 3) as well as support tools and systems (for example, Testing Facilities for box 3). A common practice is to document the elements of the enterprise’s organization chart as mechanisms in the model in order to show the assignment of responsibility to specific organizational elements. In the TO-BE picture, the revised organizational responsibility is likewise shown.
An important difference between data flow diagrams and IDEFO diagrams is the scope of the topic covered: DFDs were intended to depict fine detail needed by a software design specification, whereas IDEFO diagrams were designed to capture very complex topics such as the operation of the aerospace industry, a government agency, or a business.
IDEFO syntax may be used to capture fine detail, as we have just shown in the series of diagrams comparing the information content of DFDs to IDEFO diagrams. However, many of the features of IDEFO have the objective of handling great complexity, not depicting fine detail. The purpose and viewpoint statements of an IDEFO model are examples of features that enable handling complexity.
While the purpose of a set of data flow diagrams is to depict the operation of computer software, the purpose of an IDEFO model may be one of many, since the modeling method is applicable to any “system” comprised of “things” and “happenings.” Focusing the analysis effort by purpose shortens the list of enterprise elements that must be modeled during a reengineering effort. In other words, the analyst must narrow the topic to be modeled and decrease complexity.
An IDEFO model must also select a specific viewpoint. If all viewpoints of an enterprise were to be included in a single model, the information would be too complex to understand.
Understanding a Top-Level IDEFO Diagram of an Enterprise
Figure 3-8 presents a typical top-level diagram in an IDEFO model (it originally appeared as Figure 2-9). This diagram might represent the most general level of detail of a model entitled “Run the Enterprise.”
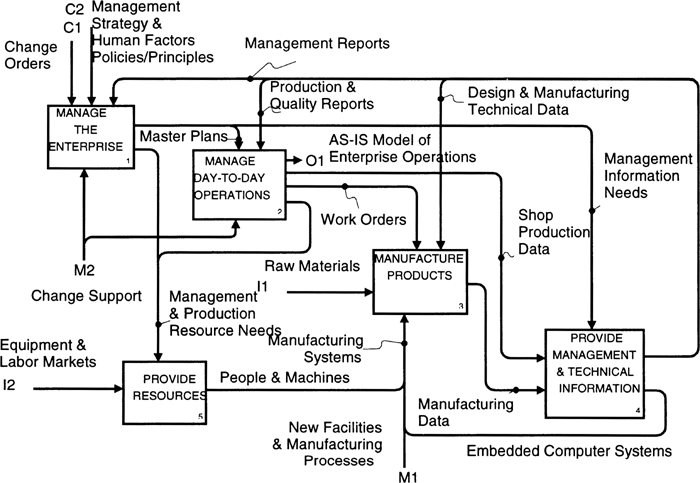
The figure shows the running of an enterprise, broken down into five major functions: 1) Manage the Enterprise; 2) Manage Day-to-Day Operations; 3) Manufacture Products; 4) Provide Management & Technical Information; and 5) Provide Resources. Four of these major functions are shown as boxes positioned in a stairstep fashion that makes the control and feedback loops between the functions simpler to draw. The fifth box (Provide Resources) is shown below the stairstep, since it is a support function that provides resources (people and machines) to be used by the other functions.
By reading the names in the boxes, anyone can get a quick idea of the breakdown of the subject Run the Enterprise, as well as the topics to be modeled in subsequent lower-level diagrams. For example, if the reader wishes to examine further detail regarding the provisioning of resources, he would isolate the diagram for box 5 and study that at a finer level of detail.
IDEFO graphics are undeniably straightforward and that quality is, in my view, one key to their success. Such elaborations as additional box shapes, dotted arrows, and formalisms for arrow branching structures have been experimented with by modelers since the inception of IDEFO. It seems only natural to conclude that such elaborations would provide additional expressive capabilities to the analyst.
However, I have learned to resist the temptation to elaborate the syntax, since this makes the graphics too complex to fulfill the essential role of the model to communicate. At the early stages of project planning, communication is the key element, and the simple graphics that are quickly learned and employed must remain a basic element of IDEFO.
Levels of Abstraction in IDEFO Models
As stated, the breakdown approach used in IDEFO modeling decomposes selected activities into finer and finer levels of detail. The resultant model set includes sufficient detail to plan and control the implementation of changes to the enterprise.
An IDEFO model may also contain multiple levels of abstraction. To understand what is meant by “level of abstraction,” let’s consider a typical enterprise. Each level of management has its natural level of abstraction. Top management must think in broad terms, taking into account many viewpoints as well as abstractions of the details of what is going on in the enterprise. An upper-level manager cannot possibly understand every detail of all of the activities in the entire enterprise, but he must abstract business processes and characteristics that are important at his level of abstraction. He must consider such things as overall profit, hiring policies, or the quality of the enterprise’s product line, rather than the specific factors that go into these high-level abstractions.
Conversely, a manager at a lower level needs fine-level detail about a specific topic from a single viewpoint, and he may get uneasy thinking in general terms. His level of abstraction is concerned with such things as the cost of raw materials, the capabilities of specific staff members, or the quality of the service for which he is responsible.
The model’s level of abstraction is independent of its level of detail. That is, after selecting a level of abstraction to model, the author may decompose the activities to whatever level of detail he requires to satisfy the purpose of the model. However, if the purpose of the model requires information at a different level of abstraction, no amount of further detailing at the present level of abstraction will provide the needed information. Modeling at all required levels of abstraction must be completed to satisfy the enterprise analysis requirements.
The IDEFO concept of a mechanism is different from the concept of level of abstraction. In IDEFO, a mechanism represents who performs the activity and what tools (software packages and equipment) are required to perform the activity. In other words, the mechanism identifies the resources needed to perform the function. A mechanism is therefore at a lower level of abstraction than the activity box it implements.
The fact that the mechanism depicts a lower level of abstraction does not mean that it cannot be modeled in IDEFO. It just means that the mechanism is shown as an arrow entering the bottom of the box, and that a separate model must be examined to understand how the mechanism works (see Figure 3-9).
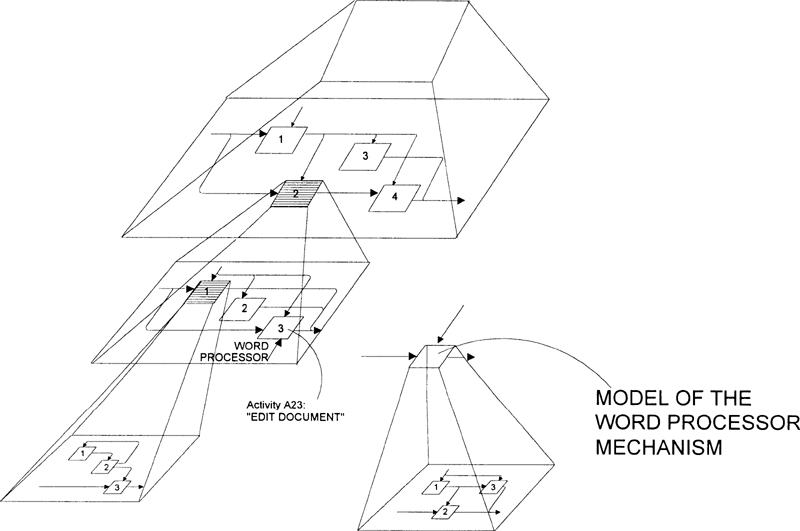
The IDEFO diagram in Figure 3-9 shows Activity A23 (Edit Document) using the word processor support mechanism. The IDEFO model for the word processor is shown at the lower-right corner of Figure 3-9. What this tells us is that any word processor mechanism may be modeled and plugged into the diagram to show the precise activity performed when editing a document with any variety of word processors. This shows how the editing is done using the mechanism, and therefore indicates that there is a drop in level of mechanization from what is done to the document by the EDIT activity.
To accomplish the reengineering of an enterprise, an analyst may need to show multiple levels of abstraction and several levels of mechanism, as well as how those are integrated to perform the processes of the enterprise. Showing all this provides a clear, accurate big picture of the overall operation of the enterprise.
In addition to an IDEFO process-oriented analysis, various additional analysis methods may be applied, using the IDEFO model as a baseline. For example, the analyst may need to know where costs and labor are being expended, in order to estimate the return on investment of potential changes or to understand the impact of introducing new technology. Various analyses, such as activity-based costing (ABC) and work flow simulation, are typically applied using the IDEFO model as a baseline.
The Role of Data Analysis Compared to IDEFO Function Analysis
Detail needed regarding the processes requires not only IDEFO process models, but also precise information about the arrow content. This requires a careful analysis of data.
An analyst may be confronted with a tidal wave of raw data when he first gathers information about an enterprise. He typically starts by finding out the precise meaning of the terms that are key to the system’s operation; then he documents these definitions. Once he has done that, he has a solid basis for initiating discussion with the staff about the detailed operation of the system. But even before analyzing the system in detail, he must consider the system functions and their interactions to understand the need, the purpose, and the objective of the relevant data.
Not all analysts take this view. In fact, some prominent leaders in the database community have stated that there is no need to look at the functions and activities at all. One database proponent wrote that the development of a function model actually gets in the way of the programmer and should be avoided if possible, further proclaiming his First Rule of CASE: “Only one diagramming method is needed—the data model—and code can be generated automatically from a data model.”1
1 Clive Finkelstein, An Introduction to Information Engineering: From Strategic Planning to Information Systems (Reading, Mass.: Addison-Wesley, 1989), p. 376.
This statement is true if the automated system to be built performs simple, well-known processes such as basic banking transactions (for example, put money in checking account, withdraw money from checking account, transfer money to savings account, and so on). These activities are so familiar that an IDEFO model would not be helpful, and design of the data structure of the system can be started almost immediately. The statement is not true, however, if the software to be built has a complex processing aspect, such as that for an avionics system or a computer’s operating system.
The field of automated programming would also lead one to believe that analysis, design, and programming are outmoded—as if the system will do all this for you and produce a running computer program. However, the type of system that is implied here is one that simply queries a database and displays answers on a screen. Automatic programming has a long way to go before it can build an avionics system, a computer operating system, or a compiler. And haven’t we slipped into the solution domain? Automated programming tools are of no help if you are trying to reengineer a business operation and have not yet understood what the system will look like.
Regardless of the system to be analyzed and the comparative importance of the data versus the activity analysis, at some point the data must be analyzed. To perform this portion of the analysis, the analyst must understand several important characteristics of the data.
Although there are many data characteristics that could be analyzed, two are critical: data dynamics and data structure. Data dynamics can be depicted by SADT data models, using a portion of SADT that was not adopted by the Air Force for IDEFO. Data structure may be modeled using IDEF1X, where the term “structure” signifies all non-dynamic data information, such as its attributes and its relationship to other data elements.
A type of function model, the SADT data model shows the breakdown of the kinds of data in the system, with arrows indicating which activities produce which data elements and which activities use the data for what purpose. This gives a dynamic picture of the data being created, used, and merged with other data to form new data entities. The SADT data model is a natural companion for an IDEFO or SADT activity model, and it is useful for analyzing how the system manipulates data and what is affected when changes are implemented. It also provides a validation of the activity model. In fact, most data models developed using SADT result in corrections to the activity model!
The IDEF1X model provides all of the structural information about the data. Ultimately, relating the need for and the usage of specific attributes of data by the activity boxes of an IDEFO model is the key to integrating the two models.