In This Chapter
Sorting groups by performance rather than by name
Selecting by percentage
Sorting groups in reverse
Troubleshooting problems with group sorts
An old saying in the sales business is that you get 80 percent of your sales from 20 percent of your customers. It's called the Pareto Principle, or the 80/20 rule, and it's not restricted to sales. When doing the same work, some people or things are more productive than others. If you identify the most productive salespeople, machinery, or whatever, you can analyze the factors that make them so effective and perhaps apply what you learn to increase productivity overall.
In Chapter 6, I cover how to sort records and group them. A valuable extension of these capabilities is producing a report that shows only the top producers. In this chapter, you find out how to do just that.
In Chapter 6, I discuss the creation of a report for Xtreme Mountain Bikes that shows the dollar totals of individual sales orders, sorts the orders by customer name, groups records by state, and sorts the groups by state. That report, however, isn't very helpful to the Vice President of Sales, who is trying to get a feel for which customers are buying the most.
Adding drill-down capability to the report (as you can see in Chapter 6) shows which states are responsible for the most sales (on a percentage basis) but doesn't show which customers are the best. To get the information you want, in the form that's easiest to understand, a Top N report is probably your best choice. If you're interested in finding out more about your top five customers, then N equals 5. If you want to know about the top ten, then N equals 10.
To build a Top N Report, follow these steps:
Select Report Wizard from the list of options on the Start Page.
A blank report appears on the workspace, and Database Expert gives you the opportunity to connect to a data source.
Connect to the
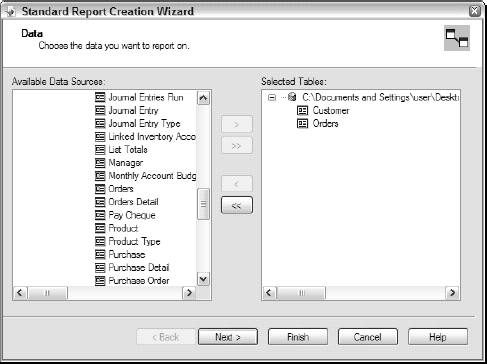
xtreme.mdbdatabase, and then select the Customer and Orders tables, as shown in Figure 9-1.Tip
If Steps 1 and 2 are Γρεεκ (Greek) to you, hop to Chapters 2 and 4 for how to do these basic tasks.
Click Next to display Link view.
You see the Customer table connected to the Orders table by the Customer ID field.
Click Next to display Fields view.
Move Customer Name, Region, and Order Amount to the Fields to Display pane.
Click Next to display Grouping view.
The Vice President of Sales wants to list the five top U.S. customers, along with their states and the total amount of their orders. The easy way to do this is to group the records by Customer ID, hide order detail, sort by the sum of the order amount for each customer, and include the top five customers in the report.
Move Customer.Customer Name to the Group By pane and specify descending order.
This puts the customer with the highest total first.
Click Next to display Summaries view.
In the Summarized Fields pane, Crystal Reports infers that you want to summarize Sum of Orders.Order Amount. It is the only field of the three that you specified as numeric. It also infers that the specific type of summary you want is a Sum.
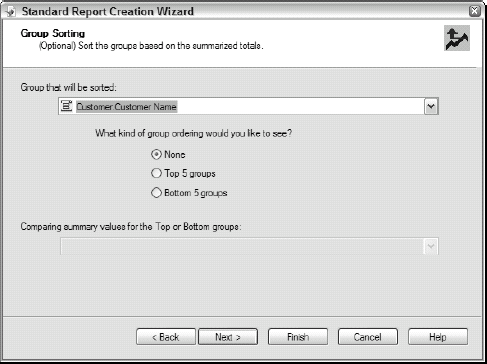
Click Next to display Group Sorting view, which is shown in Figure 9-2.
Select the Top 5 Groups radio button.
In the Comparing Summary Values for the Top or Bottom Groups pull-down list, Crystal Reports has selected Sum of Orders.Order Amount for you.
Click Next to display Chart view, and then click Next again to display Record Selection view.
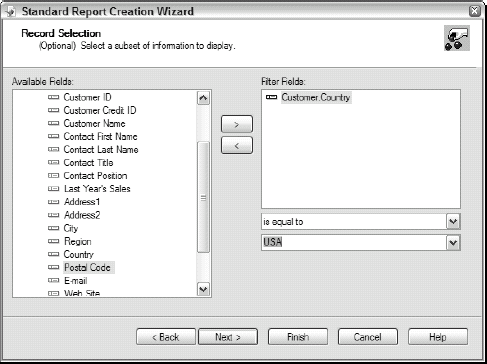
You're interested in only U.S. sales at present. Move Customer.Country from the Available Fields pane to the Filter Fields pane. In the drop-down menus below the Filter Fields pane, select is equal to and USA.
Figure 9-3 shows Record Selection view filled out.
Click Next to display Template view.
Select a template for the report.
To follow along with the example, select the Block (Blue) template. (I cover templates in Chapter 8.)
Click Finish.
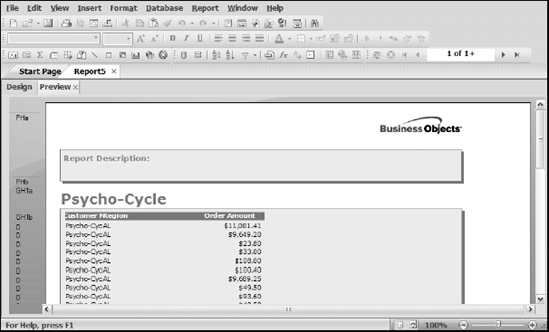
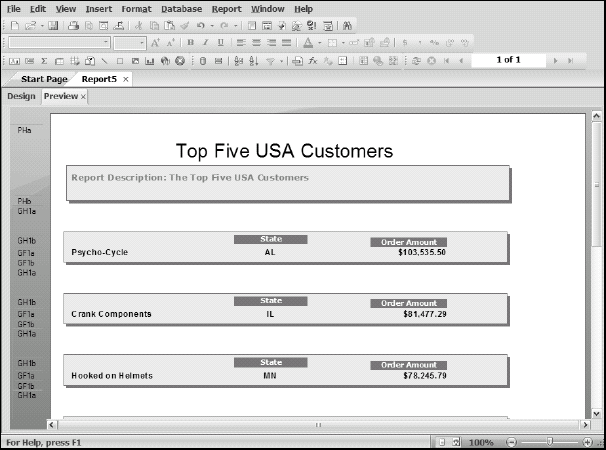
Crystal Reports builds your report and it appears onscreen, as shown in Figure 9-4.
It's not exactly what the Vice President of Sales had in mind. You need to make the following adjustments:
Delete the Business Objects logo, which appears at the top of every page.
Give the report a title.
Change the Region column heading to State, and center the state data under it.
Space the columns horizontally.
Delete the repeated customer name entries in the detail lines.
Hide the individual entries for each order.
Display the sum of the orders for each displayed customer.
To make the needed adjustments, follow these steps:
Switch to Design mode.
Right-click the Business Objects logo in the page header and choose Cut from the contextual menu that appears.
In the Page Header section PHa, an area has been set aside for the report title. If you're wondering about PHa: In this template, the Page Header is subdivided into two sections, labeled PHa and PHb.
Drop a text box onto the report title area in the page header.
Type Top Five USA Customers inside the newly placed text field.
Center the text and increase its font size to 22 to make the heading easier to read.
In the Report Description text object, after the words Report Description, type The Top Five USA Customers. Expand the text box to the right to accommodate the entire description.
Things are going well.
Change the Region column heading to State and center the two-character state abbreviations below it.
Make the change to the column heading in group header GHb. To center the state abbreviation, click the Region field in the Details section, and then click the Align Center icon on the Formatting toolbar.
Spread out the group headers and details columns for State and Order Amount on the page, while eliminating the Customer Name column.
Because the customer name appears in the group header, you don't need to repeat it in the Details area.
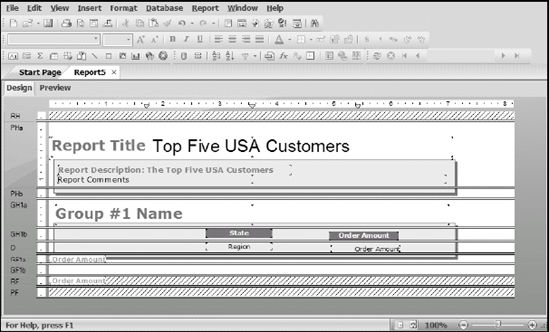
At this point, the report looks like Figure 9-5.
The next thing to do is display a group total in the Group Footer section:
Pull down the lower boundary of the shaded rectangle drawing object from GF1a (Group Footer) to GF1b.
This enables you to put a group sum into the GF1a space. Note the grayed-out field at the left edge of the GF1a section. This is the sum field for the group named Sum of Orders.Order Amount. It is grayed out because it is currently suppressed.
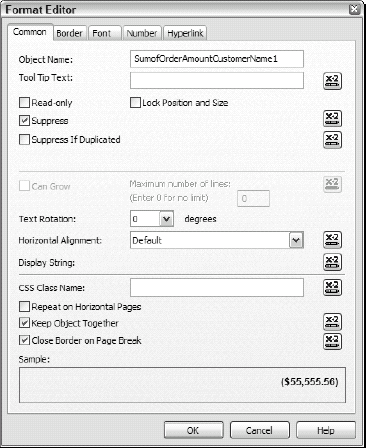
Right-click the Sum of Orders.Order Amount field in GF1a. From the contextual menu that opens, choose Format Field.
The Format Editor dialog box appears, with the Number tab selected.
Click the Common tab (see Figure 9-6).
Clear the Suppress option (uncheck it) and then click OK.
The Sum of Orders.Order Amount field is fully visible.
Move the Sum of Orders.Order Amount field to the right so that it lines up directly beneath the Order Amount column.
Switch to Preview mode.
Crystal Reports displays the Sum field in the appropriate place in the GF1a section, below the Order Amount heading.
The next thing you might want to do to produce a summary report for a top executive is to hide all the detail lines:
Right-click the area to the right of the Details section and choose Hide (Drill-Down OK).
The report now looks like Figure 9-7. This is still not quite what you want. The customer name is bigger and bolder than it needs to be for a one-line entry. The state information has been hidden, and you still have only one customer per page. These defects are easy to correct.
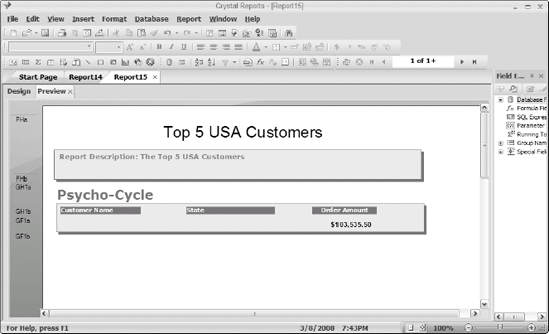
Figure 9-7. Report with details hidden.

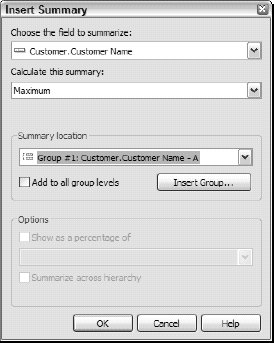
The Insert Summary dialog box appears.
Make the selections shown in Figure 9-8.
These selections are as follows:
Summarize the Customer.Customer Name field.
Use the Maximum summary operator.
Choose Group #1 for the summary location.
Crystal Reports automatically places the Customer Name field in the appropriate place in the GF1a section, below the Customer Name heading. You might have to move the summary to line it up with the template and with the numerical sum on the right side of the report.
Repeat Step 3 for the Customer.Region field to insert it below the State heading.
With the Region still selected, click the Align Center icon to center the state abbreviation below the State heading.
Delete the Customer.Customer Name field from GH1a.
This leaves each group with all the information you want and none of the extra stuff you don't want to display.
Now all you have to do is remove the page breaks between groups. The page breaks were set by a formula in the Group Footer #1 specification. To delete the formula, follow these steps:
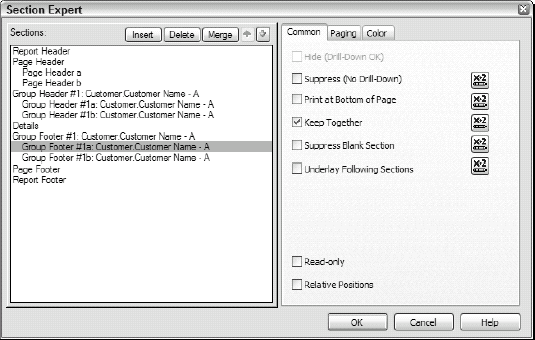
Right-click the area to the left of the GF1a section and choose Section Expert.
From the context menu, choose Section Expert. The Section Expert dialog box appears, as shown in Figure 9-9. Group Footer #1a is selected.
Move the Group Footer #1a selection up one row to Group Footer #1, and switch to the Paging tab in the pane on the right.
Note that for the Group Footer #1 section, the New Page After check box is selected. A color change in the formula icon for that selection indicates that this action is controlled by a formula. Blue has turned to red.

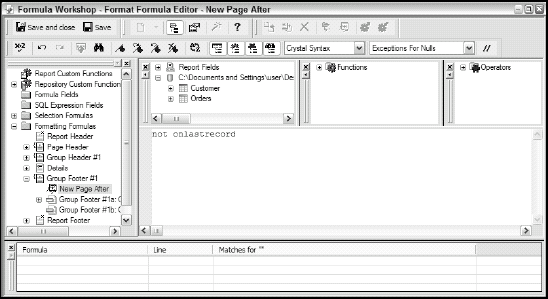
Format Formula Editor appears, as shown in Figure 9-10.
Delete the
not onlastrecordformula (in the formula area).Deleting this formula just keeps things clean and tidy. It has no effect after Step 6.
Click the Save and Close icon.
Back in Section Expert, clear the New Page After check box and then click OK.
This gives you the five top customers, their states, and the amount each has purchased, as shown in Figure 9-11.
Save this report as
Top5USAfinal.rpt.
Summary fields do more than just compute sums
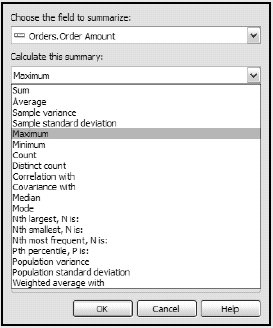
Crystal Reports offers a number of different sum-marizations in addition to simple sums such as the one I discuss here. When you click the Summarization icon (the capital sigma, Σ), the Insert Summary dialog box appears, as shown in the following figure. Available summary functions appear in the pull-down list, some of which you might want to use, depending on your application.
For numeric fields, the summary options are as follows: Sum; Average; Sample Variance; Sample Standard Deviation; Maximum; Minimum; Count; Distinct Count; Correlation With; Covariance With; Median; Mode; Nth Largest; Nth Smallest; Nth Most Frequent; Pth Percentile; Population Variance; Population Standard Deviation; and Weighted Average With.
For text fields, you choose from a smaller range of possibilities: Maximum; Minimum; Count; Distinct Count; Mode; Nth Largest; Nth Smallest; Nth Most Frequent.
These choices give you just about any type of marizations in addition to simple sums such as summary you'd ever want.
These choices give you just about any type of summary you'd ever want.
Sometimes it's more helpful to know who is responsible for the largest percentage of an organization's total sales rather than the specific dollar amount. The Group Sorting screen of the Standard Report Creation Wizard handles summaries expressed as percentages as well as straight numbers. You could build a report from scratch (similar to the one in the preceding section) by following most of the same steps, with just a slight difference at the summarization step.
Rather than going through all that again here, though, just modify the completed report (refer to Figure 9-11) to display percentages rather than group totals. Just follow these steps:
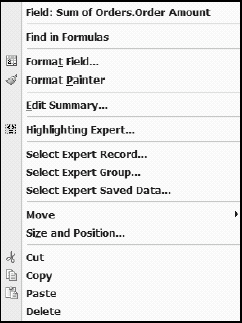
In Design mode, right-click the Sum of Orders.Order Amount field in the Group Footer #1a section.
The menu shown in Figure 9-12 appears.
Choose Edit Summary.
The Edit Summary dialog box appears.
Select the Orders.Order Amount field to summarize; calculate the Sum summary, and select the box to the left of Show as a Percentage Of.
The drop-down list below the Show as Percentage Of line holds the value you want (Grand Total: Sum of Order Amount).
Click OK.
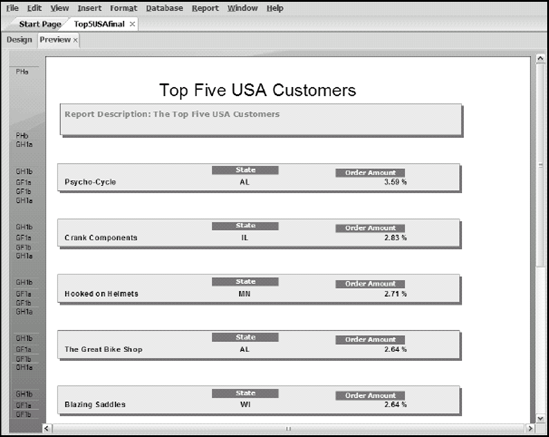
Now when you switch to Preview mode, you see the report shown in Figure 9-13. The five top customers are listed along with their percentage of Xtreme's total sales. This report tells you something that you didn't get from the previous report: The top five customers combined, account for less than 15 percent of Xtreme's orders. Looks like Xtreme is in the healthy position of not depending too much on a small number of customers. Sales volume is distributed over a large customer base.
The group sort used here to produce the latest reports happened to ask for the top five customers. Okay, that's suspiciously convenient; the Standard Report Creation Wizard gives you the option of selecting the top 5 or bottom 5 — but not the top 10, top 17, and so on. If you want your report to return some number of groups other than five, use Group Sort Expert.
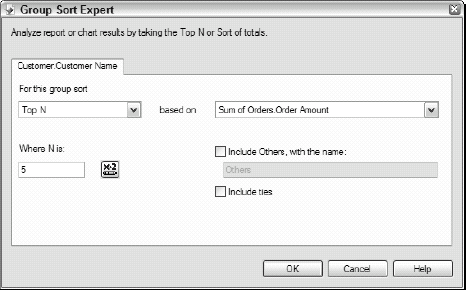
The default values for the current report are shown. The type of sort is Top N, based on Sum of Orders.Order Amount, where N is 5. If you want to see the percentage sales of the top 17 customers instead of the top 5, just replace the 5 with a 17 in the Where N Is field, and then click OK. The only task that remains to make this a complete report is to change the references to Five in the page header to Seventeen. Figure 9-15 shows the result.
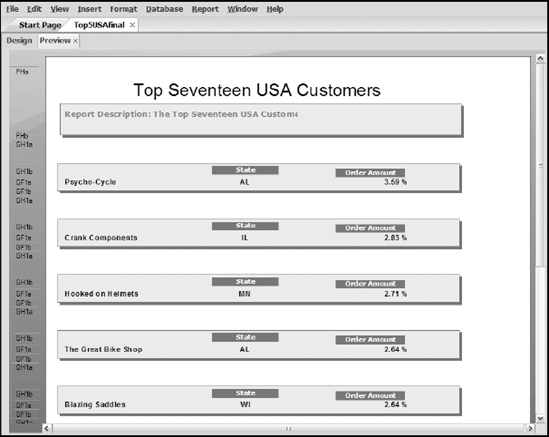
Hmmm. Maybe you're not finished after all. Now the report extends over two pages, and it seems redundant to repeat column headings above each customer line. Also, the space between records is excessive. You can tighten up the report as follows:
In Design mode, right-click the area to the left of PHb (page header) and choose Insert Section Below from the contextual menu that appears.
One way to tighten up your report is to move the column headings from the Group Heading section to the Page Heading section. This means you have to expand the Page Heading section by adding a new subsection —in this case, PHc.
Drag the column headings up from GH1b to PHc, placing them at the top of the PHc space.
Drag the bottom of the section up to the bottom of the column headings.
Drag the bottom of the shaded box Drawing Object (that provides the background color) down into the Page Footer section.
Drag the top of the box down to the bottom of the GHb section.
Right-click the area to the left of Group Header a to display a contextual menu, and then use it to suppress GHa.
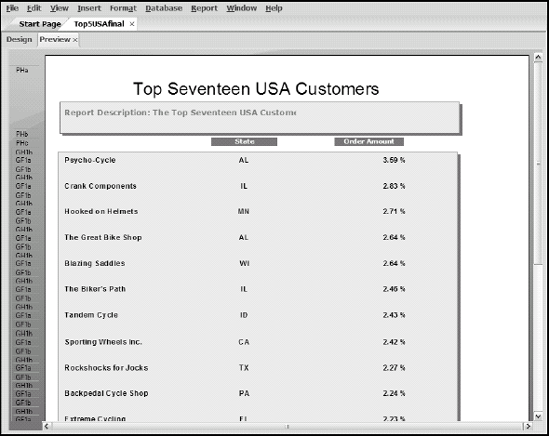
This eliminates GHa, which is doing nothing but taking up space. At this point, the report looks like Figure 9-16.
Save the report as
Top17USA.
If you've read this chapter to this point, you can probably guess (from what you have seen so far) that everything you can do for the top performers, you can also do for the bottom performers. Take a closer look at the Group Sort Expert dialog box. Figure 9-17 shows it with the group sort list pulled down. The options on this menu are No Sort, All, Top N, Bottom N, Top Percentage, and Bottom Percentage.
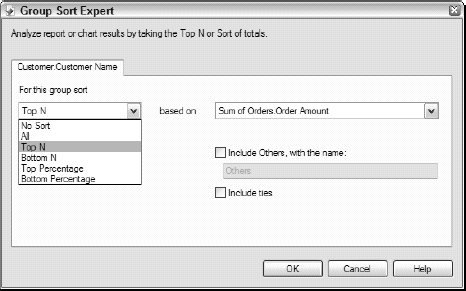
I explain earlier what choosing Top N does. Choosing Bottom N does the same thing, just for the tail-enders rather than the leaders. The other four options require a little explanation.
No Sort: Using the No Sort option does what it says: nothing. It leaves the lines of the report in the order in which the corresponding groups appear in the database. You might wonder why this option even exists. Maybe you want to build a new report based on an existing one, but the existing report is sorted. If you want your new report to reflect the order of the records in the database rather than the sort order of the old report, one way to get what you want is to use the No Sort option.
All: Using the All option sorts and displays all the groups, not restricting the display to any given number. A report built according to this option contains all the data of a Top N report, plus all the data of a Bottom N report, plus data on all the groups not included in either of those.
Top Percentage: When using a Top Percentage group sort, you specify the top percentage that you want to see in the report. For example, if you want to see whether the 80/20 rule applies to your organization, specify a Top Percentage group sort, and enter 80 in the Where Percentage Is box. For example, if you have 90 customers, the 80/20 rule holds if the report lists about 18 customers (representing 20 percent of the total).
Bottom Percentage: To report on the customers who order the least amount of product, use the Bottom Percentage group sort. For Xtreme Mountain Bikes, the companies in this report need help or should be replaced by companies that can do a better job.
Because Group Sort Expert walks you through the process of sorting and summarizing group data, there aren't many ways for you to get into trouble. However, here are a few things to keep in mind when adding group-sort capability to a report:
You can't perform a Top N, a Bottom N, or other type of group sort unless your report contains a summary value. If you have trouble creating a Top N or a Bottom N report, make sure that the sort is based on a summary value.
Creating a subtotal for a group might not work if the report data is drawn from tables linked in a one-to-many relationship. For such a case, you might have to use a running total instead of a subtotal. If you're not getting the summary values you want and your report is drawing data from multiple tables, check whether the tables have a one-to-many relationship. If such a relationship exists, try using a running total rather than a subtotal for each group. (Chapter 6 explains the use of running totals.)
What's a one-to-many relationship, you ask? It's a relationship between two database tables where one record in the first table corresponds to multiple records in the second table. For example, the relationship between the CUSTOMER table and the ORDERS table is one to many. One customer can make multiple orders, but each order is made by one and only one customer.
Watch out for invisible objects. Sometimes, you'll want to shrink the size of a section by dragging up its lower boundary. If you find that the section will shrink only so much and no more, an invisible object might be in the section. You can't shrink a section past the border of an object that the section contains, even if you can't see the object. Check carefully to see whether the border of a drawing object or an empty text object is hidden under the boundary line that you're trying to drag up. When you drag your mouse over a hidden object, its border line appears. This is your clue that the object exists. Once you know it is there, you can delete it.