
THE DEBUG ⇒ WINDOWS SUBMENU
The Debug menu’s Windows submenu contains commands that display debugging-related windows. The following list briefly describes the most useful of these commands. The sections that follow this one provide more detail about the Breakpoints, Command, and Immediate windows.
- Immediate — This command displays the Immediate window, where you can type and execute ad hoc Visual Basic statements. The section “The Command and Immediate Windows” later in this chapter describes this window in a bit more detail.
- Locals — This command displays the Locals window, which displays the values of variables defined in the local context. To change a value, click it and enter the new value. Click the plus and minus signs to the left of a value to expand or collapse it. Note that a value may be an object, so you may be able to expand it further.
- Breakpoints — This command displays the Breakpoints window shown in Figure 6-2. This dialog box shows the solution’s breakpoints, their locations, and their conditions. Select or clear the check boxes on the left to enable or disable breakpoints. Right-click a breakpoint to delete it or to edit its location, condition, hit count, action, and other properties.
FIGURE 6-2: The Breakpoints window helps you manage breakpoints.
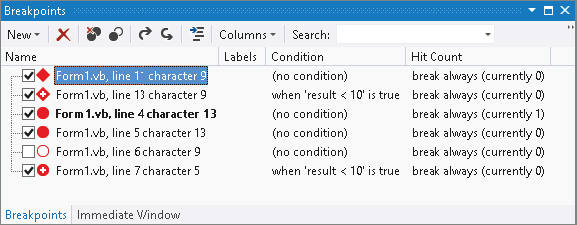 Use the dialog box’s toolbar to create a new function breakpoint, delete a breakpoint, delete all breakpoints, enable or disable all breakpoints, go to a breakpoint’s source code, and change the columns displayed by the dialog box. See the section “The Breakpoints Window” later in this chapter for more detail.
 - Output — This command displays the Output window, which displays output produced by Debug and Trace statements.
- Autos — This command displays the Autos window, which displays the values of local and global variables used in the current line of code and in the previous line.
- Call Stack — This command displays the Call Stack window, which lists the routines that have called other routines to reach the program’s current point of execution. Double-click a line to jump to the corresponding code in the program’s call stack. This technique lets you move up the call stack to examine the code that called the routines that are running.
- Threads — This command displays the Threads window. A thread is a separate execution path that is running within a program. A multi-threaded application can have several threads running to perform more than one task at the same time. The Threads window lets you control the threads’ priority and suspended status.
- Parallel Tasks — This command lists all of the application’s running tasks. This is useful for debugging parallel applications.
- Parallel Stacks — This command shows the call stacks for tasks running in parallel.
- Watch — The Watch submenu contains the commands Watch 1, Watch 2, Watch 3, and Watch 4. These commands display four different watch windows that let you easily keep track of variable values. You can use each window to keep track of different sets of related variables. When you create a watch using the Debug menu’s QuickWatch command described earlier, the new watch is placed in the Watch 1 window. You can click and drag watches from one watch window to another to make a copy of the watch in the second window.
You can also click the Name column in the empty line at the bottom of a watch window and enter an expression to watch.
WONDERFUL WATCHESA useful IDE trick is to drag Watch windows 2, 3, and 4 onto Watch 1 so that they all become tabs on the same window. Then you can easily use the tabs to group and examine four sets of watches.
- Modules — This command displays the Modules window, which displays information about the DLL and EXE files used by the program. It shows each module’s filename and path. It indicates whether the module is optimized, whether it is your code (rather than an installed library), and whether debugging symbols are loaded. The window shows each module’s load order (lower-numbered modules are loaded first), version, and timestamp. Click a column to sort the modules by that column.
- Processes — This window lists processes that are attached to the Visual Studio session. This includes any programs launched by Visual Studio and processes that you attached to using the Debug menu’s Attach to Process command.
Usually, when these debug windows are visible at run time, they occupy separate tabs in the same area at the bottom of the IDE. That lets you switch between them quickly and easily without them taking up too much space.
..................Content has been hidden....................
You can't read the all page of ebook, please click here login for view all page.