Chapter 14
Building Customized Reports
In This Chapter
![]() Controlling the appearance of the Report List window
Controlling the appearance of the Report List window
![]() Saving two versions of the same report
Saving two versions of the same report
![]() Creating a new report
Creating a new report
Timeslips contains more than 100 standard reports, and in all likelihood, the report you need already exists. But in a few cases, you might want to customize a report.
For example, you might want to edit the titles of the tabs that group reports in the Report List window to make the titles more meaningful to you or to move a report from one tab to another.
Or you might find that you really want two versions of the same report because you print the report regularly using two different sets of report options. Or it’s entirely possible that the report you want isn’t one of the standard reports.
In this chapter, you explore ways to handle each of these situations.
Modifying the Report List Window
You can rename and reorder the group tabs in the Report List window. In addition, if you think a report belongs more logically in a different report group, you can move the report to that group.
To rename or reorder the group tabs in the Report List window, follow these steps:
- Choose Reports and then click any report group.
The Report List window appears.
- Click the Edit Groups button (third from the bottom) on the vertical toolbar.
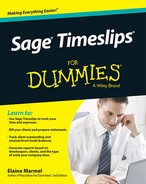
Timeslips displays the Edit Groups dialog box shown in Figure 14-1.
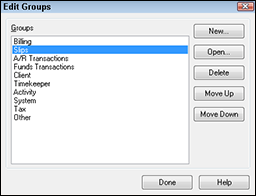
Figure 14-1: Rename or reorder the tabs in the Report List window.
- To rename a group’s tab, click the group and then click Open. In the dialog box that appears, type a new name and click OK.
- To reorder the group tabs, click a group and then click the Move Up or Move Down button.
- When you finish, click the Done button.
To move a report from one group to another, you use the report’s Save dialog box, shown in Figure 14-2. To display this dialog box, double-click the report in the Report List window. Then, in the Report Entry window that appears, click the Save (disc) button on the vertical toolbar.
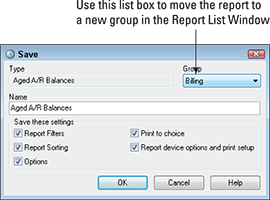
Figure 14-2: Moving a report from one group tab to another.
To move the report from its current report group tab in the Report List window to another group, open the Group drop-down list and select a different group for the report. Then click OK. When you redisplay the Report List window, Timeslips displays the report on the tab of group you selected.
Duplicating a Standard Report
You might find that you like to produce a particular report but you tend to switch between two versions of the report, changing report-specific options to suit your needs. For example, suppose that you want to print the standard version of the Aged A/R Balances report shown in Figure 14-3. However, at other times, you want to set the report’s options to include additional information so that you can use it as a collections report, as shown in Figure 14-4.
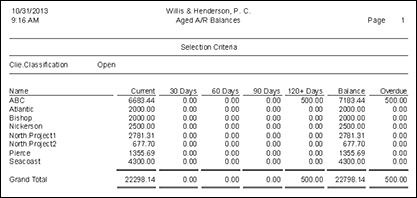
Figure 14-3: A standard aged receivables report, with options set to display the newest balances before older balances.
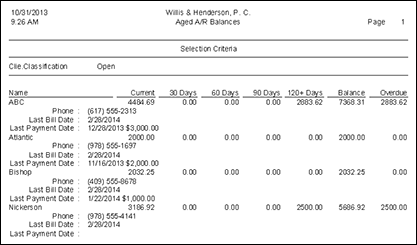
Figure 14-4: An aged receivables report that includes each client’s last bill date, last payment date, and phone number.
In this situation, it would be useful to have two versions of the report available — one with settings for a standard aged receivables report and another you can use as a collections report. The easiest way to establish two copies is to duplicate the report, set up the settings you want to use for one version, and then save the report with a different name.
 You can use the Find a Report wizard to create another copy of a standard report, but my clients find that the duplicate method is faster and easier.
To duplicate a report, follow these steps:
- Choose Reports and then click the group containing the report you want to duplicate.
- Double-click the report to display its Report Entry window.
- Click the Duplicate Report button (second button from the bottom on the vertical toolbar).
Timeslips adds the word (Copy) to the report’s title, as shown in Figure 14-5.
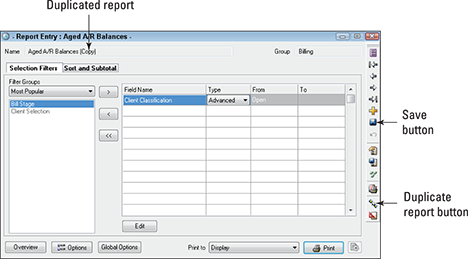
Figure 14-5: A duplicated report.
- Click the Options button below the Filter Groups list.
Timeslips displays the report’s Report Options dialog box.
- Set whatever options you want Timeslips to use when producing this section version of the report and click OK.
Timeslips redisplays the report’s Report Entry window.
- Click the Save (disc) button on the vertical toolbar.
Timeslips displays the Save dialog box (see Figure 14-6).
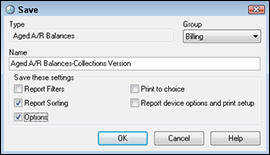
Figure 14-6: Save the report’s settings and change its name.
- In the Name text box, provide a meaningful name for the report.
- Deselect any settings you don’t want to save.
- (Optional) Use the Group drop-down list to select a tab on which the report should appear in the Report List window.
- Click OK.
Timeslips saves the report and its settings on the Report List group tab you select.
Creating a New Report
Although Timeslips contains over 100 standard reports, it's possible that you need to create a new report. For example, suppose that you added a client custom field (see Chapter 16) to manage billing cycles for your clients, and you’d like a report that shows you each client’s nickname and billing cycle. You can use the Create a Report Wizard to create this report:
- Reports⇒Create a Report.
Timeslips displays the first screen of the Create a Report Wizard.
- Click the Create a Completely New User-Defined Report option.
- Click Next.
- Click the type of data you want to include on the report, and then select a style for the report.
For this example, choose Client for the type of data and Detail Listing for the Style.
You can click each type of data and each report style to see a description of the option. You also can click the Learn More link to display the associated Help topic, and you can click the View Full Example link to open the Sample Reports document to the page that describes the data and style you select.
 You can create a detail or summary listing report, a graph report, a label report, or an envelope report. The type of data you select determines the style of report you can create.
 - Click Next.
- Select a starting template.
In most cases, and for this example, choose the Empty Report template.
- Click Next.
- Supply a name for the report, and select a group tab for the report to specify where you want the report to appear in the Report List window.
For this example, name the report Client Bill Cycle Listing and place it on the Client group tab.
- Click Next.
- Click the Open Report Designer button to set up the report.
Timeslips displays the Design tab of the Print Preview window for your new report.
Understanding the Design tab
The Design tab of the Print Preview window for any report is divided into sections. To view the sections that you can customize, open the Go to Section drop-down list. On most standard reports, you can customize the header and footer sections; on custom reports, you also can customize the details.
Use the Field Group list on the right side of the window to find the fields you want to add to the report. To add them, simply drag them onto the report. By default, when you add a field, Timeslips automatically adds a column heading for the field.
Adding fields to the report
In Figure 14-7, I added Nickname 1 and the Billing Cycle field. To add these fields, I opened the Field Group drop-down list and selected Client Contact Info to find Nickname 1 and drag it onto the report layout. Then I reopened the Field Group list and selected Client Custom to find and drag the Bill Cycle custom field onto the layout beside the Nickname 1 field.
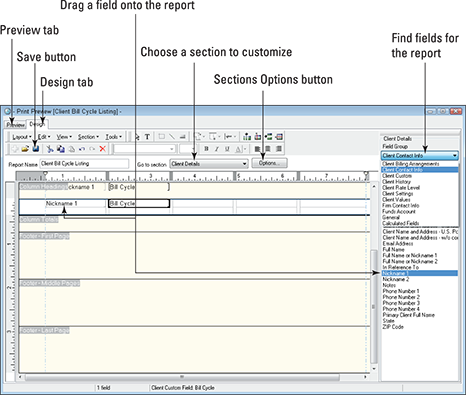
Figure 14-7: Setting up a custom report.
Click the Preview tab to view the customized report (see Figure 14-8).
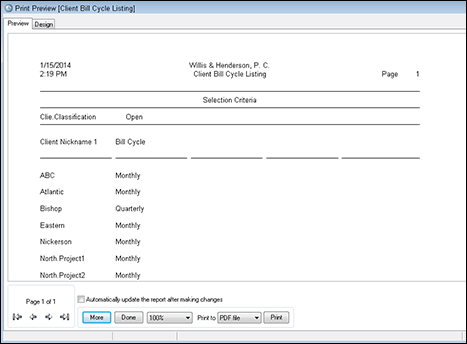
Figure 14-8: A preview of the report.
Removing spare rows
Click the Design tab again to continue customizing. In the example in Figure 14-8, the underscore for the column headings appears below a blank row. And my report appears double-spaced, which will use up more paper than I’d like.
To solve the underscore problem, use the Go to Section drop-down list to select Column Headings so that you can modify the column headings. Right-click the blank line that appears below the Nickname 1 heading and select Delete⇒Row from the shortcut menu. Timeslips deletes the blank row.
To solve the double-spacing issue in the body of the report, follow the same steps after selecting Client Details from the Go to Section drop-down list.
When you preview the report again, the extra blank rows are gone. However, you might see underscores in the report’s column headings row for columns 3, 4, and 5, even though no column headings appear.
Removing spare columns
To remove spare columns from the report, switch once again to the Design tab and select Column Headings from the Go to Section drop-down list. Then click the Options button beside the Go to Section drop-down list to display the Layout Options for Reports dialog box shown in Figure 14-9.

Figure 14-9: Remove columns from the report.
By default, Timeslips sets up five columns for your report, but this report needs only two columns. Remove the X that appears below columns 3, 4, and 5 (scroll to the right to find columns 4 and 5) and then click OK. When you preview the report again, the underscores for columns 3, 4, and 5 no longer appear (see Figure 14-10).
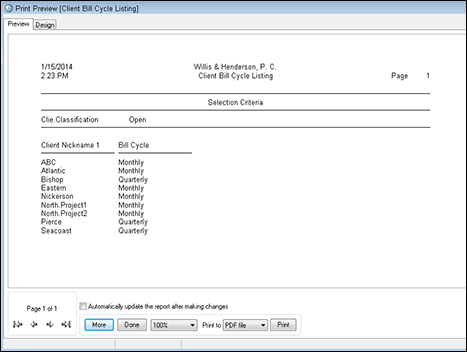
Figure 14-10: The completed report.
Click the Design tab one more time so that you can save your customized report. On the toolbar at the top of the Design tab, click the Save button. Timeslips displays the Save dialog box (refer to Figure 14-6). Click OK to save your customized report. When designing a custom report, save the filter settings along with all the other settings. Then click the X in the upper-right corner of the Print Preview window to close the window.