
Effect of Dust Contamination on Electrical Contacts
Fear no more, William Shakespeare
CONTENTS
4.1.2 The Importance of the Dust Problem
4.1.3 The Complexity of the Problem
4.1.4 The Purpose of the Studies
4.2 Dusty Environment and Dust Composition
4.2.2 The Collection of the Dust Particles for Testing
4.2.3 The Shape of the Dust Particles
4.2.4 The Identification of the Inorganic Materials
4.2.5 The Organic Materials in Dust
4.2.6 The Water Soluble Salts in Dust
4.3 The Characteristics of Dust Particles
4.3.1.1 Measurement of the Electric Charge
4.3.1.2 The Electrostatic Attracting Force on the Particle
4.3.2.2 For Stationary Contacts
4.3.2.4 The Effect of Lubricants Coated on Contact Surface
4.3.2.5 Sliding Contacts on Lubricated and Dusty Contacts
4.3.2.6 Fretting (Micro Motion) on Lubricated and Dusty Contacts
4.3.3.1 Dust Particles Create Pores
4.3.3.2 Corrosion Appears as a Result of Dusty Water Solutions
4.3.3.3 Indoor Exposure Results
4.3.3.4 Construction of the Corrosion Stain
4.3.3.5 Fretting Experiments on Dust Corroded Coupon Surfaces
4.4 Application Conditions in Dusty Environment
4.4.1 Explanation of the Special Features
4.4.1.1 Covered by Accumulated Small Particles
4.4.1.2 Accumulative Particles Caused by Micro Motion
4.4.1.3 High and Erratic Contact Resistance
4.4.1.4 The Element of Si Causes High Contact Resistance
4.4.1.5 Organics Act as Adhesives
4.4.1.6 Corrosion Products Trap the Dust Particles
4.4.1.7 Difference Between Short Life and Longer Life Contacts
4.4.1.8 Large Pieces of “Stepping Stones"
4.4.1.9 The Performance of Failed Mobile Phones
4.5 Theoretical Analysis of Connector Contact Failure Due to the Dust
4.5.1 Two Micro Worlds in Contact
4.5.1.1 Particles Get into the Contact Interface
4.5.2 “Preliminary Attachment"
4.5.2.2 Trapping Effect of Corrosion Products
4.5.3 Contact Failure Mechanism
4.5.3.1 Single Particle and Ideal Model
4.5.3.2 Complicated Model – Number of Particles and Morphology of Contact Pairs
4.6.1 Dust Test for Connectors
4.6.2 Suggestion of the Dust Test
4.6.3 Minimizing the Dust Problem
The fact that dust can cause contact failure was well known to practicing electricians, engineers and scientists even in the middle of the 20th century. It was formally reported in 1956 by Williamson et al. [1] and in 1981 by Mano [2]. From 1970 to 1985, more papers on the dust problem were published. A review in 1985 given by Reagor and Russell [3] showed that dust contamination of contacts was a problem that could cause contact failure in telecommunication systems. They also described erratic contact resistance found on lubricated, dusty surfaces. Mano and Honma et al. [4,5] published research papers on testing and simulation methods. Papers were also published that showed contact failure may have led to unreliable electronic and electrical systems [6,7]. From the 1970s to the mid-1990s, advanced industrial countries recognized the serious problems resulting from air pollution. They then made large investments and much research to reduce the air pollution and purify the air [8]. Thus, electrical contact problems due to corrosive air and dust contamination were substantially reduced in these countries and the research effort was considerably reduced. During this time, simulation of the corrosive gases on the connector contact surfaces was developed by using the flowing mixed gas FMG system [9] (see Sections 2.7 and 3.3.5), but the problem of dust particles was quite different. Although several theoretical and experimental studies have been made [10,11], this subject is so complex [12] that research for a clearer understanding was still necessary.
4.1.2 The Importance of the Dust Problem
Research on the effects of dust is now becoming more important and more urgent due to the huge market that is growing rapidly in the developing countries, where contact failure caused by dust contamination is one of the major problems. Furthermore, developing countries such as China are already becoming global manufacturing bases and their components are being incorporated into products in many other countries including the advanced industrial nations. Although contamination due to dusty air is very serious in China, it also unfortunately affects neighboring countries such as Korea and Japan. It is, however, difficult for the developing countries to strictly control and reduce the air contamination quickly.
To illustrate the specific situation existing in China, the following failure examples have been selected to demonstrate the scope of the problem.
Example 1: High porosity is found on gold plating surfaces caused by the deposition of dust particles before or during the electroplating process. Serious corrosion (the dark spots) occurs through the pores and spreads on the gold-plated surface as seen in Figure 4.1 [13].
Example 2: Connectors mounted in telecommunication systems suffer from serious contact failures. Figure 4.2a illustrates the contamination on a connector contact surface taken by a scanning electron microscope (SEM). Elements of a spot at the bright area were tested by X-ray energy spectroscopy (XES) and illustrated in Figure 4.2b. The contact surface is covered by tiny particles. Very high atomic percentage (a/0) of silicon and oxygen are found at the spot. Other elements such as Na, Ca, Al, K, and Mg are also included. This shows a mixture of elements in a typical dust composition.
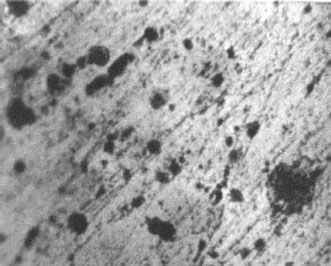
FIGURE 4.1
Corrosive products have grown up through the pores as a result of dust particle deposition.
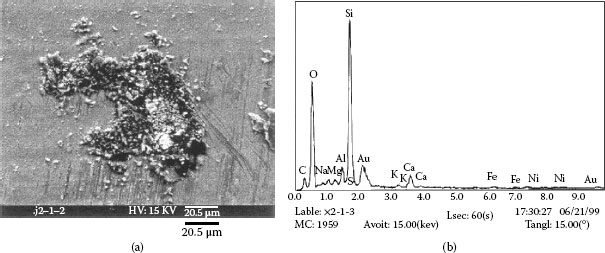
FIGURE 4.2
(a) Accumulated particles (b) Elements in the particles.
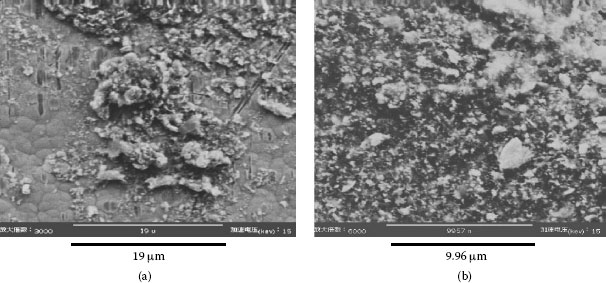
FIGURE 4.3
(a) Numerous dust particles accumulated on the failed contact surface (b) Photo taken from part of (a), at higher magnification.
Example 3: A mobile phone had failed after only 10 months and 22 days. The failed contact surface is covered by numerous particles (see Figure 4.3). Figure 4.3b which is a higher magnification section of Figure 4.3a shows these particles are extremely small but they seem to be tightly attached on the contact surface.
4.1.3 The Complexity of the Problem
The complexity of the effect of dust particle contamination can be summarized by three major influencing factors: (1) The environment which includes the size and composition of particles. It can change from place to place and can vary in different seasons. (2) Different materials contained in the dust have their own inherent characteristics with respect to the performance of electrical contacts such as electrical and mechanical behavior, chemical corrosion and so on. (3) The various application conditions, for example, the micromovement at the contact interface; the special materials involved; the conditions that cause the dust particles to adhere together; the corrosion products that trap the particles and attach them on the contact surfaces. These kinds of “preliminary attachment conditions” can cause a number of particles to embed into the surface. Local humidity and temperature cycles can also enhance the effect of the attachment. When the above factors combine together, harmful particles can enter and contaminate the contact interface and cause high and unstable contact resistance leading to failure. From this point, the very simple procedure that had been used in dust testing for connectors did not fully simulate the dust effect.
Contact failure of electromechanical components involved in the dust contamination is seen in both relays and connectors. Relay contacts have open and close movement. Connector contacts are static, but can have minute up and down as well as laterals movement. Since late 1990’s, most relays have been covered or are hermetically sealed so the failure resulting from dust ingress is significantly reduced. Most connector contacts, on the other hand, are exposed to air. Thus, they suffer from the ingress of dust particles and serious corrosion. Since micro movements resulting from external vibration and impact at the connector contact can often occur, the mechanism of connector contact failure is quite complicated.
Questions arise from this research are: What kind of particles can cause contact failure? What is the mechanism of failure when lateral movement occurs? How can the particles get into the connector contact interface, but not be pushed away when lateral movement occurs? How can they persistently remain at the interface and create high resistance? Why are the past testing methods not workable for connectors? Why does a certain failure level is still remained in sealed relays?
To answer these questions, research studies have been carried out from two directions: (1) The investigation of the failed contact surfaces collected from practical field applications, and to the statistical summarization of the testing result. Based on the analysis of the special features of the failed contact surfaces resulting from particle contamination, reasonable deductions have been carried out for explaining the failure. (2) The study of dusty environments, the source of dust, its composition, the size of the particles, the materials contained in the dust and their characteristics.
4.1.4 The Purpose of the Studies
The purpose of the research is to thoroughly understand the mechanism of failure caused by particle contamination. A workable and effective dust test system for connector application had to be established in order to determine the optimum structure and packaging design for connectors and other equipment working in dusty environments. This research is expected to set standards in the future for manufacture, storage, transportation processes and to improve electrical contact reliability.
4.2 Dusty Environment and Dust Composition
According to the China’s official data, the area of desert and sandy regions area is about 1.74 million km2: that is 18.2% of the area of China. Serious winds start from Mongolia; they pass the Gobi Desert and other large desert areas including various dried salt lakes all the way to the north, north-west and north-east of China. Not only sand and salt, but also dust particles from construction materials used to build new cities and highways, smoke particles from exhaust pipes of motor vehicles, and particles from coal burning are all blown up from the ground into the air. Thus dusty air contains large number of particles made up from a variety of materials. Each of them may contribute different effects on contact surfaces. Unfortunately, there are few obstacles such as forests and grass-lands in the path of the blowing wind. Consequently the wind and the ground materials from a large region causes frequent dust storms. The dusty air can affect almost all the northern part of China. Even coastal cities, such as Shanghai, experience the precipitation of large amounts of fine particles. Figure 4.4a illustrates a dust storm in Beijing, China [14]. Figure 4.4b shows that after rain, the dusty air is washed away. A mountain from far west of Beijing can be seen. Figure 4.4c in normal days, dusty air is covering the whole city.
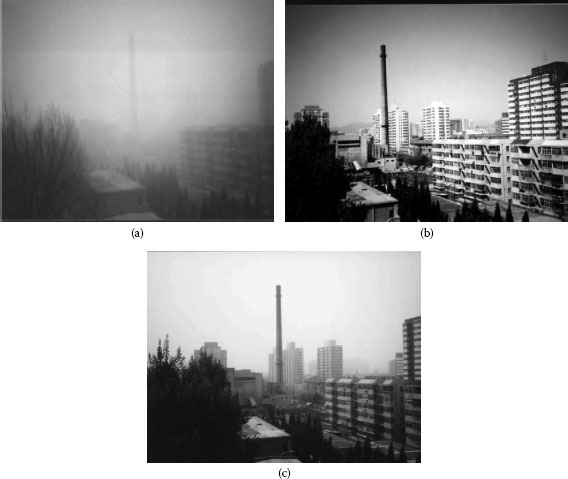
FIGURE 4.4
(a) Dust storm in Beijing (b) After raining at the same site (c) Same site at the normal days.
4.2.2 The Collection of the Dust Particles for Testing
Beijing has been chosen as a typical city in the north regions for dust collecting. Not only is it the capital of China with a high population, but it is also on the wind-path from the desert and other desert areas. It has a great deal of construction using concrete and has a large number of automobiles. Within China, it is considered to only be a moderately dusty city, and can thus represent the situation of many cities in the region. The western part of Beijing does not have high industrial contamination, and so the dust particles are collected indoors in a building on the university campus. Shanghai has also been chosen for the long time indoor air exposure and testing since it is a large commercial and industrial city located on a coastal region of China.
4.2.3 The Shape of the Dust Particles
Dust particles have been collected indoors from the west of Beijing. The photos of shapes and size of particles were taken by scanning electron microscope (SEM) are shown in Figure 4.5a through f [14]. It is seen from these photos that, most particles from Beijing are not simply minerals with polyhedral shapes like sand particles, but they are constructed from various tiny particles. Organics play an important role in causing them to adhere together. The particle shown in Figure 4.5e contains biotite as its core material, which is covered by gypsum and has organic materials coating its outside. Spherical particles come from the vapor of metals such as iron and copper. When the vapor cools down in air; spherical droplets are formed and are soon covered with oxide. After the steel and copper companies had been moved away from the suburb of Beijing, spherical particles have not been present.
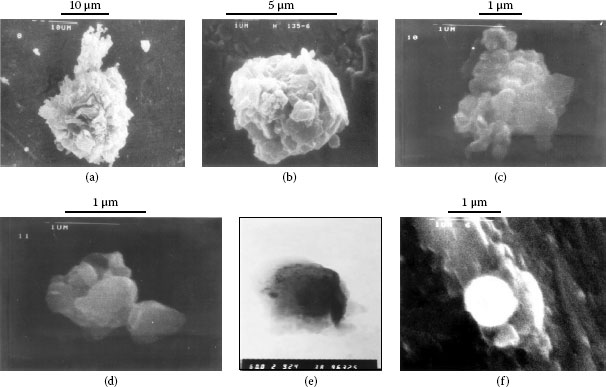
FIGURE 4.5
(a) Particle with size of 30–35 μm (b) Particle with size of 5-6 μm (c) Particle with size of 2-3 μm (d) Particle with size of 1-2 μm (e) Multilayer of tiny particle (f) Spherical particle formed by iron, covered by oxide.
4.2.4 The Identification of the Inorganic Materials
Dust particles have been collected and separated into three groups from fine to large particles by suspension in distilled water. By using automatic x-ray powder diffraction (XRPD), electron probe microanalysis (EPMA), and supplementary test by transmission electron microscopy (TEM), it has been possible to obtain a comprehensive record of the inorganic compounds in fine dust particles [15]. The (XRPD) result is estimated and calculated by the “relative intensity method” with quartz as the internal standard. The result is listed in Table 4.1; the results given by (EPMA) are similar with only a few exceptions. For fine particles, the inorganic material is more than 70% by weight of the dust particles, and clearly comes from the sandy areas, construction materials discussed before. The large sized particles are mainly quartz and feldspar.
4.2.5 The Organic Materials in Dust
Dichlormethane has been used as a solvent for the extraction of the organic compounds. The function groups of the organics are examined by infrared spectrometry. Organic compounds are then identified usually by gas chromatography/mass spectrometry (GC/MS), and finally the weight percentage of the organic compounds as well as carbon black in the dust is determined by thermo gravimetric analysis [16]. The results show that the main constituents of the organic compounds are a series of alkanes (C7−C40+) and some ortho-benzendicarboxylic acid esters (C16H22O4 and C24H38O4). At room temperature, aliphatic hydrocarbons from (C9−C16) are liquid and those greater than C16 are solid. Ortho-benzendicarboxylic acid esters are oily liquids. These organic materials are soft and often sticky, and generally are not conductive. By means of the thermo gravimetric analysis, the weight percentage of the total evaporable and combustible materials in the dust under 700°C is about 28.6%, of which water content is less than 5% and carbon black is less than 15%. In the original dust the organic compounds are estimated to be more than 9% of the total dust. Fibers are seen at room temperature, but most of them are burnt away below 350°C, and the few remaining ones are burnt below 550°C.
4.2.6 The Water Soluble Salts in Dust
Dust particles have been collected indoors from both Beijing and Shanghai. They are dispersed in distilled water and gently heated to obtain samples of dust solution. By means of an inductive-coupled plasma spectrometer (ICP), elements of positive ions are tested. Negative ions in the dust solution are measured by an ion chromatographic spectrometer (IC). Both positive and negative ions are listed in Table 4.2 [17]. Clearly, water soluble salts are involved in the dust. The salts are mainly sulfates and chlorides of elements such as Ca, Na, Mg, NH4 and K, Surprisingly the salt is hardly be visible using an optical microscope or even an SEM. It is believed that most of them have an micro crystal shape attached onto other particles. In a humid environment, the water film may dissolve the salt and make the solution an electrolyte. Thus corrosion products mainly are chlorides and sulfates of nickel and copper. They grow and even surround a particle. Table 4.2 shows the positive ions and negative ions detected from Shanghai and Beijing. From the list, it is reasonable to deduce that the corrosion products of sulfates and chlorides are more severe in Shanghai than in Beijing as a result of the dust particle corrosion. Since the materials in the dust collected from Beijing and Shanghai are now almost known, our studies on failed contact surfaces are able to use the combination of scanning electron microscope and x-ray energy spectroscope (SEM/XES) from the detected elements to deduce the possible materials involved in the dust corrosion.
TABLE 4.1
Composition of Inorganic Materials in Fine Dust Particles (Size < 10 micron), Compared With that of All Dust (By Weight)
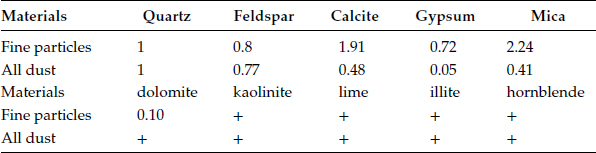
(+) means traces are detected.
Feldspar includes mainly orthoclase (KAlSi3O8), and albite (NaAlSi3O8) Mica includes mainly muscovite KAl2Si3AlO10 (OH,F), and biotite KMg3AlSi3AlO10 (OH,F)
TABLE 4.2
Fractional Weight Percentage of Elements for Ions in Dust Solution (mg/g)
Dust Solution (Beijing) |
Dust Solution (Shanghai) |
|
i) Positive Ions |
||
Na |
2.11 |
3.75 |
K |
1.50 |
1.77 |
Ca |
20.55 |
27.54 |
Mg |
1.85 |
2.09 |
Zn |
0.05 |
0.01 |
Fe |
0.09 |
0.04 |
Cu |
0.04 |
0.02 |
Mn |
0.05 |
0.13 |
Si |
- |
0.18 |
ii) Negative ions |
||
Cl |
6.34 |
17.35 |
18.90 |
32.25 |
|
F |
0.58 |
2.30 |
NO3 |
3.86 |
5.22 |
4.3 The Characteristics of Dust Particles
4.3.1.1 Measurement of the Electric Charge
Dust particles carry electric charges that can be measured by the Millikan method. A brief introduction of the measurement is shown in paper [18]. Test results show that particles carry similar amounts of positive charge and negative charge as illustrated in Figure 4.6. In a DC electric field, the amount of fine particles deposited on a negative polarity surface and on a positive polarity surface is closely similar. Thus, when the two surfaces are in contact, the number of particles at the interface is almost doubled. Since dust particles comprise of various materials, each of them may carry different levels of electric charge. Measurements are also made of the electric charge carried by particles of pure materials that are contained in the dust.
A sequence of materials is listed with typical amounts of electric charge from high to low as follows: Organic materials, TiO2, gypsum, mica, quartz, feldspar, calcite, aluminum oxide, solid particle with salt coverage. For organic materials such as polystyrene particles with a radius of 1 μm to 2 μm, the average electrical charge carried by these particles is about two times higher than that of the same sized dust particles. Experiment results further show that the amount of charge is closely related to the effective surface areas and to the resistivity of the particles as well as to the humidity of the environment. High humidity will greatly reduce the electric charge see Figure 4.7. On average, the electric charge carried by dust particles with 1.5 μm of radius in wet condition of 75% RH, is 50% less than that in dry condition of 25% RH.
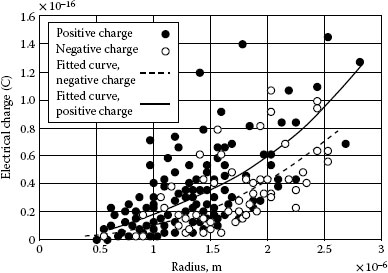
FIGURE 4.6
Electric charge carried by dust particles.
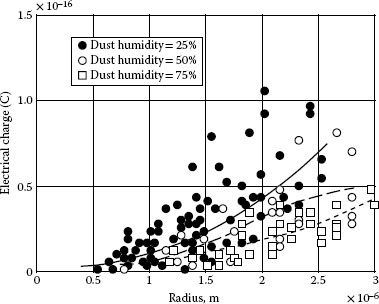
FIGURE 4.7
Electric charge carried by the particles at different humidities.
4.3.1.2 The Electrostatic Attracting Force on the Particle
4.3.1.2.1 No External Electric Field
A dust particle carrying an electric charge may build up a tiny static electric field at the metal surface. The attracting force Fe between particle and the metal surface is expressed as the following equation (4.1):
(4.1) |
Where, Q is the electric charge carried by the particle. ε0, is the permittivity of air, and d0is the distance from the center of particle to the metal surface. When the distance is short, the attracting force can be very strong.
4.3.1.2.2 The Effect of Surface Orientation and Surface Roughness
Experimental results show that when a contact surface is set vertically to the direction of gravity force on the dust particle, both the gravity force and the tiny field attractive force are in same direction and are cumulative; i.e., they are added together. Thus, dust particle deposition density reaches a maximum value and appears little effected by the surface roughness. But when contact surface is parallel to the gravity force on the particle, deposition of particle is a function of the contact surface’s roughness: the rougher the surface, the lower the dust deposition density [20] as illustrated in Table 4.3a. The percentage of different sized particles in the total dust density is quite different; the percentage of large particles increase with the contact surface roughness, but the percentage of small size particle in the total dust density is reduced, see Table 4.3b.
The explanation of the above observation is that the density of the larger particles increases with the surface roughness since rough surfaces may accommodate larger particles, but at the same time they may cause the small particles to deposit around them. Because the number of small particles is the majority, the total dust density is reduced with the increase of contact roughness. By using a least square method, dust density is fitted to a log-normal distribution which is in agreement with the testing result made by L. White of IBM [10], As the surface roughness increases (from #3 polished by Grit 1000 to #2 by Grit 600 and #1 by Grit 400), the particle size distribution curves become broader and the peaks of the curves move to larger size of particles as shown in Figure 4.8. More recent work raises, however, raises questions about the validity of the log-normal distribution. The high magnification achievable with modern SEMs makes it possible to observe the presence of the large number of very small particles.
TABLE 4.3a
Contact Surface Roughness versus Particle Deposition Density
Surface Polished by Grit Number |
Surface Roughness in Arbitrary Unit |
Dust Particle Density in Arbitrary Unit |
Grit 1000 smooth |
0.1 |
5.7 |
Grit 600 medium |
0.8 |
1.2 |
Grit 400 rough |
1.8 |
1.0 |
TABLE 4.3b
The Percentage of Different Particle Size in the Total Dust Density vs. Surface Roughness
Surface Polished by Grit Number |
Percentage% Total Dust Density |
Percentage% Total Dust Density |
Percentage% Total Dust Density |
Polished by grit no. |
Size D < 0.4 μm |
0.4 < D < 1.1 μm |
D > 1.1 μm |
Grit 1000 smooth |
98 |
1.8 |
0.2 |
Grit 600 medium |
82 |
14 |
4 |
Grit 400 rough |
52 |
38 |
10 |
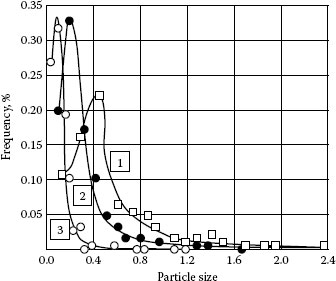
FIGURE 4.8
Particle size μm) distribution fits a log-normal curve.
4.3.1.2.3 The Effect of an External Electric Static Field
An external static electric field may attract more particles as shown in the well known equation:
(4.2) |
Where F is the attracting force, E is the external field intensity, Q, the electric charge carried by the particle. An experiment with two vertically positioned coupons, with parallel surfaces has been used to investigate the effect of an external static field on dust collection; see Figure 4.9a. Dust density on the positive surface increases almost linearly with the applied voltage. The linear increase of the total dust density with increasing dc voltage is shown in Figure 4.9b. Table 4.4 indicates that application of a static voltage enhances the deposition of smaller particles. The highest dust density, however, is found at the edges of the coupon, where the field strength is highest. This is shown in Figure 4.10.
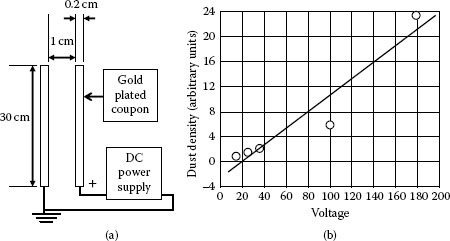
FIGURE 4.9
(a) The experimental set up (b) The dust density vs. voltage.
TABLE 4.4
Voltage vs. Particle Density (Number of Particles/mm2)
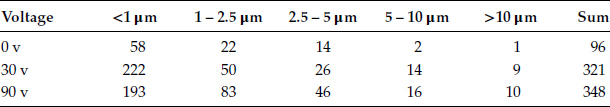
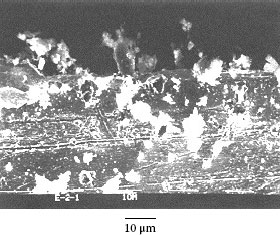
FIGURE 4.10
An example of very dense particle precipitation at the high field region on the edge of coupon.
4.3.1.2.4 The Attraction of Particles to an Open Contact Gap
Figure 4.11 shows a gap between a probe and a flat plate such as can be seen for an open contact. FEM indicates that the field intensity in the gap is greatly enhanced. Experimental results verify that a high particle density occurs on the flat plate in the region of the gap [23]. The particle density for a 1 mm gap is higher than that for a 5 mm gap and the particle density for a 5 mm gap is higher than that for a 10 mm gap. The particles are moved from the area away from the probe to the higher field region between the probe and the plate. This shows that it is possible for particles to move to a region of higher field intensity. Thus in a relay where vibration takes place during contact opening and closing, it is possible to dislodge particles that have adhered to the relay’s walls. Some of these may settle close to the contacts. When the contacts are opened the electric field between them may attract these particles to the contact surfaces. Failures have been seen even with relays that have been carefully cleaned and checked before sealed. One example has found particles such as quartz and feldspar located at the contacts [21]. Another one found that plastic fibers caused the failure [22]. This shows that particles that carry a high level of electric charge may attach and hide on the relay’s walls or on other parts. Once the relay experiences an impact, the internal electric field between the contacts may attract particles to move to the contact surfaces, which may eventually result in device failure. Dust deposition is highly selective [23]. Under the same electric field intensity the deposition depends greatly on the amount of electric charge carried by the particles. Some materials, such as organic materials, and titanium oxide are rare in dust, but if they do occur they have a high probability of being found on the contact surfaces.
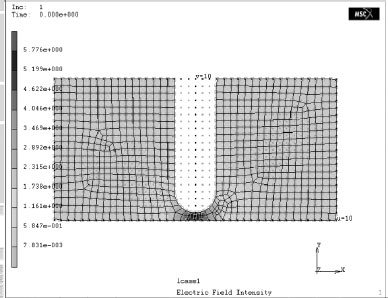
FIGURE 4.11
The electric field intensity at the open gap between the probe and the sheet.
When particles are located at the contact interface, two interacting conditions between dust and contact commonly occur: hard particles on a soft surface, and soft particles on a hard surface. The hardness of various materials is listed in Table 4.5 [24], using the Moh’s scale. This scale is based on the ability of a harder material to scratch a softer material. A Moh’s hardness above 6, such as feldspar, quartz, or hornblende, can be considered as hard relative to a gold plated surface, while hardness below 2-3, such as illite, kaolinite, calcite, gypsum, mica, and organics such as fiber are soft.
TABLE 4.5
Hardness of Material in Mohs
Hardness Mohs |
Minerals & Metals |
Formula |
1 |
Talc |
Mg3Si4O10(OH)2 |
1-2 |
Illite |
K0.6(H3O)0.4Al1.3Mg0.3Fe2+0.1Si3.5O10(OH)2⋅(H2O) |
1.5-2 |
Kaolinite |
Al2Si2O5(OH)4 |
2 |
Gypsum |
CaSO4 (2H2O) |
2-2.5 |
Muscovite |
KAl2Si3AlO10(OH,F)2 |
2-3 |
Biotite |
KMg3AlSi3O10(OH)2 |
2.5-3 |
Gold, silver |
Au, Ag |
3 |
Calcite |
CaCO3 |
3-4 |
Lime |
CaO |
3.5-4 |
Dolomite |
CaMg(CO3)2 |
4 |
Fluorite |
CaF2 |
4-5 |
Iron |
Fe |
5 |
Apatite |
Ca5(PO4)3(OH-,Cl-,F-) |
5-6 |
Nickel |
Ni |
5-6 |
Hematite |
Fe2O3 |
5-6 |
Hornblende |
(OH)2Ca2(Mg,Fe)4(Si6Al2)O22 |
6 |
Orthoclase |
KAlSi3O8 Albite NaAlSi3O8 |
6.5 |
Steel |
|
6-7 |
Epidote |
4CaO⋅3(Fe,Al)2⋅O36SiO2H2O |
7 |
Quartz |
SiO2 |
4.3.2.2 For Stationary Contacts
1. A hard particle pressed the soft surface of the stationary contacts
Figure 4.12 illustrates a model with a hard particle (e.g., quartz or feldspar) which is much harder than that of the contact interface (e.g., a gold plated surface). The particle is embedded into the gold plated surface under normal force [25]. For simplicity, assume that the particle shape is a sphere. The embedded depth r’ is expressed in Equation 4.3 [26]
(4.3) |
Where, P is the normal force. D is diameter of the spherical particle, r is an average micro peak height and HAu is the gold plating hardness. Assume that the upper surface and lower surface are similar, then the distance H′ between the micro peaks of two surfaces can be expressed as Equation 4.4.
(4.4) |
When the normal force increased to an extent that H′ = 0, the two contact surfaces touch each other, electric current can then pass through the connection of the micro peaks as illustrated in Figure 4.13. For this one micro-spot the contact resistance R1 is:
(4.5) |
Where a1 is the radius of the micro-spot. As normal force is increased, more micro-peaks are in contact and the total contact resistance R can be expressed as (see Chapter 1, Section 1.2):
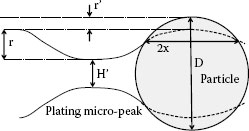
FIGURE 4.12
Model with a particle embedded at the contact interface.
FIGURE 4.13
The electric current passes through the peak to peak contact.
(4.6) |
Where, ai is the radius of a contact ith spot and α is the Holm radius of the spot cluster.
When the particle is fully buried into the surface, contact resistance is quite low. Only when the particle is partially embedded and little metallic contact is made will the contact resistance be high. If sufficient current passes through the contact spots that the isothermal representing the metal’s softening temperature (see Chapter 1, Section 1.4) reaches to vicinity of the particle, the embedding depth may well increase as shown in Figure 4.13. More contact spots may then be created and the contact resistance may be reduced even further. Experimental data support the above deduction. Figure 4.14 shows a number of pits visible on a gold plated sheet after an electric current has passed through a dusty contact surface with the resultant plastic deformation around the particles’ location. The particles have been removed to reveal the pits.
2. A soft particle pressed onto the comparatively hard surface of the stationary contacts
Materials frequently found in dust are inorganic particles such as calcite, mica, gypsum [27], and carbon black. Organic particles such as fabric fiber or some kinds of organic particles are much softer than silver and most other metals. This type of particle can deform under normal contact force and remain in place on the contact surface. Large particles can be very harmful in a relay application, but in connectors they are usually pushed away from the contacting region and are less harmful to the contact. Calcite particles are easily to be cracked under a force. For static contacts it appears to do little harm, but for sliding or fretting the particles tend to adhere together, form a pancake, which can cause failure. Mica is a laminate material, which can be broken into small pieces and spread over the contact. They are difficult to dislodge, because they are very thin and flat. If these tiny flat pieces cover all the initial metallic contact spots, the contact could fail. The testing results for gypsum show that it is less harmful than calcite, because even though it can crack into pieces, they do not adhere together. They also can slightly dissolve in water, but there is a lack of evidence to show that gypsum can cause serious corrosion. Carbon black is soft. It is likely that carbon particles may fill in the micro valleys or holes and make the surface smoother. It is also a low conductivity conductor.
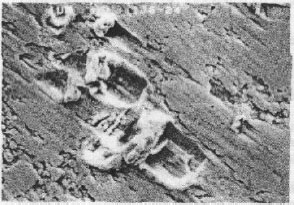
FIGURE 4.14
Pits on gold plated contact surface.
When a strong lateral force is applied, the pits caused by embedding of the hard particle could be prolonged to form scratches or wear tracks. The metal from these wear tracks usually becomes wear debris and can be pushed away from the tracks. The debris volume V is expressed as,
(4.7) |
Where P is the contact force, X is the sliding distance, Hm, is the metal’s hardness, k is wear coefficient, see Horn [28]. When contact force is below 0.04 N, k approaches to zero. From 0.04 to 0.5 N, k is very changeable. Beyond 0.5 N, k is stable and equal to 3 × 10⁻⁴. Thus when contact force is in between 0.04 to 0.2 N, the tracks can be very light.
4.3.2.4 The Effect of Lubricants Coated on Contact Surface
The presence of lubricants affects the results of sliding wear in dusty environments. Studies by Mottine and Reagor [29], Hague et al. [11] give specific data. It must be noted that the environments and applications are very complicated. There is no “universal lubricant” which can fit all kinds of requirements [30] (see Chapter 3, Section 3.4). Many lubricants can attach to the contact surface thus are remain in place and will not be pushed away. The permittivity of the lubricant can be an important consideration. Figure 4.15 shows a schematic of a model of a particle above a lubricated layer. Assume a dust particle acts as a point-source carrying a charge Q and is located at a distance d0 above the surface of a dielectric layer of thickness dj. The dielectric layer is supported on a grounded conductor. With the permittivity of vacuum, ε0, and the permittivity of the dielectric layer, ε1, the force F acting on the particle is,
(4.8) |
The force ratio F/F0 as function of the ratio ε1/ε0 is plotted in Figure 4.16. F0 represents the force acting on the particle for a dielectric layer with ε1 = ε0. Properties of several wax and liquid lubricants are listed in Table 4.6.
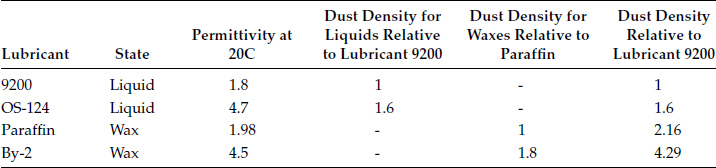
A wax lubricant coated on contact is a layer that covers the whole surface. Wax with a high permittivity attracts more dust particles than the one with a lower permittivity. Liquid lubricants coated on a contact surface generally appear as droplets spread over that surface. Liquids with high permittivity also attract more dust particles, but the particles only concentrate and float on the droplets. They are less prevalent on a surface with no lubricant. Thus, dust density for the surface coated with a liquid is much less than that of the surface coated with wax. The experimental data is shown in Table 4.7.
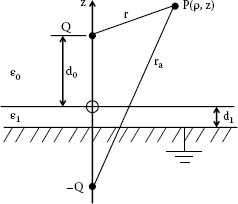
FIGURE 4.15
A model of a particle carrying a charge Q above a lubricated layer.
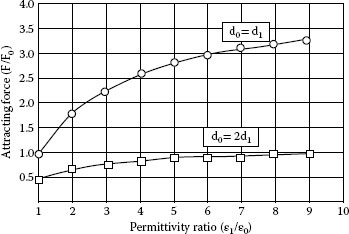
FIGURE 4.16
Permittivity vs. attracting force.
TABLE 4.6
Selected Properties of the Lubricants
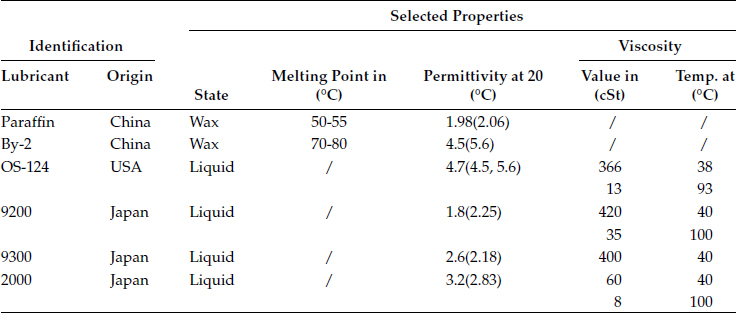
Number in the bracket () is another test result.
TABLE 4.7
Permittivity versus Dust Deposition Density
4.3.2.5 Sliding Contacts on Lubricated and Dusty Contacts
During sliding on a wax lubricated surface, particles mix with the wax. Particles cannot leave this mixture. Thus the lubricated surface can result in a high contact resistance. BY-2 possesses a high permittivity and collects a high density of dust particles. Thus the probability of getting contact trouble with this lubricant would be very high. OS-124 is a liquid lubricant also with a high permittivity and thus can attract dust particles. However, dust particles float on the liquid which has a high contact angle. During sliding dust particles can be pushed away with less harmful effect [31]. Experimental results are summarized and illustrated in Figure 4.17a for wax lubricants and Figure 4.17b for liquid lubricants [32]. Contact resistance above 10 mΩ is considered failure for gold plated connector contacts. The sum resistance of failed contacts is expressed as “resistance” with respect to the permittivity for various lubricants. The number of markers of the same kind expresses the number of experiments. In these experiments the contacts are made to slide a distance of 2 cm for 50 operations. Contact resistance is measured 8 times for each sliding operation. Conclusions from the sliding experiments: (a) The sum of failure resistance is higher for wax than for liquid lubricants. (b) High permittivity of the lubricants results in high sum of failure resistance. (c) A high contact force or high current reduces the sum of failure resistance for lubricated contacts.
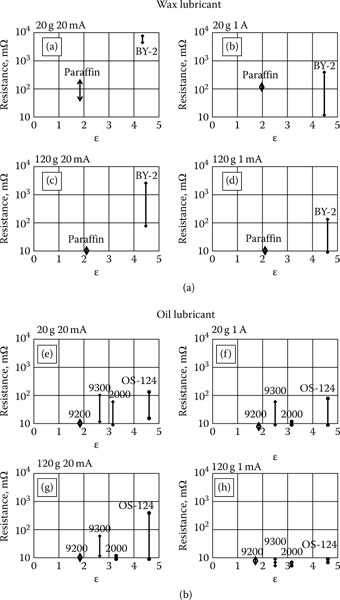
FIGURE 4.17
Contact resistance for dust on lubricated surfaces. (a) Wax lubricants. (b) Liquid lubricants.
4.3.2.6 Fretting (Micro Motion) on Lubricated and Dusty Contacts
The effect of the five lubricants, BY-2, Paraffin, OS-124, C-2000, and C-9200, on the contact failure under micro-motion has been studied [32]. As found in the experiments with sliding contacts, permittivity and the state of the lubricants are also important with micro motion. The results are presented in Figure 4.18a, where the total number of failures as a function of the permittivity of the lubricants is plotted. They are compared with results of the sliding experiment shown in Figure 4.18b. The trends in the two figures are similar. Notice that in Figure 4.18a the vertical axis is the total number of failures, while in Figure 4.18b it is the sum of resistance failures. Evidently, the resistance of the total number of failures is much higher than the sum of resistance failures. Therefore, as a result of the experiments, failures caused by micro motion are more serious than that of sliding contacts. In micro movement experiments on a BY-2 lubricated wax surface show that it performs badly compared to the liquid. Dust particles attach strongly to the wax in some places in the moving track and they remain there.
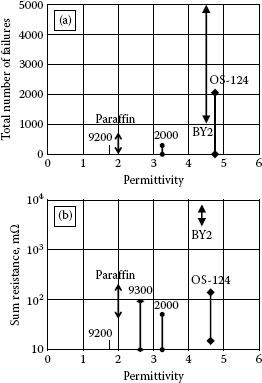
FIGURE 4.18
(a) The fretting experiment. (b) The sliding experiment.
4.3.3.1 Dust Particles Create Pores
When the electro plate is exposed in air, dust particles can easily deposit on the substrate metal before and during plating process. Gold ions can only reduce on a conducting metal surface but not on insulating particles. As the gold plating surrounding the particle gets thicker tiny pores are created in the gold plated layer. The number and size of pores resulting from dust deposition are more serious than those caused by surface roughness. Figure 4.19 shows very poor gold plating with numerous holes (dark spots) on the surface. XES detection at the holes can find elements of dust composition in them. Such gold plating is very susceptible to sliding or fretting wear. In fact, the gold plate can be easily peeled off and cause further corrosion, see Figure 4.20.
4.3.3.2 Corrosion Appears as a Result of Dusty Water Solutions
Experiments show that an aqueous solution of dust collected from Shanghai and Beijing can cause serious corrosion on thin gold plated surfaces. For accelerating the process, scratches are made to expose the nickel underplate. Dusty water solution is dripped onto the thin gold plated surface several times after the solution evaporates. Corrosion is clearly seen as shown in Figure 4.21. XES results show that not only elements of sulfates and chlorides of nickel and copper are present, but also elements of water soluble salts such as Ca, K, Na can be detected [33]. The result is consistent with previous experiments that show the elements appear as both negative and positive ions in the dust solution.
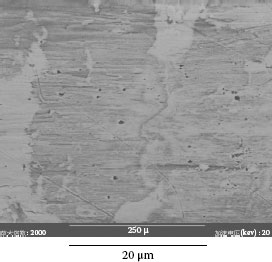
FIGURE 4.19
High porosity as a result of dust contamination.
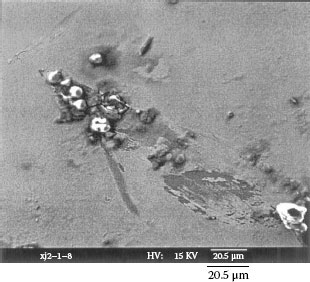
FIGURE 4.20
Corrosion at the end of a wear track after the gold layer was peeled off.
4.3.3.3 Indoor Exposure Results
Several long term exposure experiments have been carried out in Shanghai and Beijing. Total indoor exposure duration on gold plated coupons in Shanghai is 22 months and in Beijing is 10 months. Figure 4.22 shows the corrosion stain formed on thin gold plated coupon surface after 15 months indoor exposure in Shanghai [34]. As it is described in Chapters 2 and 8, thin gold layers are always porous and can be corrosion will be initiated at the pore. The corrosion product appears as stains on the plating’s surface. Evidently at least one pore is underneath each stain. Thus the porosity of thin gold layer can be counted approximately by counting the number of stains. The major components of the electrolytes that cause the corrosion are the water soluble salts carried by dust particles. The salts dissolve in the water film formed on the plated surface when there is a humid ambient. Dust particles are therefore also associated with pore corrosion, and they may be found located on the stain area or in a region close by the stain. The number of corrosion stains and number of particles can be counted using optical microscope. Note that using an optical microscope it is only possible to observe particle sizes greater than ~ 4 μm. Table 4.8 lists number of stains/per cm2 and number of particles/per cm2 as a function of exposure time over a gold plated area of 64 cm2 and an average surface roughness Ra of 0.2 μm. It can be seen from the Table that the number of corrosion stains and the number of particles increases with the exposure time. This does not take into account the number of small particles (i.e., < 4 μm), which can greatly add to this count. As the number of stains increases with exposure time, each stain area also grows larger. The growth rate of the stain area (mm2) as well as average diameter (μm) is found to fit a log distribution curve [35].
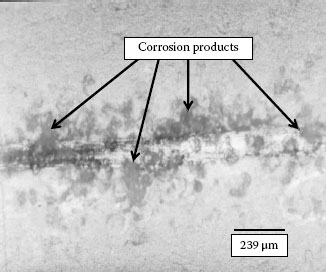
FIGURE 4.21
Corrosion on the scratches.
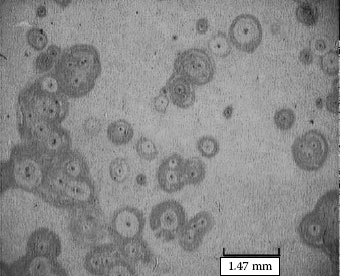
FIGURE 4.22
The corrosion stains on a thin gold-plated surface.
TABLE 4.8
Number of Stain and Particles with Exposure Time
Number of Stains/cm2 Thin Au Plating |
|||
Exposure Time Number of Months |
0.48 μm |
1.55 μm |
Particle Density Number of Particles/cm2 |
3 |
132 |
41 |
920 |
8 |
139 |
51 |
1220 |
15 |
139 |
75 |
/ |
22 |
180 |
80 |
/ |
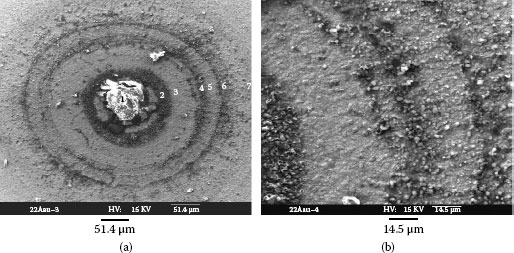
FIGURE 4.23
(a) The structure of corrosion stain (b) A higher magnification of part of the rings in (a).
4.3.3.4 Construction of the Corrosion Stain
Figure 4.23a illustrates an SEM photo of a typical construction of a stain after 22 months indoor exposure in Shanghai. There is a central core located at the pore site surrounded by several rings. Figure 4.23b shows a part of the rings, they were constructed mainly by many tiny islands. The elements found at the core and in the rings are mainly chlorides, sulfates, hydrates and oxides of nickel and copper. In some places elements of dust are found to be mixed with this corrosion. The special construction of the corrosion stain of a central core surrounded by corrosion rings can be imagined as seaweed pushed radially by a tide. When the tide ebbs the seaweed is left on the surface as in the form of rings. This will be repeated from tide to tide leaving a succession of rings. Corrosion products formed the pore and starting from the pore float away from the core on electrolytes or on dusty water during a cycle of high humidity. When this liquid layer dries in a low humidity cycle the corrosion rings are left behind [36]. After 22 months of indoor exposure, the core size can be as large as 20 μm when tested by 3-D profilometry. Rings can be as thick as 0.3 μm when checked by Auger electron spectrometry AES (sputtered by Argon ions for 10 min with speed of 300A/min). The growth mode of these corrosion products is not a layer type of growth but a tiny-island ring growth instead. The construction of the corrosion stains on gold plated coupons exposed in Shanghai and Beijing appear to be similar. The corrosion starts at the first month to form at the pore and gradually forms a closed ring which then extends outward to form rings surrounding a central core. Ring-like corrosion products look similar to the dust particles. The difference between them can be observed by SEM/XES and is summarized in Table 4.9.
TABLE 4.9
The Difference Between Corrosion Products and Dust
Dust Particles |
Island-Like Corrosion Products |
|
Elements in the composition |
Si Al, C, O, Na K, Mg, S |
Mainly Ni, Cu, S, O, Cl |
Shapes |
Polygon, comparative sharp edges |
No special shape, no sharp edge |
Distribution |
Separated with each other, usually with different elements |
Connected with each other, almost the same elements |
Surface |
Very rare cracks |
Cracks on the surface |
It is not easy to find the contour of the particles that are so small that might be partly buried or surrounded by corrosion products. In other words, it is difficult to verify their existence using an SEM. It is possible, however, using XES to identify the elements of dust composition, which, in turn, will show the existence of the very small dust particles. In order to distinguish whether the corrosion product is mainly caused by corrosive gases in the air or by dust particles, XES analysis can again be helpful. If the corrosion products are created by SO2 and Cl2 gases in air, they contain only elements of Ni, Cu, S, O, and Cl. If, however, they are caused by dust particles, elements of the positive ions of water soluble salts such as Ca, Na, and K will be present in the products. Silicates as well as calcium compounds may also appear within the corrosion products.
4.3.3.5 Fretting Experiments on Dust Corroded Coupon Surfaces
Fretting experiments have been carried out using a fretting machine. The moving length is in a range of 30-50 μm with fixed direction and length. The normal force is set at 0.5 Newton. Contact resistance is measured during the experiment. The probe is initially placed in contact close to the core and the fretting cycle passes through the core area. The initial resistance is few hundred mΩ. As the number of fretting cycles increases, the resistance drops to a value lower than 10 mΩ as illustrated in Figure 4.24a [37]. Such a reduction is caused by the cracking and scattering of the large area of corrosion at the core, and also its weak attachment to the contact surface. It can be seen in Figure 4.24b after the fretting experiment, the core has not remained in the track area. The smooth region B is the fretting area, A shows a remnant of the core, C is the wear debris. The debris has been pushed away from the fretting area. The elements left in the core and in the wear debris are listed in Table 4.10. They are mixture of silicates and chloride of nickel and copper.
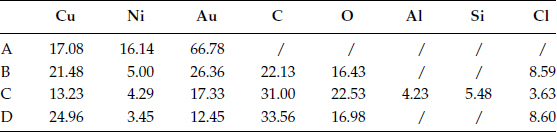
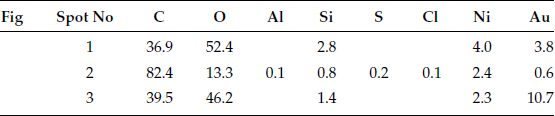
Fretting on various ring areas gives an initial low contact resistance. However, in some places, the resistance can increase to a very high value and remain there as the fretting experiment continues. This is illustrated in Figure 4.25a. The corrosion product surrounding the particles creates the attachment for the particle to the contact surface. When the fretting movement occurs, the particle becomes embedded into the surface and becomes tightly attached as the fretting cycling continues [38]. Figure 4.25b shows an enlarged figure of embedded particle. Table 4.11 shows the XES testing result at four spots. At spot A, XES shows only the gold plated surface. At spot B, chlorides of nickel and copper are seen. Spot C, shows a mixture of silicate particles, carbon and chlorides of nickel and copper. C spot also shows a particle with a high silicon concentration. At spot D, chlorides and carbon cover the surface. The wear track on Figure 4.25b shows a dust particle has been strongly pressed and tightly attached to the surface.
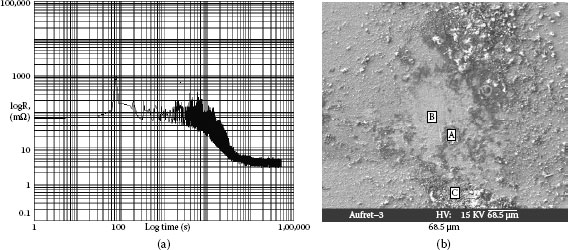
FIGURE 4.24
(a) An example of the resistance dropping during fretting on core area (b) The worn area and remnant of the core.
TABLE 4.10
The Atomic Percentage of the Elements in the Remnant of the Core and in the Wear Debris in Figure 4.24b
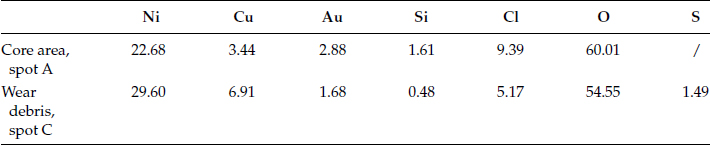
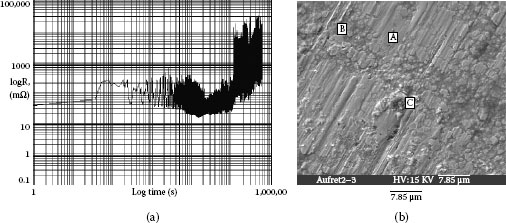
FIGURE 4.25
(a) Fretting on ring area (b) An example of a particle embedded in the fretting region.
TABLE 4.11
The Atomic Percentage of the Elements at Different Spots in Figure 4.25b
4.4 Application Conditions in Dusty Environment
4.4.1 Explanation of the Special Features
Different applications of connectors may show different features at the failed contact surfaces. Since large numbers of failed mobile phone connectors have been analyzed and reviewed statistically [38,39], detailed features of failed mobile phone connectors can be presented as a typical examples of dust particle contamination. Connectors in mobile phones consist of a spherical probe in contact with a printed circuit board (i.e., a ball-on flat design). Normal force applied on the contacts can vary from 0.5 N to 1 N. In most cases, the contacts, substrate metal is phosphor bronze, coated with nickel as barrier layer to prevent diffusion of copper and to harden the surface. A layer of gold plating is coated on top of the contacts. Field failed contact surfaces are tested by optical microscope and SEM and by XES. For organic materials, they are tested by Infrared Fourier Spectrometry. Special features of failed contact surfaces are identified and described as follows.
4.4.1.1 Covered by Accumulated Small Particles
Figure 4.26a shows contaminants covering the failed contact’s surface. Figure 4.26b displays the enlarged portion of the accumulated particles marked in the rectangular square in Figure 4.26a. The contaminants are actually composed of numerous tiny particles.
4.4.1.2 Accumulative Particles Caused by Micro Motion
The examples below show that micro movement plays an important role in the failure of movable contacts. It is found that about 42% of the contact surfaces on the PWB appeared to have sliding wear tracks; however, 58% are without clear wear tracks or have no tracks at all. Figure 4.27a illustrates the micro wear tracks on a failed contact surface. Clearly, the motion is not in a regular straight line with a fixed length as had expected and as had been used in the laboratory experiments. On the contrary, it is erratic both in direction and in distance [40]. Figure 4.27b illustrates the accumulated particles found at the end of the wear track. The effect of micro motion at the contacts can be summarized as producing wear debris both on the corrosion products and on the plated metals. Hard particles such as quartz are embedded into the plating’s surface. The laminate particles such as mica and soft particles such as calcite and gypsum are pressed onto the contact surface. An important consequence of this micro motion is the collection and accumulation of contaminant particles and the formation of tiny high resistance regions. Once the contact probe climbs onto the surface of such a region, contact failure can occur.
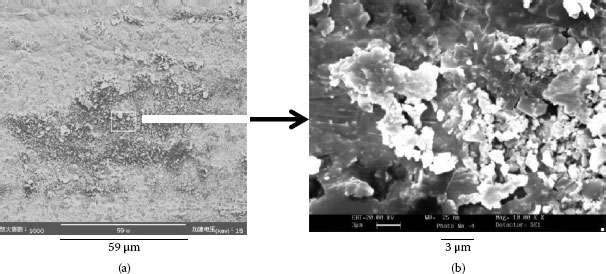
FIGURE 4.26
(a) Contaminants on the contact surface (b) Enlarged portion of particles from (a).
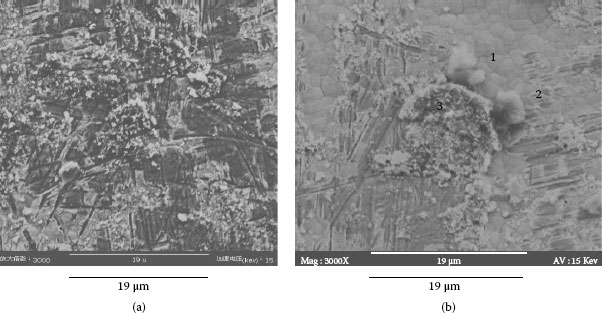
FIGURE 4.27
(a) Wear tracks as result of micro motion (b) Particles piled at the end of the wear track.
4.4.1.3 High and Erratic Contact Resistance
Figure 4.28a shows contaminants covering the area of failed contact. Figure 4.28b shows the enlargement of the lower region in Figure 4.28a. Figure 4.28c presents the enlarged portion of the right side region. Figure 4.28d shows the upper region. From these pictures, the surface of the particles looks to be flattened and tightly attached to the contact’s surface. This indicates that particles have undergone not only with the high normal force but also lateral shearing force. Table 4.12 shows the contact resistance of the contaminated area in Figure 4.28a. Figure 4.28a is divided into 20 square regions named as X (x axis) and Y (y axis). Resistance testing spots are located at the center of the square regions. Distance between each spot is about 50 μm. The resistance at different spots can vary a lot. Testing many other failed contacts, resistance as high as that expected from insulation has been found. It is easy to predict when micro motion has occurred if the probe stops on a high resistance region; it is equivalent to a high resistance connecting in series with the electronic circuit which may well result to the circuit failure. When the probe moves to another region with a lower resistance the contact resistance becomes acceptable. Thus, during micro movement, the performance of circuit can be very unstable.
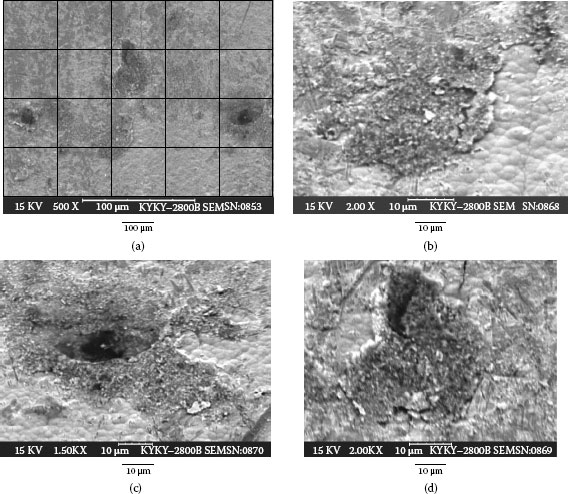
FIGURE 4.28
(a) Contaminants on the failed contact: (b) Lower left hand side region in (a): (c) Right side region of (a): (d) Upper region of (a).
4.4.1.4 The Element of Si Causes High Contact Resistance
Testing results show that accumulated particles are composed of dust, corrosion products, and wear debris of surface materials. Testing of high resistance regions has found that 56 out of 74 testing spots contain silicon. This is much higher than has been observed for other elements found in dust. Silicates in the dust such as quartz, several kinds of feldspar and mica may therefore contribute more than other materials in developing high resistance contact surfaces. Figure 4.29 shows contamination on a failed contact surface. The life time for this mobile phone is 11 months and 20 days. Three testing spots are randomly selected at the contaminant with high resistance see Figure 4.29. The elements are listed in Table 4.13. Apparently carbon and organics heavily cover the surface. Although corrosion products seem to be very light, silicates are involved in all three testing spots.
TABLE 4.12
The Contact Resistance (mΩ) in the Contaminated Regions in Figure 4.28a
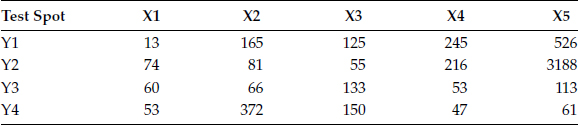
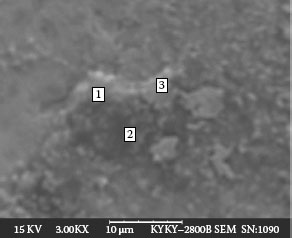
FIGURE 4.29
Illustrates the contaminants with 3 testing spots. Table 4.13
TABLE 4.13
The Atomic Percentage of Elements at Different Spots
4.4.1.5 Organics Act as Adhesives
XES inspection of failed contacts has found that 252 out of 363 total testing places (i.e., about 70%) have very a high carbon concentration plus a certain amount of oxygen. Contaminants in Figure 4.30 show an example, from a mobile phone whose life is only 3 month and 11 days in Beijing. Once the phone is used it cannot shut down, and sometimes it will not open either. Contamination has been found on battery contacts. In Table 4.14 of XES data taken on Figure 4.30a and region 1, 2 and 3 on Figure 4.30b show a lot of carbon and other organics mixed with silicate particles. Nickel oxides may also possibly exist, but are not observed in this analysis. Figure 4.31a shows the contaminant photographed using an SEM. Further investigation by precise infrared spectrometry on Figure 4.31a reveals a certain level of lactates of sodium and calcium. Figure 4.31b shows specific spectra. The upper spectrum is the standard for sodium lactate. The lower one is the test sample. The sample fits the standard well. Lactate is part of the human sweat. It is also found in hand lotion. In a certain temperature range and with certain water content, it can act as an adhesive to adhere separate particles together. It can also attach the particles to the contact surface. This can be an extremely destructive condition when sliding or micro motion is present. The consumer product of sodium lactate is a 60% aqueous solution miscible in water. Tests shows that this solution can prevent particles from scattering when a pushing force is applied. Lactates can also perform as a lubricant on the metallic interface between a probe and a PWB, since they possess a polar head, which can attach to a metal’s surface, (see construction of sodium lactate where COONa is the polar head)
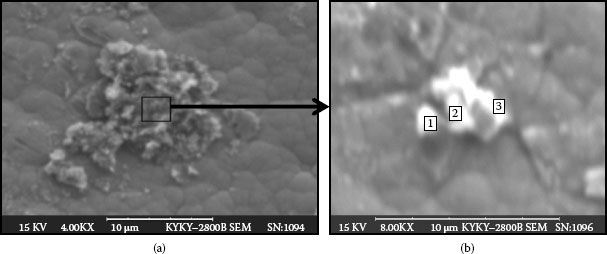
FIGURE 4.30
(a) The frame scanned by XES, see Table 4.14: (b) Detailed spots analysis by XES, see Table 4.14.
TABLE 4.14
Frame Scanning and Spot Test Result by XES Atomic Percentage
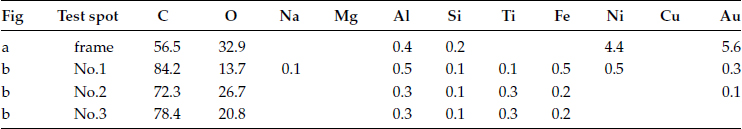
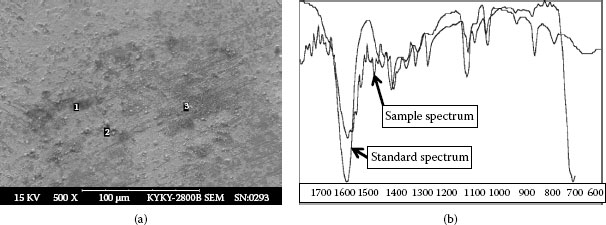
FIGURE 4.31
a) Contaminated area with high carbon concentration. (b) Upper curve is standard spectrum of sodium lactate.
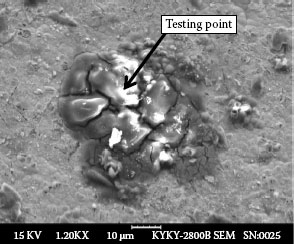
FIGURE 4.32
The contaminant on the contact surface.
4.4.1.6 Corrosion Products Trap the Dust Particles
Using the SEM/XES it is seen that elements of nickel and copper can combine with the dust contaminants to form corrosion products that can strongly attach to the nickel under plate. Thus the dust particles can be trapped by and mixed with the corrosion product. The following example shows this effect. When the accelerating voltage of the XES is increased, the x-ray penetration depth deepens according to the equation derived by Andersen and Hasler [41]:
***(4.9) |
where, R(x), the penetrating distance of characteristics of x-ray in μm, E0 the accelerating voltage in kV, Ec the critical exciting energy of the characteristic x-ray for the element, necessary to eject an electron from the inner K, L, M shell in kV, ρ the atomic density in g/cm3. Figure 4.32 shows the tested contaminated surface. Table 4.15 give the atomic percentage of materials found at the testing point.
TABLE 4.15
Elements Atomic Percentage versus Accelerating Voltage E0 ((kV))
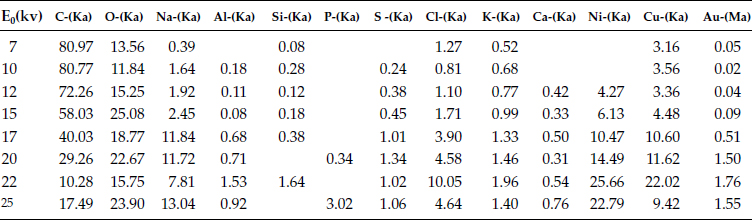
As the accelerating voltage is increased to E0 = 12 kV, the Ni concentration jumps from zero atomic percentage to 4.27 atomic percentage. As the accelerating voltage continues to increase the concentration of Ni also increases, but there is no step jump in the Ni concentration. Thus it can be seen that at E0 = 12 kV can be considered the turning point at which the penetrating x-ray has reached the top edge of Ni plating. It can be seen that dust elements such as Si, Al, K, Na, Ca are accompanied by S, Cl, and Ni and are gathered at this surface. Using the above equation, thickness of the contaminants can also be roughly calculated. The result is very close to the measurement of 3D profilometry. Thus the corrosion products can trap the particles and attach them to the Ni surface. If a normal force is applied to particles, hard particles in dust can be embedded into the metal surface. The trapping effect following the embedding effect make the particles tightly fixed to the metal. This can result in a strong friction effect when a force attempts to push the particles away. After cleaning off the contaminated particles at a failed contact surface, pits and tracks can be seen that shows the hard particles have been embedded into the surface of the Ni under plate, see Figure 4.33a and Figure 4.33b. The grey stains display the Ni under plate where the gold plated layer has been almost completely worn away.
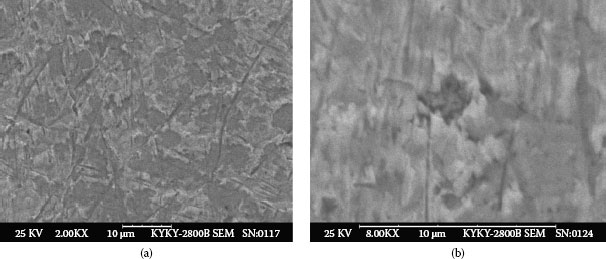
FIGURE 4.33
(a) Irregular tracks and loss of the gold areas (b) Pits with irregular sharp edges.
4.4.1.7 Difference Between Short Life and Longer Life Contacts
SEM/XES testing has been made on contaminated contact surfaces for 4 failed mobile phones with a short life time (~3 months) and for 4 failed mobile phones with a longer life time (~11 to 12 months). 404 testing spots are examined for the short life phones contacts and 122 testing spots are examined for the longer life phones. Statistical results show that for the short life phones, more carbon, organics and silicates are present, but fewer corrosion products. The longer life mobile phones show the opposite result: more corrosion and less carbon, organics, and silicates are seen. This shows that although corrosion trapping may occur at the same time as the adhesion of the organics on the contact, the corrosion trapping probably needs a longer time to attach the particles onto the contact surface. The fact also shows that those mobile phones with very short life duration must have been working in conditions with a high density of particles and a high concentration of organics such as sweat or lactates. The attached particles either by trapping or adhesive effect may have helped the particles to be embedded into the contact surface. Even if they are only partially buried the two sides of contact could be isolated by the exposed particles. Thus, contact resistance greatly depends on the volume resistivity and surface resistivity of the exposed particles.
4.4.1.8 Large Pieces of “Stepping Stones”
Particles embedded into the contact surface not only are difficult to be pushed away, but they also provide a blockage preventing other particles to be moved forward. As more particles are embedded, they become a fence to stop and accumalate even more particles. Thus a large growth of embedded particles appears. During micro motion these large particles can serve as “stepping stones” to decrease the inclined angle for the probe to climb over a surface lump.
4.4.1.9 The Performance of Failed Mobile Phones
The above special features of failed connector contact surfaces due to particle contamination can cause serious result to the performance of the mobile phone: the electrical contacts are different from that of the other electrical components. Failure of others can be tested before they start to operate. But for the connectors, there is a time delay for the contacts to fail because they need time to accumulate particles and organics or for the corrosion products to grow up. Therefore, when connectors are new, even the gold plating has serious defect, the problems can not be discovered. Contact failure can be occurred suddenly without any alert. And some times they can be self healed to operate again since micro motion at the interface can change the location of the contact. To investigate the micro contamination and find out the high resistance region is a very difficult task, because the particle contamination is not visible by bare eyes or even by optical microscope. High magnification and precision equipment are required.
The special features due to particle contamination for different kinds of connectors and with various application conditions may not be the same. However, there are some factors in common: Irregular micro motion, tiny particles accumulation especially including silicates, adhesives and attachments such as corrosion products and organic materials, humidity and temperature cycling, defects of the surface plating etc.
Various connectors with different applications and conditions may appear differently.
An example of failed bus bar and clips caused by serious dust particles contamination were found. Strong corrosion products mixed with heavy dust particles were covered on contact surfaces of both bus bar and the clips. The thick insulated layer caused arcing and stress relaxation of the substrate metal.
Another example was the electric bolt type connectors used in the outdoor power line system in China. Serious stress corrosion was found on the washer which was used to tighten the bolt screw with the nuts. However since the washer was totally cracked and broken, so the screws were loosened, dust particles could squeeze into the contact area. The contact areas were filled with thick layer of contaminants. They were mixture of corrosion products and dust particles. Interesting thing is that the wear tracks were not only in x and y directions, but also something like twisting and rocking. It is probably due to the swinging of wire in windy days and different seasons [42]. Arcing is also found at the contact surface which shows that the contaminant covered on the contact is almost insulated.
4.5 Theoretical Analysis of Connector Contact Failure Due to the Dust
4.5.1 Two Micro Worlds in Contact
As it is shown by J.B.P. Williamson [43], a pair of metallic surfaces in contact actually is two micro worlds in contact. The real contact area depends on the deformation of the micro peaks of two surfaces in connection; Influencing factors are the normal force, micro peaks height and their distribution, depth of micro valleys as well as the surface hardness of the metals. Therefore, from a micro point of view, there is a large gap or space between the two contact surfaces which can accommodate small particles. Figure 4.34, illustrates a new contact pair with average roughness Ra = 0.26 μm, 29 micro peaks are spread on a length of 149 μm (for simplicity, only x profile is considered). The average distance between peaks is 5.15 μm. Maximum peak height is 0.65 μm; maximum depth of micro valley is 0.82 μm. Assume the particle is a sphere, thus the largest particle size accepted by the contact pair can not exceed 1.6 μm. Practically the size of particles should be much smaller. When the contact surface has been worn out to make the surface rougher, accepted particle size can be larger.
Some analysis for the harmful particle size in the previous literature are based on the macro point of view, the calculation result is around several tens of microns which is much larger than the practical particle size tested on the failed contact surface.
4.5.1.1 Particles Get into the Contact Interface
As illustrated above, a spherical shape of probe is in contact with a plain coupon surface. When the contact pair is exposed in dusty environment, particles with various sizes are deposited on the coupon surface. During sliding or micro movement in various directions, the large particles will be blocked by the micro peaks of the surface and stay outside of the contact, only the small particles are able to move into the gap of the interface. In other words, the size of the particles that can get into the contacts and accommodate at the contact interface depends on the morphology of both contact surfaces. New connector contact with very low surface roughness say 0.2 μm can reject the particles larger than 2-3 μm. But a frequently used contact with worn out and rough surface may accept larger particles to get into the interface.
4.5.2 “Preliminary Attachment”
As micro movement occurs at the contact interface, particles can be pushed by the micro peaks of one side of the contact surface as shown in Figure 4.34. When particles meet micro peaks of the other side of the surface which can block the particle to move forward, particles could turn to other directions since particles are free from moving or even rolling around. If particles are adhered by some kind of organics, then separated particles are connected together as a group by the adhesives. Thus the probability of meeting the opposite micro peaks is greatly increased, and there may not provide enough space for the group of particles to move away. Some of the particles may be attached by the other side of micro peaks at the interface; this is considered as “preliminary attachment.” The micro peaks of one side of the contact may climb on the particles, and part of the normal force can be transferred to the particles. If the normal pressure applied on the particles is higher than the yield strength of the surface metal, particles can be embedded into the surface, thus “final attachment” may happen. The only way to move such kind of particle away is to dig the particles out of the surface to create wear debris and remain pits or wear tracks on the contact surface.
A simulation experiment has been done to verify the above description: small SiO2 particles were spread on clean coupon surface without any organics, fretting was applied on the coupon. Figure 4.35a illustrates that the particles were scattered away. Figure 4.35b shows that contact resistance was kept at very low and stable rate. Results verified that no particle was inserted at the interface.
Another clean coupon was dipped in sodium lactate at room temperature. After dry up process, same amount of small SiO2 particles were spread on the coupon. During fretting, particles were adhered together as shown in Figure 4.36a. Contact resistance during fretting could be as high as it was insulated, illustrated in Figure 4.36b.
Experimental result showed that the evaporation of lactate kept at 60°C for 40 days was equivalent to dipping the contact samples into the alcohol solution with 0.5% of lactate and then dried up at room temperature [44]. Further test verified that 0.5% of lactate could act as both adhesive for dust particles and lubricant for metal surfaces. Concentration of lactate higher than 3%, the film was too thick so that the particles could be floated and moved away during fretting and kept very low contact resistance [45].
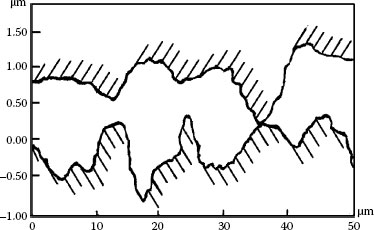
FIGURE 4.34
Illustration showing two sides of a contact pair just touching.
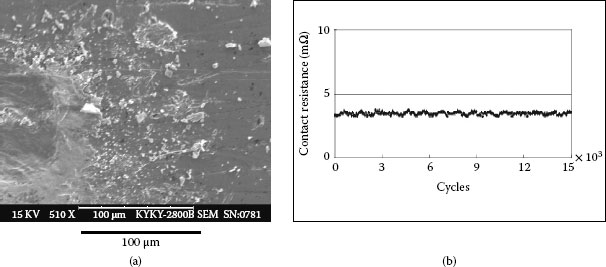
FIGURE 4.35
(a) Particles are scattered away with no lactate on the contact surface (b) Contact resistance versus fretting cycles no lactate.
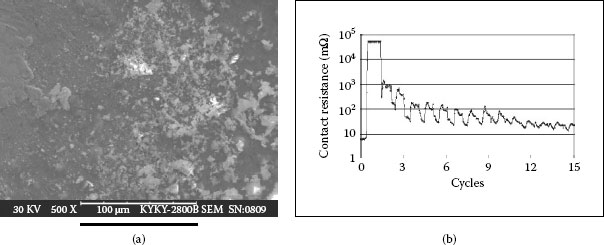
FIGURE 4.36
(a) Particles are adhering in groups with lactate on the contact surface (b) Contact resistance versus fretting cycles with lactate.
4.5.2.2 Trapping Effect of Corrosion Products
Trapping effect was also simulated in the lab for verification of its preliminary function of attachment on the contact surface. Clean coupons were dipped in 1% of NaCl water solution. After dried up, small SiO2 particles were spread on the coupons. Six cycles of humidity and dry up procedure were applied on the coupons and then the coupons were mounted on the fretting machine for experiment and contact resistance measurement. During fretting for 5,000 cycles, contact appears insulated. Figure 4.37a illustrates the corroded dusty contact after fretting. Figure 4.37b shows the enlarged area of rectangular square. The dark small areas were the particles embedded in the contact. Another experiment with same kind of dusty coupons but without dipping NaCl solution were undergone the same humid cycling and measurement of contact resistance. No apparent corrosion was found, and contact resistance was kept at 1-2 mΩ.
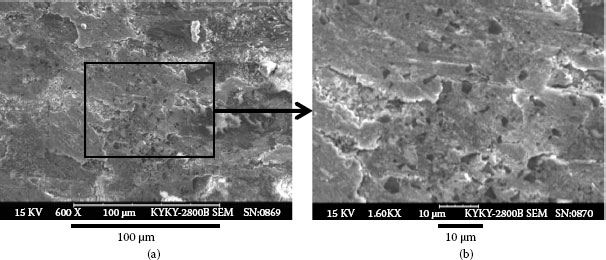
FIGURE 4.37
(a) A corroded dusty contact after fretting. (b) The enlarged area of rectangular square in (a).
4.5.3 Contact Failure Mechanism
4.5.3.1 Single Particle and Ideal Model
Figure 4.38, illustrates a single and spherical particle in contact with an ideal probe and coupon [46]. Failure condition is, if probe is pushed and climbed on the particle, lifted up from coupon surface, contact resistance depends on the particle resistance that may cause failure. In the figure, F1, F2, F3 are the pushing forces. are frictional forces. N is normal force. N = Ns + Np. Ignore the surface deformation, F is the force to push the probe to move and climb over the particle.
When the probe moves away from the original position and climbs on the particle surface, the particle itself should not be pushed away, i.e., the following conditions have to be satisfied.
Where, μ3 is friction coefficient between probe and coupon. If a thin layer of lubricant is coated on the metal surface, the friction coefficient μ3 could be lower than 0.1.
μ1 is friction coefficient between probe and particle. This friction coefficient depends on particle surface roughness and lubrication effect. When micro valleys of particle surface are filled with tiny carbon particles and particle surface is also coated with a thin layer of lubricant, friction coefficient between probe and particle can be very low either.
μ2 is friction coefficient between particle and the coupon. If particle is trapped by the corrosion product, frictional coefficient depends on shearing strength between corrosion product and the metal. When the particle is in “preliminary attachment” to the coupon, the probe may partly climb on the particle, part of the normal force could be transferred to the particle thus the particle may be embedded into the coupon surface, the friction coefficient could be very high.
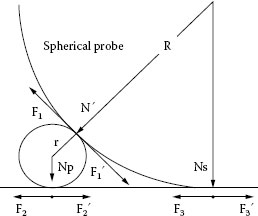
FIGURE 4.38
The condition for a probe to climb on a particle (exaggerated).
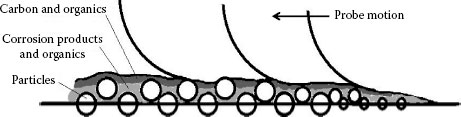
FIGURE 4.39
Layers of particles piled on top of each other may act as stepping stones.
4.5.3.2 Complicated Model - Number of Particles and Morphology of Contact Pairs
Based on the description of “preliminary attachment” and “final attachment,” a more complicated model is attempted for simulation as shown in Figure 4.39. The first layer of particles are half buried in the contact surface. The second and third layer of particles are piled upon them. All the particles are surrounded by corrosion products, also mixed with very small amount of organic adhesives. Carbon particles are covered on top. Figure 4.39, illustrates that the accumulated particles are acted as “stepping stones” for the probe to climb.
The height of accumulated particles is not as high as it was expected. Testing result shows that it is around 1.5 to 3 μm. That is because the contact force is repeatedly pressed upon the particles, the indentation depth is getting deeper.
The importance of micro movement for the connector is that during the movement, particles of high resistance can be collected from vicinity areas which depend on the tolerance of the moving direction and changeable moving distances. The fretting machine should be thoughtfully designed. From micro point of view, moving distance can be ranged from several tens of microns to few hundreds of microns.
Since lactates can dissolve in water, the resistivity of lactates will not be very high as that of the other organic materials. However, only very small amount of lactates are acting in the accumulated particles, and when the environment is very dry, with certain amount of silicates and other insulated materials involved, the total resistance can be high enough to cause contact trouble.
4.6.1 Dust Test for Connectors
Several dust tests for connectors have been attempted to use. Unfortunately, the results were not satisfactory. Very little failure was found during the test which could hardly reflect the practical field application. The cause of unsuccessful tests can be summarized as follows:
1. Particle size used in the test was too large which can hardly be accepted by the connector contact interface. For instance, Arizona dust which is mainly sand particle has been used as artificial dust in the test. Most of the particle size is larger than 5 μm.
2. Fretting machine and sliding machine used for dust test provide only one moving direction with a fixed moving distance. Wear debris and dust particles could be collected only within a straight moving line. It is not possible to collect particles with high resistivity from the vicinity areas. Even though particles are pushed to the end of the path and piled up as a lump but the probe or rider is restricted to go further to climb on the particles. In fact, the more accurate the moving, the less the failure could possibly appear.
3. Particles are separated with each other, during sliding or micro motion, they are scattered away. There is lack of materials to hold them together.
4. Water soluble salts are not contained in the material list of artificial dust. Therefore, the effect of trapping the particles by corrosion product will not appear. Even the salt is consisted in the list, but they are separated large crystals. In humid environment, corrosion products can be grown up separately with dust particles, no trapping effect is occurred.
5. The test procedure is too simple, which is not the combination and interaction effect of many parameters that should be considered.
4.6.2 Suggestion of the Dust Test
It has to prepare and study the influencing factors prier to set up the test system. Still take China as an example, due to the complexity of dusty environment; the environments can be sorted as: north and northwest of China, coastal areas, industrial cities, acid rain areas, crowded cities consuming large quantities of petroleum and coal etc.
The application conditions are even more complicated, roughly they can be sorted as indoor and outdoor, low signal control or telecommunication, high current applications, kinds of organic materials involved etc.
As for mobile phone used in north area of China, the special influencing factors are: salty dust particles, lactates as adhesives and lubricant, micro movement etc. A common artificial particle list can be given comprising particles with quartz, feldspar, mica, calcite, gypsum, etc. Particle size ranges from 0.5 to 3 μm. All the particles should be dipped in the salted distill water before spreading on the test coupons or PWB. The coupons are coated with diluted lactates preferable 0.5% in alcohol solution before located in the dust chamber. A dust chamber with humidity and temperature cycling control system is provided. Fully dry up is a very important stage in the cycling procedure. Fretting machine should be redesigned and manufactured. The machine can be controlled with x and y directions and changeable distances according to the tolerances of the tested connector contacts and possible effect of external impact and vibration. A new software system controls the moving action which may collect the least required particles and testing the contact resistance as well.
4.6.3 Minimizing the Dust Problem
Some approaches include protecting the contacts and making them less sensitive to the presence of environmental dust. Some specific methods, addressing improvement of local environmental conditions during manufacture and operating conditions are briefly discussed.
Air blown cleaning the relay contact as part of the final assembling stage before sealing seems to be insufficient, because particles may attach on the wall and other parts inside the relay. After external impact or vibration as well as internal electric field attraction, particles can move to the contact surface. Therefore, it needs longer time for the air blown from various directions to clean away all the particles from every corner inside the relay.
Experimental result shows that the substrate of surface exposed to ultrasonic cleaning in acetone and alcohol for more than 15 minutes, the dust particles were removed noticeably. It was also found that surface was almost dust-free after 30 minutes of ultrasonic cleaning in water, in alcohol, and in acetone. There seem to exist opportunities to optimize ultrasonic cleaning. The common frequency range of ultrasonic cleaners is 17.2 to 21.8 kHz, which may be too narrow for efficient removal of dust particles of various sizes. Optimization of ultrasonic cleaning must also consider the amplitude of the ultrasonic field, the orientation of the surface to be cleaned relative to the field, the duration of ultrasonic exposure, and the fluid used for carrying energy to the surface. Acetone and alcohol are used to get rid of the organic materials such as wax and liquid lubricants remained on the substrate surface after punching process, Water is superior for removing particles out of the surface.
In China, for a factory which manufactures electronic equipment, the following principles are proposed: Double layer of glass windows, rubber or plastic seals for the door frames are necessary; the wall including ceiling and floor must not create particles; forests and grasslands should be planted surrounding the factory and in neighboring community; Air condition, filters are needed, room humidity should be controlled. It is suggested to build a fountain at the outdoor to keep the air wet and reduce the floating dust particles in air. The fly ash emission from all smoke stacks should be strictly controlled.
4.6.3.1.4 Sealed the Whole Plating Process
Exposure of the electro plating process in dusty environment is extremely harmful. It is necessary to seal the plating baths and filter the plating solutions. The atmosphere close to the plating lines must be kept dust-free.
4.6.3.1.5 Improvement of Packaging Design for Electronic Equipment
An effective damping system to mount on both sides of the connector contacts is necessary. It is expected to reduce the micro movement caused by external impact and vibrations.
Avoid or shield the electric field closed to the contact area.
Filters close to the inlet should be easy to change and clean.
The path of air flow from outside through the slots to inside and to the connector or near the contact area should be designed as a zigzag way or a maze with number of blocks. Since this subject involves various fields of science: electronics, tribology, surface material science, electro chemistry, organic chemistry, etc. To analyze and solve the problems need scientists and engineers of different fields to work and cooperate together.
1. J.B.P. Williamson, J.A. Greenwood and J. Harris, “The Influence of Dust Particles on the Contact of Solids,” Proc. Royal Society of London, UK, 237, 1956, p.560.
2. K. Mano, “Contact Failure by Dust Contamination,” Reliability of Contact Components, General Electronics Publisher, Japan, 3rd edition, June 15, 1981, p.92.
3. B.T. Reagor and C.A. Russell, “A Survey of Problems in Telecommunication Equipment Resulting from Chemical Contamination,” Proc. Holm Conf., 1985, p.157.
4. K. Mano, “Testing method of Environmental Powder for Electro-mechanical Components” Proc. Relay Research Meeting, Japan 1989, p.393.
5. N. Honma, H. Okamoto and M. Yamaguchi, “SOx and Dust Concentration in Contact Atmosphere,” Proc. Holm Conf., 1980, p.287.
6. J.T. Ma, “Determination of Equipment Reliability Rating by Calculating Statistically the Failure in the Field Operation,” Proc. IC-CEMCA, Nagoya, Japan 1986, p.703.
7. J.L. Mezec, “Electrical Contacts for use in Tele-Communication Equipment,” Proc. 14th ICEC, 1988, p.81.
8. R.C. Robbins, “Economic Effects of Air Pollution on Electrical Contacts,” Proc. Holm Seminar, 1973, p.80.
9. W.H. Abbott, “The corrosion of Copper and Porous Gold in Flowing Mixed Gas Environments,” Proc. Holm Conf., 1989, p.141.
10. L. White, “Development of a New Connector Dust Test,” Proc. Holm Conf., 1987, p.87.
11. C.A. Hague, M.D. Richardson and E.T. Ratliff, “Effects of Dust on Contact Resistance of Lubricated Connector Materials,” Proc. Holm Conf., 1985, p.141.
12. P. Slade. Electrical Contacts, Principles and Applications. Chapter 2. Introduction to contact tarnishing and corrosion. 1st edition, ISBN 0-8247-1934-4, Marcel Dekker, Inc., 1999, p.109.
13. J.G. Zhang, K.D. Zhou, C.X. Du, “The Porosity of Gold Plating by Dust Contamination,” Proc. 34th IEEE Holm Conf., Sept 1988, p.301.
14. Ji Gao Zhang, “Particle Contamination, the Disruption of Electronic Connectors in the Signal Transmission System,” J. Zhejiang University Science A ISSN 1862-1775, 2007, 8(3): 361-369.
15. Y.N. Liang, J.G. Zhang, J.J. Liu, “Identification of Inorganic Compounds in Dust Collected in Beijing and Their Effects on Electric Contacts,” 43rd IEEE Holm Conf. 1997, p.20.
16. J.G. Zhang, Y.N. Liang, J.W. Wan, B.S. Sun, “Analysis of Organic Compounds in Airborne Dust Collected in Beijing,” Proc. 44th IEEE Holm Conf., 1998, p.166.
17. J.W. Wan, J.C. Gao, X.Y. Lin and J.G. Zhang, “Water Soluble Salts in Dust and their Effects on Electric Contact Surfaces,” Proc. ICECT. Nagoya, Japan, July 1999, p.37.
18. J.C. Gao and J.G. Zhang, “Measurement of Electric Charges Carried by Dust Particles,” Proc. 48th IEEE Holm Conf., 2002, p.191.
19. J.G. Zhang, C.H. Mei and X.M. Wen, “Dust Effects on Various Lubricated Sliding Contacts,” IEEE Trans. CHMT, Vol.13, No.1, March 1990, p.46.
20. J.G. Zhang and P. Yu, “Electric Contact Performance: Effect of Contact Surface Morphology and Size of Dust Particles,” Proc. 15th ICEC/36th Holm Conf., Montreal, Canada, 1990, p.402.
21. Z.K. Chen and G. Witter, “Contact Resistance Failure in Relay Assembly Process,” Proc. 1st International Conf. on Reliability of Electrical Products and Electrical Contact ICREPEC, Suzhou, China, Aug. 2004, p.68.
22. C. Leung, V. Behrens and G. Horn, “Review of Automotive Electric Contact Reliability and Research,” Proc. 1st International Conf. on Reliability of Electrical Products and Electrical Contact ICREPEC, Suzhou, China, Aug. 2004, p.17.
23. J.G. Zhang, J.C. Gao and C.F. Feng, “The Selective Deposition of Particles on Electric Contact and their Effect on Contact Failure,” Proc. 51th IEEE Holm Conf., USA, 2005, p.127.
24. Appendix: “Hardness of Materials in Mohs” in “Effect of dust contamination on electrical contact failure,” Proc. IEEE Holm Conf., 2007, p.xxix.
25. J.G. Zhang and X.M. Wen, “The Effect of Dust Contamination on Electric Contacts,” IEEE Trans. CHMT, Vol.9, No.1, March 1986, p.53-58.
26. R. Holm Appendix I, F, “The Ball and Pyramid Indentation Test for Hardness,” Electric Contacts, Theory and Applications, 4th edition Sprinber-Verlag Berlin/Heidelberg/New York, 1967, p.373.
27. Y.L. Zhou, Y. Lu, H. Wang, A.L. Ma and H.D. Liu, “Electrical Contact Behavior of Several Typical Materials in Dust,” Proc. 56th IEEE Holm Conf./25th ICEC, USA, 2010, p.520.
28. R.H. Horn Chapter 10, “Semipermanent and Permanent Pressure Connectors” Physical Design of Electronic Systems Vol III, ISBN 0-13-666370-2 Prentice-Hall Inc. p.595.
29. J.J. Mottine and B. Reagor, “The Effect of Lubrication on Fretting Corrosion at Dissimilar Metal Interfaces in Socket Device Applicasions,” Proc. Holm Conf., 1984, p.171.
30. J.G. Zhang, “The Application and Mechanism of Lubricant on Electrical Contacts,” Proc. 41st Holm Conf., Chicago, IL.USA. Oct. 17-19, 1994, p.145.
31. J.G. Zhang, L. Tang, C.B. Shao and J.T. Ma, “Floating and Moving Abilities of Particles on Lubricated Sliding Contact Surfaces,” Proc. 17th ICEC, Nagoya, Japan, July 1994, p.381.
32. J.G. Zhang and W. Chen, “Wipe on Various Lubricated and Non-Lubricated Electric Contacts in Dusty Environments,” IEEE Trans.CHMT, Vol.14, No.2, June 1991, p.309.
33. X.Y. Lin and J.G. Zhang. “Dust Corrosion,” Proc. 50th IEEE Holm Conf./ICEC, 2004, p.255.
34. X.Y. Lin and J.G. Zhang, “Properties of Corrosion Stains on Thin Gold Platings,” Proc. 48th Holm Conf., Orlano, Fl, USA, Oct 2002, p.156.
35. X.Y. Lin, “Dissertation “Atmospheric Corrosion on Connector Contact Surface” PhD Dissertation, BUPT, 2009, p.59.
36. J.G. Zhang, X.Y. Lin, Y.L. Zhou and J.B.P. Williamson, “Tidal Corrosion and Concentric Rings on Gold Plated Contacts,” Proc. 20th ICEC, Stockholm, Sweden, June 2000, p.303.
37. Yi-Lin Zhou, Xue-Yan Lin and Ji-Gao Zhang, “The Electrical and Mechanical Performance of the Corroded products on the Gold Plating after Long Term Indoor Air Exposure,” Proc. 46th Holm Conf. Chicago, IL, USA, Sept. 2000, p.18.
38. J.G. Zhang, “Effect of Dust Contamination on Electrical Contact Failure,” 53rd IEEE Holm Conf. on Electric Contacts, Pittsburg, PA, USA, Sept. 2007, p.xiv 43.
39. J.G. Zhang, “A Summary Report on the Mechanism of Electric Contact Failure due to Particle Contamination,” 57th Proc. IEEE Holm Conf., USA, 2011, p.197.
40. C. Feng, J.G. Zhang, G. Luo and V. Halkola, “Inspection of the Contaminants at Failed Connector Contacts,” 51th IEEE Holm Conf. on Electric Contacts, Chicago, IL, USA, Sept 2005, p.115.
41. J.I. Goldstein and H. Yakowitz, “Practical Scanning Electron Microscopy,” ISBN 0-306-30820-7, Plenum Press: NY, 1975, p.83.
42. G.P. Luo, J.G. Lu and J.G. Zhang, “Failure Analysis on Bolt-Type Power Connector’s Applications,” 45th IEEE Holm Conf. USA, 1999, p.77.
43. J.B.P. Williamson, “The Microworld of the Contact Spot,” 27th Proc. Holm Conf., USA, 1981, p.1.
44. Y.L. Zhou, Y. Lv and H. Wang, “The Influence of the Organic Compounds on the Contaminated Electrical Contacts,” Proc. IEEE 57th Holm Conf., USA, 2011, p.317.
45. Y.L. Zhou, Y. Lv, L.B. Lin, “The Role of Organic Compounds in Simulation of Dust Environments for Electric Contacts,” Proc. 26th ICEC/4th ICREPEC, Beijing, China, 2012, p.45.
46. J.G. Zhang, L.J. Xu, J.C. Gao and C.F. Feng, “Further Studies of the Mechanical Behavior of Particles on Electric Contact Failure,” Proc. 24th ICEC, France, 2008, p.284.