
Arc Interactions with Contaminants
What is this life if, full of care,
We have no time to stand and stare.
Leisure, W. H. Davies
CONTENTS
19.2 Organic Contamination and Activation
19.2.2 Sources of Organic Vapors
19.2.3 Processes of Contact Activation
19.2.5 Activation and Contact Resistance Problems
19.2.6 Methods for Detecting Carbon Contamination
19.3 Mineral Particulate Contamination of Arcing Contacts
19.4 Silicone Contamination of Arcing Contacts
19.4.1 Contamination from Silicone Vapors
19.4.2 Contamination from Silicone Migration
19.4.3 Summary of Silicone Contamination Mechanisms
19.5 Lubricants with Refractory Fillers
19.6 Oxidation of Contact Materials
19.7 Resistance Effects from Long Arcs
This chapter will deal with contamination of arcing contacts. The emphasis will be on the effects of contact contamination as a result of arc interactions with contaminants and the contact material in contrast to contaminant and contact interactions from corrosion mechanisms discussed in Chapters 2, 3, 4, and 8. This is a broad subject and with many potential combinations of contaminants, contact materials, and electrical loads, so only the more common problems that have been studied and published will be discussed. The chapter begins by discussing organic contamination and contact activation, and includes references to a large long-term study mainly done by Bell Labs from 1950s through 1970s for telecommunication relays. This study uncovered many contact fundamentals that were useful in other contact applications. Another section discusses silicone contamination of contacts that continues to be a problem, although warnings about silicone compounds have existed for many years. Some of the basics for silicone vapor deposition and migration are discussed including relationships to electrical loads. It should be kept in mind when reading about specific examples of arc–contamination interactions given in this chapter that the results may be quite different when other electrical and mechanical load conditions from those cited in the specific example are used.
19.2 Organic Contamination and Activation
Often the ambient air of switching contacts is contaminated by organic vapors either from outside a switch or produced by components inside the switch. Such organic contaminants may be adsorbed on the contact surfaces and build polymers, especially under the influence of friction between closed or dry switching contacts, as discussed in Chapter 7. In this section, the influences of arcing on the organic contaminants already introduced in Chapter 10 are discussed in more detail.
For applications where the current level is low, in the range of 1 A or less, adsorbed organic vapors may greatly reduce the switching life of noble and silver-based contact materials. For example, transient arc discharges appearing at loads below the minimum values of current and/or voltages required for steady arcs (Sections 9.5.4 and 10.2.4) may be just strong enough to crack such adsorbed organic molecules and convert them by pyrolysis into carbonaceous particles that build up on the surface with continued switching operations. Such produced deposits of carbon and heavily cracked molecules may enhance arcing under the same electrical load conditions for which transient discharges are hardly detectable on the initially clean contacts. This process, which extends the duration of the arc and thus increases the arc erosion, is called “contact activation” and has been studied by numerous researchers [1,2,3,4,5,6]. Germer, one of the key pioneers for researching this subject, first defined activation as a condition in the contact surfaces that increases the arcing when the contacts are made or separated as compared to that which occurs when the contacts are clean [7].
Most of the work done for studying activation was in connection with research on signal relays for telecommunications. In these applications the current level was low, normally less than 1 A, and the switching life requirements for these relays was very long, many millions of operations. At these low currents, contact activation could lower the minimum current required for an arc to occur and thus could extend the arc duration by an order of magnitude and this resulted in a similar decrease in relay life. Carbonaceous deposits produced by pyrolysis of organic compounds could also increase the low resistance between clean metal contacts (milliohm range) to values typical of carbon contacts (ohm range). These problems are not limited to signal relays but other switching devices operating in the low-current range such as load relays, microswitches, and thermostats. For higher-current devices the relative effects of activation on contact erosion are less than for lower-current applications and also the build-up of carbon is less pronounced. Later in this chapter it will be shown that activation can have a different effect on higher-current switching.
19.2.2 Sources of Organic Vapors
The sources for organic vapors are ubiquitous. Contacts in open switches may be exposed to vapors transported by the surrounding air from outside the building, car exhaust, industrial gases, refinery gases, or from indoor sources, electronic devices, electrical apparatus, etc. [8,9,10,11,12]. For example, more than 300 organic vapors have been identified in Skylab 4 [13] while 40 kinds of vapors have been detected emanating from two control devices at 65°C [14]. More problematic are those vapors that cannot be eliminated by sealing the housing of a device because the sources are from components of the device itself [5,15,16,17,18,19] that emit organic vapors particularly during internal or external heating of the device. An example of this for relays is the insulation on the relay coil which often contains the plasticizer diethyl phthalate, DEP. The internal heating of the coil during use can accelerate vaporization of DEP from the insulation. Levels of DEP as low as 3 p.p.m. have been shown to produce significant activation [5]. Researcher have also identified other organic vapor sources such as insulating materials with additives and greases and oils [12,20,21,22,23]. To prevent activation by internal components, work has also been done on baking components. The effectiveness of baking for reducing emanation of gas has been found to depend on the material [12,21,23,24].
19.2.3 Processes of Contact Activation
The activation process for electrical contacts involves four steps as follows:
1. Adsorption of organic vapors onto the contact surface
2. Pyrolysis of the organic films because of arcing, which produces deposits of carbonaceous particulate on the contact surface
3. Extended arc duration as a result of the carbonized particulate
4. Increased erosion owing to the increased arc duration [6]
The activation process involves many variables including, type of organic, type of metal, organic vapor pressure, type of carrier atmosphere, contact surface cleanliness, surface roughness, circuit load and energy type, rate of switching, and more that form many permutations that may or may not result in activation [2,7,25]. From the above it can be seen that the activation process does not just involve exposure to organic materials but usually requires more than 100 and sometimes thousands of switching operations before extended arc duration is detected [7]. Augis reported that insulating adsorbed monomolecular layers of water or organic, alone, were able to extend arcing [26]. This work involved very short, nanosecond range, anodic transient arcing conditions and such insulation layer activation effects are not the typical conditions detected for operating devices [5,25].
Initial research on activation led researchers to believe that activation is not produced by all organic gases. In later work it was found that, depending on the organic gas and metal combination, critical concentration levels required to produce activation can vary by several orders of magnitude. For example Koidl et al. show a concentration of 100 volume parts per million (v.p.m.) of toluene can activate palladium, while for the combination n-hexane and silver a concentration of 10,000 v.p.m. is needed [27]. It is now thought that activation may be possible for most organic gas and contact alloy combinations, but the concentrations and conditions for activation may be quite different [28]. Germer found, and Koidl later confirmed, that vapors of unsaturated ring hydrocarbons seem to favor activation over saturated ring compounds or straight chain compounds [2,7,27], but exceptions exist. Work by Takenaka et al., done 40 years later, reached a similar conclusion [29]. The specific combinations of metal type and organic compound type are critically important for determination of the potential for activation [30]. Table 19.1 shows a list of compounds tested by Germer for silver contacts and the results for either activation or no activation [2]. The condition of the surface is important to the activation process. When compounds are firmly adsorbed on the contact surface, they may decompose rather than vaporize without decomposition [2]. For example, benzene is not adsorbed firmly enough on clean silver to activate but will if the silver is contaminated by an oil film such as a fingerprint. Styrene, on the contrary, is very effective for activation of clean silver surfaces [2]. For certain metals, such as silver, the adsorption of some organic vapors is enhanced by already adhering carbon atoms from greases or CO2 decomposition, while others such as platinum can absorb compounds such as benzene without prior contamination [2,31]. For gold, the critical concentration of organic vapors was found to be intermediate between silver and palladium, one order of magnitude lower than for silver and an order higher than for palladium [27].
TABLE 19.1
Substances and Compounds Which Activated or Did Not Activate Silver Contacts
Activate |
Did Not Activate |
Pump oil |
Ethyl alcohol |
Turpentine |
Amyl alcohol |
Penetrating oil |
Ether |
Kerosene |
Carbon tetrachloride |
Butyl alcohol |
Trichlorethylene |
Benzene |
Hydrogen chloride |
Toluene |
Methyl methacrylate |
Xylene |
n-Butyl acetate |
Pseudocumene |
Amyl acetate |
Styrene |
Ethyl acetate |
Ethyl styrene |
Acetone |
Phenyl acetylene |
Oleic acid |
Cyclohexanol |
Propionic acid |
Cyclohexanone |
o-Dibromobenzene |
Cyclopentanone |
|
d-Limonene |
|
l-Menthone |
|
Pinene |
|
Terpineol |
|
Ethyl silicate |
|
l-Octene |
|
l-Dodecene |
|
Octylene |
|
Crotonic acid |
|
Source: Data from LH Germer, J Appl Phys 22(7): 955–964, 1951[2].
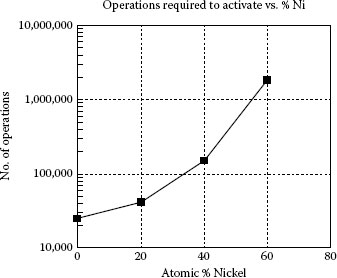
FIGURE 19.1
Resistance to activation for palladium as a function of nickel content.
In general, base metals are very difficult to activate by organic vapors. Palladium when alloyed with nickel becomes more difficult to activate as can be seen in Figure 19.1. Germer was not able to activate pure nickel at all [7]. It can be seen that the activation process is complex and also variable depending on the metal organic combination. To better understand the process a more generalized and simplified look at the process will be taken. The extent of activation, increase in arc duration, is directly related to the amount of carbon particulate that has been generated on the contact surface. During a single arcing operation the carbon and or adsorbed organic material in the area covered by the arc is burned away and new carbon is deposited in an annular ring surrounding the arc area [7]. In air, higher-energy arcs are less efficient at producing activation than low-energy arcs. On the other hand, extremely low arc energies are ineffective in producing carbon. Arc energies on the order of 100 ergs (10 μJ) seem to produce the largest difference between the arc area and annular ring of arc deposition area, and thus more rapidly activate contact surfaces [7]. The amount of carbon generated per pyrolysis operation is also dependent on the amount of organic material deposited per area of contact surface, density of adsorbed organic, carbon atoms per molecule, and surface roughness which affects the true surface area [30,31,32]. The amount of organic material that is accumulated on the surface before an arcing operation is dependent on the concentration of the organic vapor, exposure time, and sticking coefficient of the contact metal and vapor combination. During a series of switching operations, a dynamic equilibrium may be established in carbon balance among the various portions of the switching cycle as follows [7,31,32,33]:
• Contacts in open position with no arcing. During this period, there is a gain in carbon from organic material being deposited onto the contact surface.
• Arcing during opening and closure. During arcing there is a net loss of carbon as a result of several parallel processes taking place, dissociation of the organic material, sublimation and or oxidation of carbon particles, and formation and deposition of carbon particles.
• Contacts in closed position. Assumes no change and no reactions.
For a specific metal and organic compound combination, at a fixed vapor concentration, it would appear that the amount of carbon particulate concentration that is achieved on the contact surface for an established switching schedule would relate to the amount of open time between switching operations, if the adsorption time for saturation of the organic on the contact surface was less than the opening time. Since the activation arc duration is proportional to the carbon concentration, the arc duration should then be related to the contact open time between switching operations. This illustration is for helping in understanding the dynamics of the process and is an oversimplification of the processes.
The effect of operating rate on the arc duration of activated contacts has been studied by several groups of researchers and several models have been proposed [25,33,34]. Gray and Uhrig found for palladium contacts operating in a 5 p.p.m. diethylphthalate (DEP), air environment, the arc duration was 100 μs for opening times greater than 1 s and proportional to the square root of the opening time for times less than 1 s [34]. This work shows and discusses three models that could be used to explain the critical opening time, including classical diffusion of organic vapors to the contact surface as proposed by Schubert [33]. A broader study by Gray, Uhrig, and Hohnstreiter was done with 30 combinations of six different metals and seven different activates [35]. They developed a model for activation level as a function of exposure which correlated well with their actual experimental results. Exposure, η, was defined as the product of the contact open time and the partial pressure, and stated as pascal seconds. A typical activation curve generated for a single combination is shown in Figure 19.2. The model shows three regimes of contact activation varying with exposure level. For low levels of exposures there is the ion-drift-limited region in which arc duration is independent of exposure. For the intermediate exposure range the activation level is diffusion-limited and proportional to the square root of the opening time. At high exposure levels, the activation level is adsorption-site-limited and again independent of exposure. A unique activation curve occurs for each metal-organic pair. At low exposures, organic ions control the activation process and at higher levels of exposure diffusion of neutral organic molecules dominates the activation process. For the ion-drift-limited region no significant differences are noted among the metals or organic materials. The lower critical exposure level, the level at which the diffusion-limited range begins, varies with the different organic compounds as a function of the number of carbon atoms in the molecule (see Figure 19.3). The variation for organic compounds is greater than for metals in the diffusion-limited range. The adsorption-site-limited regime shows indistinguishable organic effects and significant differences among the metals [35]. From Figure 19.3, it can be predicted that organic materials with a large number of carbon atoms per molecule will activate at very low critical exposure levels. Some organic lubricants which contain molecules with a high number of carbon atoms have been observed to cause activation at a few parts per trillion [36]. On the other end of the scale, small molecules, CH4, have not been observed to cause activation [36]. Koidl et al. measured the critical concentrations of various organic vapors in combination with three different contact materials and found a strong correlation between contact compatibility and the molecular properties of the organic vapor, e.g. number of carbon atoms, molecular structure, and volatility [27].
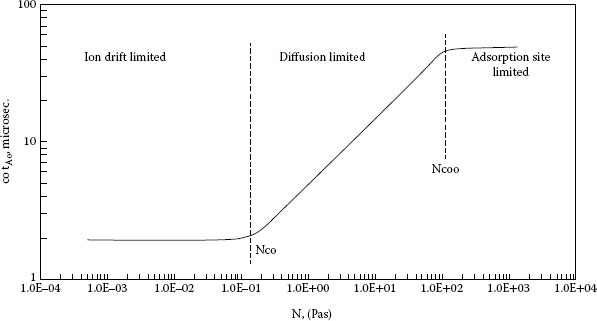
FIGURE 19.2
Activation characteristic curve, critical opening time, tAo, versus exposure, η, in pascal seconds.
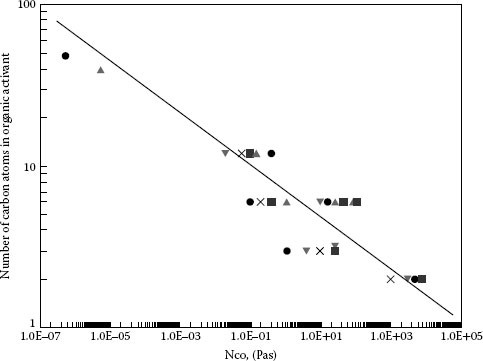
FIGURE 19.3
Critical exposure lower limit as a function of the number of carbon atoms in the organic molecule. (From Gray E.W., IEEE Trans CHMT, 1, 107–111, 1978.)
The activation process lowers the erosion rate for a given discharge energy level, since some of the energy is used to dissociate organic molecules and to evaporate the carbon [37]. The overall erosion for low-current applications, however, is increased by activation owing to the much lower minimum arc current of carbon and consequent increase in arc duration. Noble metal contacts that are activated by organic vapors first see some short sparks that become short arcs that cause severe erosion and loss of switching life compared to non-arcing contacts [2,4,7]. At the other extreme, for contacts switching higher currents, above 2 A, the effects of activation will be insignificant with regard to erosion. The higher current will tend to burn off more carbon and make activation more difficult, and also the extension of the arc duration, by lowering the minimum current, will contribute little extra to the already significant arc erosion that takes place on inactive contacts at higher currents.
The particles generated by pyrolysis of carbon have been found to be in the size range of 10 nm to 3 μm [6]. Other non-carbonaceous particles such as alumina, silica, and copper oxide, have also been found to cause activation, but little has been published about this form of activation [2,6]. A big difference between these types of particles and carbon activation is that the source for such particles is normally from some initial contact between the oxide particles and the electrical contact, and as switching life progresses these particles are eroded away since no vapor or lubricant is continuing to feed more material onto the surface. As a result of this, the effects of oxide particulate activation would normally be limited to the early life of the contacts. An exception to this was found for silicones, which will be discussed later in this chapter.
The discussion thus far has addressed the detrimental effects of activation, but there are also some effects that can be beneficial for the life of contacts. For direct-current switching, material transfer can create pips and craters on contact pairs which greatly limit the life of the contact by causing sticking and welding of the contacts. As a result of the organic activation process the formation of pips and craters is minimized for two reasons as follows:
• Arc movement. For activated arcs carbon is being created at the periphery of the arc and the center of the arc is left clean. As a result of this the arc tends to move from one operation to the next seeking out a new carbon strike point. This movement from point to point results in erosion that spreads over the surface in a more uniform manner than for a non-active contact surface for which the arc can remain in the same place for many operations [7].
• For highly activated contacts the metal transfer from one contact to the opposite one has been observed to be inhibited by the metal not sticking to that contact, but mixing with carbon powder in loose deposits on its surface [7].
Above it was stated that the organic activation process does not have a significant effect on contact operation life for higher-current applications. For a relay operating at high-current, 90 A inrush, with severe make bounce, Witter and Polevoy showed that organic activation of the contacts could greatly reduce pip and crater type erosion [38]. The relay had pronounced pit and crater erosion at 25°C, but relatively flat erosion when operated under the same load at 125°C. By pumping preheated organic free air into the relay enclosure during the 125°C operation, they were able to duplicate the same pit and crater erosion seen for the relay operating at 25°C (see Figure 19.4). This indicates that controlled activation may have the potential for helping prevent pit and crater erosion for devices switching high inrush currents.
19.2.5 Activation and Contact Resistance Problems
The main focus on contact activation in the last section was on carbon deposits decreasing the minimum arcing current and resulting increased electrical erosion and noise for telecommunication circuits. Contact resistance is another problem associated with contact activation. Insulating layers on contacts, organic or inorganic, have to be mechanically destroyed to gain small electrically conducting sites inside the area mechanically touching between two contacts. Such a condition yields widely scattered contact resistance values, from very low to open-circuit values, depending on whether and how successfully the layers were perforated, see Chapter 1. If, however, an organic compound is highly carbonized on the contact surface, the resulting carbon layer behaves as a well-defined semiconductor yielding a narrow range of scatter on the order of 1–10 Ω as a result of the electrical conductivity of carbon and the actual contact force used. This has been observed by numerous researchers [12,16,19,39,40,41] properly identified by Neufeld [42,43,44].
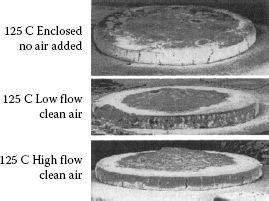
FIGURE 19.4
Relay testing in clean air versus atmosphere inside relay cover.
As stated in Section 19.2.3, in air higher-energy arcs are less efficient at producing activation than lower energy arcs. This is the result mainly from the chemistry of the arc. Low energy ohmic arcs are composed mainly of the elements from the surface of the contact at the area where the arc originates and therefore mainly remain metallic during the initial contact separation containing only the contact metal ions and material adsorbed on the contact surface (see Section 10.3.5). For higher energy arcs there is conversion from the metallic to a gaseous state as the contacts separate further with ions from the surrounding gas atmosphere. Vinaricky and Behrens show the erosion rate of graphite (carbon) increases by about 10 when the arc contains either oxygen or nitrogen as a result of the chemical reactions with carbon. [45]. Therefore, increases in contact resistance owing to carbonization are observed only when interrupting ohmic currents in the range of about 20 mA to 1 A for circuit voltages <24 Vdc where the arcing times are relatively short [46].
Contact resistance measurements under activating conditions for both gold and gold alloy contacts were done by two different research groups with similar results. For one of the studies switching 250 mA current in air with high concentrations of benzene, toluene, and xylene produced similar resistance increases in the range of 500–3000 mΩ [41]. The other study of a gold alloy at 100 mA current showed similar results, 500–2000 mΩ resistance for three organic vapors made from molecules containing six carbon atoms. There was no evidence of activation or resistance from 1,4-butanediol, a four-atom molecule [29].
Koidl, Rieder, and Salzmann [47] studied parameters that influence contact carbon resistance build up in telecommunication relays. Using a model switch operating at ohmic conditions, 10 Vdc and 100 mA, they investigated several parameters. Keep in mind that this is mainly a non-gaseous state. They found that it took lower concentrations of organic gasses to cause activation in nitrogen than in air. They concluded that this must be owing to lack of oxygen to decompose the carbon, but this is questionable for this type of weak arc. Maybe there is enough adsorbed oxygen on the surface of the contact when air is present to react with the adsorbed organic gas. Although this result is very repeatable it needs more work to understand the effect. They also found that higher humidity increased the critical concentration of organic gas needed for activation. This may be an effect on decreasing the amount of organic gas adsorption from the water vapor adsorbed or reaction of the adsorbed water with the organic gas. Again this effect was very repeatable.
The bounce frequency that occurs in relay switching operations has also been found to influence carbon build up by increasing the critical concentration level of organic gases. One thought about this is that increased bounce frequency raised the contact spot temperature and results in more carbon vaporization, a self-cleaning effect.
The overall data show that relays and switches operating in the presence of organic gases in these ohmic current ranges and low contact forces, 10 cN or less, are subject to carbon build up and large increases in contact resistance in the range of several ohms. Devices that operate at higher energy levels that support gaseous arcs normally don’t have these problems with organic vapors since even though carbon particles are generated they are burned off and don’t build up. In this case the carbon may create some benefit from moving the arc spot between operations and prevent pip and crater erosion as pointed out earlier in this chapter.
19.2.6 Methods for Detecting Carbon Contamination
Compatibility of certain organic materials with certain contact materials can be investigated with the aid of special model switches (see Chapter 18).
Carbonization can be detected as follows:
• The contact resistance increases compared to the characteristic contact resistance of carbon contacts (Figure 18.17d).
• For measurements across an opening contact pair, a characteristic plateau occurs in the voltage vs. time curve at a voltage level of 4 V corresponding to the sublimation temperature of carbon, 3650°C, as illustrated in Figure 19.5 [17,42,43,44].
• Minimum arc voltage increases to well above the minimum arc voltage for the noble metal contact and at a current below the minimum arc current of the contact metal [9,36].
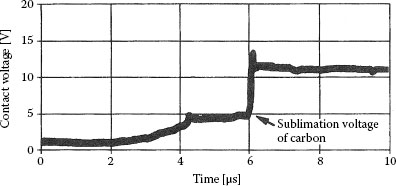
FIGURE 19.5
Contact voltage versus time for contact interruption with carbon present on the contact surface.
19.3 Mineral Particulate Contamination of Arcing Contacts
Mineral particles are present almost everywhere on our planet and finding some mineral particulate on electrical contacts should be no surprise. The effects of dust particulate have been discussed in Chapters 2 and 4 are not the focus of this chapter. Williamson et al. describe the effect of mineral particles on contact surfaces in terms of surface finish, particulate size, particulate concentration, and contact force [48]. They show that as particle size decreases and contact surface roughness increases to the point where the ratio of the particulate size to mean plane height of contact surface irregularities is unity, the probability of high resistance resulting from these particles is low. Also as the contact load is increased beyond what is required to produce a contact area equal to the cross-sectional area of particulate on the contacts, the probability of the particulate creating high resistance decreases rapidly. These same principles apply to arcing contacts in the initial unarced condition but become more difficult to interpret after arcing of the contact surface, owing to immense changes that occur in the particulate distribution and surface topography as a result of the arcing [49].
This section will discuss the effects of mineral particles on arcing contacts in terms of contact resistance rather than activation. Germer has shown that mineral particulate also caused activation [2,7], see Section 19.2.4. For mineral particles in contrast to carbon particles, since sources for building up or maintaining the concentration of the mineral on the contact surface during switching life normally do not exist, mineral particles have little effect on contact life.
With exception to very dusty environments and cases where there is no protective housing for the contacts, the effects of atmospheric mineral deposits on arcing contacts are low. A very small concentration of loose particles, which can be present on contacts from normal atmosphere having low dust content, will be eroded away by the arcing in most power devices. The main concern with mineral particulate is for cases where the concentration is much higher. A common source of mineral particulate contamination in contacts is from media used for removing burrs from fabricated contacts. In 1976, Trächslin [50] reported fine grit embedded in the contact surface for all parts he examined, which included contact rivets from seven different European manufacturers. For deburring and polishing of metal parts a wide variety of mineral compounds is used. Some common materials for deburring are silicon carbide, alumina, silica, and silicates in both particulate and stone form. By tumbling contacts in such media the burrs are worn away but also a portion of the media is left embedded in the contact surface. These refractory materials are not easily removed from the contact since they are chemically very stable. To remove such deposits, the contact surface layers must be etched away beyond penetration by these particles.
From the above cited mineral compounds, it can be seen that most contain the element silicon as a component. As a result of this, many times there is misinterpretation for the cause of resistance problems between mineral particles and silicone materials, organic compounds containing silicon. The large differences between them will become clear on reading this section and the next section of this chapter on silicones.
Witter and Leiper performed several studies for examining the effects of contamination from mineral particulate on resistance [36,51]. For Ag/CdO, 90/10 contacts contaminated with different concentrations of SiC they showed the contact resistance would increase rapidly for the first few dozen operations at 0.5 A and then gradually decrease on further switching (see Figure 19.6). Note that the initial resistance for the mineral-contaminated contact materials was very low and identical to the non-contaminated material. After a single switching operation, the contact resistance increased dramatically, one and two orders of magnitude respectively, for the 3% and 10% by volume SiC-contaminated materials. Under the same conditions the non-contaminated contacts decreased in resistance slightly owing to some cleaning effect of the arc. The reason for the low initial resistance readings and the large change after arcing is explained as follows: the silicon carbide materials, 1–2 μm in size, were embedded into the contact surfaces during the tumbling operation that was used to simulate contamination experienced by deburring. This is what would be expected for tumbling soft materials such as silver alloys with a hard refractory material. Using the principles developed by Williamson et al. [48], no effect of the contamination would be seen if the surface roughness of the contact were greater than the size of the portion of the embedded particle sticking out of the contact surface. In this case although the contamination level was high, the fraction of a micron of particulate that stuck out of the contact surface was insufficient to affect the resistance. When the contact surface was arced, the particles in the arced area were heated and reacted in the arc plasma to form aggregates composed of mixtures of silver and silicon oxides which were fused as deposits over the arced area.
Figure 19.7 is an SEM micrograph of the edge of an area from a single arc. SiC particles, triangular crystalline particles, can be seen embedded in the surface just outside the arced area and the silver-silicon oxide aggregates made of round and amorphous-shaped particles can be seen in the arced area. The arced area is very rough compared to the unarced surface and the individual particles making up the aggregates vary in composition with regard to the silicon to silver ratio. Although the surface is rough, there is no benefit as predicted by Williamson’s work [48], since the aggregates form heaps that are significantly elevated above the unarced surface and the constriction areas are complex with current paths going through a series of many particles and interfaces making up the aggregate heaps. As a result of this, the contact resistance remains elevated but significantly variant as a function of the path required from the contact spots through this thick upraised resistive layer. The contact resistance initially increases with switching operations owing to increased refractory build up on the surface. Depending on the current level and the contamination concentration the resistance begins to decrease at some operation point as the refractory material is gradually eroded away through arc erosion.
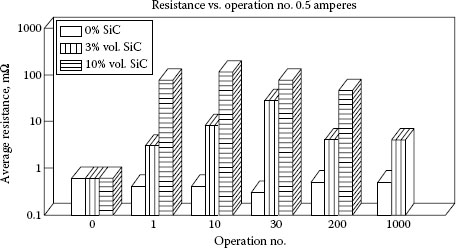
FIGURE 19.6
A comparison of contact resistance for silver cadmium oxide contacts contaminated by different levels of SiC after switching 0.5 A of current at 120 V ac.
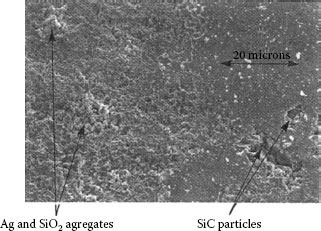
FIGURE 19.7
Edge of arced area for a contact contaminated with SiC. (From Witter G.J. and Leiper R.A., Proc. 38th IEEE Holm Conference on Electrical Contacts, pp 173–180, 1992.)
The effects of contaminant type, refractory chemistry, and particle size were also investigated by Witter and Leiper [51]. Figure 19.8 shows a comparison of silica, a silicate, and silicon carbide. The relative concentrations in terms of ED AX analysis and resistance measurements are compared for the various mineral-contaminated contacts that all switched a 0.5 resistive load at 120 V for 200 operations. For these sets of samples, the particle size of the contaminant was fine, less than 3 μm. Although some differences existed among the results for the materials, they all seem to produce the same order of effect. In Figure 19.9 a comparison is made of silica contamination differing in particle size, 2 versus 8 μm, [51]. The finer material has a much larger effect on the elevation of resistance, which is opposite to the effect seen for particle size on non-arcing contacts. It is speculated that the finer material is more reactive in the arc and mixes more quickly with the silver on the surface. The material with the coarser silica showed a higher resistance level after 2000 operations compared to 200 operations. The current level was also found to have a large effect on the results for mineral contamination [51]. Tests at 0.1 A exhibited no arcing and showed no change in resistance, remained less than 1 mΩ, for short cycle switching up to 2000 operations. At currents greater than 2 A at 120 V ac, the build-up of resistance was very small owing to the cleaning effect of the arc. For work at lower voltage, 12 Vdc, the effects of mineral particles on resistance are more severe and higher currents are less effective in reducing the effects.
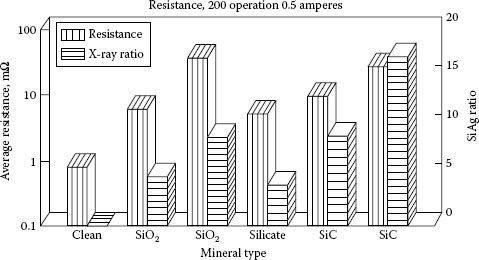
FIGURE 19.8
A comparison of various types of minerals for effects on contact resistance after switching 0.5 A current for 200 operations.
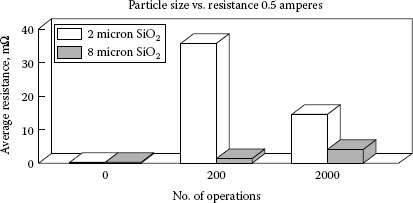
FIGURE 19.9
A comparison for particle size effect for SiO2 contamination at the same concentration level.
In summary, the effects of mineral particulate contamination on contact resistance are mainly seen in the initial portion of the contact life. The severity of the effects will vary as a function of switching current and voltage and also concentration and particle size of the mineral. In many cases the particles are embedded or partially embedded in the surface and do not produce elevated resistance reading until some arcing takes place on the contact surface.
19.4 Silicone Contamination of Arcing Contacts
One of the most troublesome types of contaminants for arcing contacts consists of silicone compounds. Chapter 10 introduced a brief discussion of this phenomenon. Many types of silicones have been developed for numerous applications including lubricating oils, mold release agents, potting materials, plastics components, rubber seals, sprays for insulation, lens cleaning solutions, and more. As a result of the broad use of these compounds, unintentional exposure of contacts to these materials happens frequently. Silicone contamination is sometimes confused with contamination from mineral forms of the element silicon which were discussed in the previous section. In this section, it will be shown that although silicones may produce mineral materials on the contact surface, as a result of breaking down during arcing, the characteristics of the surface deposits in terms of distribution and concentrations during switching life are quite different from what is seen owing to direct contamination from mineral particles. Silicone contamination normally produces no adverse effects early in switching life, but later can cause catastrophic resistance failures, while direct mineral contamination is usually worst early in switching life and becomes less of a problem in later life.
As a result of its physical characteristics, silicones can contaminate contacts by vapor deposition, surface migration, and combinations of surface and vapor transport. Work published on this subject has emphasized either the vapor-deposition mechanism [52,53,54,55,56,57,58] or the surface migration [49,59,60].
Common silicone fluids are dimethyl silicones, which have the following typical structure, where n is the degree of polymerization:
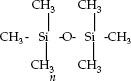
A typical silicone product is composed of a mixture of molecules having a broad molecular weight distribution. Some of the attributes of silicones that make it good for use as a lubricant are the stability of silicones over a wide temperature range and their low surface tensions, 17–22 dynes cm−1 [59] which allows good wetting of surfaces. These same attributes which make silicones good as a lubricant are harmful for applications using arcing contacts, since silicones will wet and spread, migrate, over nearly all types of materials. The molecular weight distribution of a silicone product will have an effect on the rate and ability for the silicones to spread. Lower molecular weight fractions of silicone have lower viscosity, which gives them faster surface migration rates than higher molecular weight fractions of silicone [59]. With regard to vapor transport, the vapor pressure of silicone exponentially becomes larger as the molecular weight decreases, and for low molecular fractions, evaporation takes place even at room temperature [54]. The low molecular weight fractions of silicones are clearly the most troublesome types of silicone contamination for contacts.
Although silicone transfer normally involves both vapor and migration the discussion will be divided into two sections: one where vapor transport is the main mechanism and the other where migration is the main factor for transport and contamination. In following this discussion, it should be kept in mind that factors connected with an electrical switching application such as electrical load type, current level, voltage, contact force, erosion rate, and switching rate can have a large effect on a specific result.
19.4.1 Contamination from Silicone Vapors
The work done on silicone contamination by vapor phase will be discussed first. This process can be considered very similar to the processes discussed in Section 19.2 on contact activation by organic vapors. The organic vapor activation process was mainly concerned with switching at low currents, less than 1 A. and the effects of activation on contact erosion more than the effects of contact resistance. For silicones, concerns are mainly with the effects of contact resistance. The effects also extend to much higher current ranges compared to resistance associated with organic activation. Automotive relays operating at 20 A or more have been found to fail as a result of silicone vapor and migration contamination [61]. The effects of silicone vapors on arcing contacts do not appear immediately on exposure to the silicone but normally after hundreds or thousands of switching operations, similar in timing to organic vapor activation.
Tamai studied the effects on contact resistance from decomposition of silicone vapor onto a heated gold surface [55]. He found that the decomposition and formation of silicon dioxide began at about 300°C and that films of sufficient thickness to cause high resistance readings for 10 cN of contact force started above 600°C. This work also showed that the decomposition at these temperatures left no carbon residue and that the amorphous glass deposits were stoichiometric silicon dioxide, SiO2. Figure 19.10 shows the relationship of the contact resistance to the thickness of the silicon dioxide that was formed on the gold contact and indicates a sharp increase in resistance as the thickness approaches 1000 Å [0.1 μm] [54]. The contact forces utilized in this work were relatively low compared to forces used in typical arcing devices, but the results indicate that SiO2 films thicker than 1000 Å will cause resistance problems even for devices having higher contact forces.
The effects of silicone vapors on arcing contacts will depend on many interrelated factors including vapor concentration, operating temperature, frequency of switching, type of silicone and more. The relationship of molecular weight in terms of degree of polymerization and temperature on vapor pressure of silicones is shown in Figure 19.11 [55]. It can be seen that silicones with degrees of polymerization less than 8 have vapor pressures of 10 p.p.m. or more at room temperature. For applications at elevated temperatures such as automotive relays, 125°C, the degree of polymerization must be greater than 12 to keep vapor pressures less than 10 p.p.m. The reason that 10 p.p.m. is used for this illustration is that the authors, on the basis of work they had performed, thought that below this level resistance failures would not occur. However, later work showed that this is not true [56,57].
From the published work on silicone vapor contamination, the effect of switching rate (operations per unit time) on failures from resistance may not seem clear. Ishino and Mitani [50] showed, for testing enclosed relays with silicone sleeves at 24 V dc and about 0.1–0.2 A, failures at 1000 operations for a switching rate of two operations per hour and failures at 150,000 operations for a switching rate of 30 operations per minute. Eskes and Groenendijk testing under similar electrical loads found that the number of operations to failure was independent of switching rate for the rate range of seven operations per second to only a few operations an hour [53]. This work was done in an artificial environment controlled at a rather high silicone concentration of 500 p.p.m. Tamai and Aramata tested relays at a single relatively fast switching rate of 10 operations per second under silicone concentrations from 0.1 to 300 p.p.m. and found that the time to failure was inversely proportional to the silicone concentration except for the low concentrations, for which no failure occurred even after prolonged life testing [55].
For the above three examples, using some of the same criteria discussed in Section 19.2 for organic vapor activation, an explanation can be made to fit each case as follows:
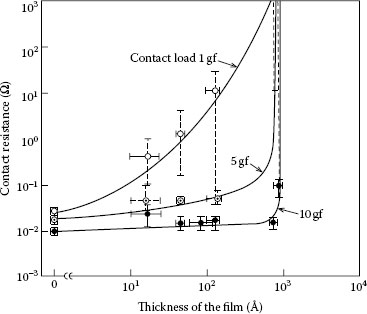
FIGURE 19.10
Contact resistance as a function of SiO2 thickness.
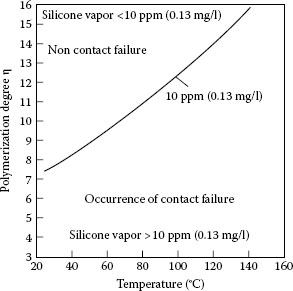
FIGURE 19.11
Relationship of temperature, vapor pressure, and degree of polymerization.
1. The values of the silicone vapor exposure, η, used in the work by Ishino and Mitani were in a diffusion-limited range for silicone adsorption, therefore increasing opening time increased the amount of SiO2 generated per operation [52].
2. The silicone vapor concentration used by Eskes and Groenendijk in their work was very high and possibly the silicone exposures, η, they used were above the diffusion-limited range. Recall from Section 19.2.3 that the adsorption site limited range is independent of exposure. This would explain why no dependence on switching rate was found for this work [53].
3. The work by Tamai and Aramata for silicone vapor concentrations less than 10 p.p.m. was done at a very fast switching rate which greatly limited diffusion of silicone vapors onto the contact surface between switching operations and prevented a build-up of SiO2. Later work by Tamai for the same concentration but at a slower switching rate of 1 Hz versus the previous 10 Hz, resulted in failures for concentrations at 7 p.p.m. and indicated that the former results were limited by diffusion time [56,57].
As mentioned earlier, the low molecular weight silicones are the most problematic. A method of predicting the presence of these harmful weight fractions is to heat the material and measure the weight loss. Eskes and Groenendijk measured the weight loss for a number of silicone materials after heating them at 175°C for 24 hours and found that resistance problems in general increased as the weight loss became greater than 0.3% [53]. Care must be taken to condition the silicone before testing to remove adsorbed water vapor by holding the silicone material at a low relative humidity for 24 hours. Removal of the lower molecular weight fractions of silicones heating the silicone components of a device at elevated temperatures before assembly into the device was shown by Ishino and Mitani to reduce the effects from silicones [52].
Another way for lessening the effects for vapor deposition of silicones is by ventilation. Ishino and Mitani did their work on an enclosed relay with a silicone sleeve. When they removed the plastic relay cover the resistance problems disappeared. Similar results were reported by Eskes and Groenendijk [53].
For the above-cited papers, the switching currents and energy levels were relatively low compared to typical arcing contact applications. Eskes and Groenendijk show a lesser number of operations is needed for failure as current is increased from 5 mA to 500 mA. Tamai predicts a boundary line of 1.6 W below which no failures occur and above which failures occurred earlier in life as the current was increased to their highest test current, 2 A [56,57]. For organic vapor contamination, Germer found that 100 ergs of energy was near optimum for producing a rapid buildup of carbon [7]. For silicone vapor deposits one would also expect an optimum energy level for SiO2 build up. As current increases the electrical erosion will play a bigger role, lessening the SiO2 build up.
Tamai also showed silicone resistance failures for circuit conditions where he suspected that no arcing would have taken place [0.6 A, and less than 4 V] [57]. Here the heating level could result from the molten bridge temperature of the contact alloy, which is more than sufficient to crack silicones. It could also result from the residual temperature of the arc roots on the contact surface. As seen in Section 9.5.4 there is a finite probability that a very short duration arc can form between opening contacts at currents even below 0.6 A. Tamai et al. [62] also did a study of a contact surface exposed to a D4 silicone, siloxane group, vapor environment. This work shows some interesting decomposition mechanisms not discussed before. The D4 exists as both a ring and a chain structure, 0.015–0.085 (ring/chain) equilibrium ratio, see Figure 19.12. A saturation film thickness of one monolayer was formed, 1 nm, in 1–100 hours with the time depending on the vapor concentration. A second layer can also form as a chain structure in the liquid state. For this material a reaction with oxygen in the air over time results in decomposition of the polymer room temperature into a vulcanized structure with higher oxygen content (See also Section 10.6.3).
This study included electrical testing at different currents and voltages using a small relay with less than 10 cN contact force and a resistive dc load. A resistance failure border was found at a switching power level of 1.6W below which failure rates were lower and less severe, see Figure 19.13. The contact surface for failed contacts had deposits of both silica and carbon.
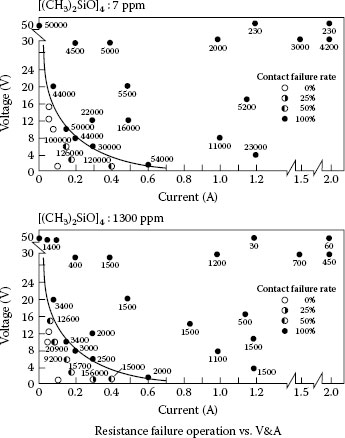
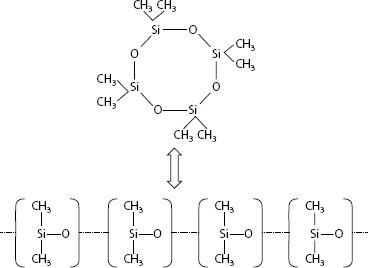
FIGURE 19.12
Silicone D4 which exists as both a ring and a chain structure.
FIGURE 19.13
Results of electrical testing showing a border for contact failure at 1.6 W.
Silicone such as other hydrocarbons will break down and form carbon as discussed in earlier parts of this chapter. In this case, a problem exists for interpretation of carbon versus silicone resistance failures. As seen in previous sections of this chapter, carbon build up alone can result in high resistance readings. For voltages 15 volts and above silica will easily form from the silicone. At the lower voltages the silica may still form from the added oxygen from the decomposition of the D4, but the high carbon build up at that power level may be the dominant cause for the high resistance in this range of voltage and current. This work clearly shows that in the low power range both silica and carbon are present from the decomposition of silicones.
From the above it can be seen that silicone vapors can cause device resistance problems over a wide range of electrical loads and for very low vapor concentrations. It also can be seen that the silicone vapor exposures follow some of the same rules developed from the long term work done by Bell Labs on carbon activation.
19.4.2 Contamination from Silicone Migration
The contamination of contacts through silicone surface migration is less restrictive than by vapor phase deposition since the contacts don’t have to be encapsulated.
As stated earlier, silicones wet nearly all surfaces and will spread over the surfaces at a rate dependent on several factors including temperature, surface roughness, and silicone viscosity [59]. Similar to the case for silicone vapors, the low molecular weight fractions of silicone materials are most problematic since they have lower viscosity and will spread on surfaces ahead of higher-viscosity fractions of the same material. The rate at which the silicone spreads was shown by Kitchen and Russell to be related to the reciprocal of the viscosity [59]. They found that solid silicone materials such as rubber and sealants with uncured extractable fluid fractions caused problems when the extractable portions were more than a few percent of the total weight and were low in viscosity. They considered compounds with extractable portions having viscosity greater than 1000 centistokes, cSt, relatively safe if the extractable portion is not too high, for example 2.8% at 1200 cSt is relatively safe, 14% at 1030 cSt is marginal, 19% at 24 cSt is high risk [59]. For low viscosity silicones in the 20 to 50 cSt range examples have been found for the silicones to travel over wires easily to devices located several inches away and in one case items several feet away [59].
Witter and Leiper studied the effect of varying the switching rate on the failure rate for contacts coated with a very thin film of silicone lubricant [60]. A 350 cSt lubricant was applied by putting a small amount of silicone oil on a board near the contact and allowing the lubricant to migrate onto the contact surface. The thickness of the silicone film covering the contact surface by this method was found to be about 1000 Å. For this study switching was done at room temperature in open air at 0.5 A and 120 V in an experimental switching device using relatively high contact force, 1.2 N. The switching rate was varied with contact open times from 2.3 s to 960 s. The results for the resistance levels after only 200 operations are given in Figure 19.14. In this case switching rates with contact open times of less than 30 s produced no increase in resistance and those with 60 s or more open time resulted in creating high resistance.
Figure 19.15 is an SEM photomicrograph from a later study by Witter and Leiper [49] showing a contact surface after only 50 switching operations, again at 0.5 A and with 180 s between switching operations. The appearance of high resistance is for a relatively short switching life compared to most of the results cited for vapor-deposited silicone. The thickness of the glassy silicon-rich deposits are much greater than the 1000 Å deposits described by Tamai and Aramata [55] for silica from heated silicone-vapor deposits, and this explains why the resistance remains high even at high contact pressures.
The results show a switching rate dependence for silicone migration, similar to the findings for silicone-vapor depositions in the diffusion-limited exposure range. The mechanism for this build-up is termed “arc-driven migration” [49]. An explanation of this process and the surface chemistry distribution that would be seen as a result of this process is described as follows. Silica, SiO2, will be used to describe the glassy silicon-rich deposits created by the reaction of the arc and the silicone, although these amorphous deposits may be a more complex glass or just a mixture of silica and silver.
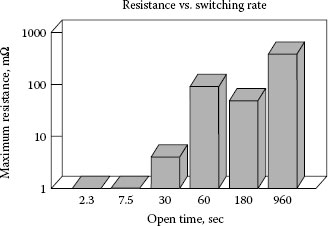
FIGURE 19.14
Resistance as a function of time between switching operations for contacts covered with a thin film of silicone lubricant and switched for 200 operations at 0.5 Å.
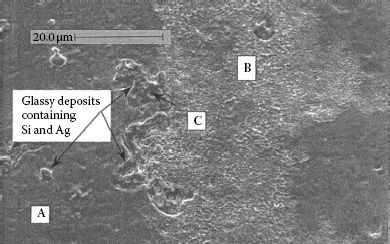
FIGURE 19.15
Arced area after 50 operations showing silicone glass deposits near edge of arced area. (From Rieder W. and Strof T., IEEE Trans CHMT, 15(2), 166–171, 1992.)
• If a silicone fluid source is near a contact and has a surface path connecting to the contact, the silicone material will, given the time needed, migrate to the contact and cover the entire contact surface as a coating relatively uniform in thickness. The coatings are normally too thin, 1000 Å in the above examples, to be detected by conventional SEM and ED AX and thicker than what would be expected for vapor deposits. Before switching duty these coatings do not cause any contact resistance problems since metal-to-metal contact is made through the film.
• During a single switching operation the silicone film directly in and near the area of the arc is dissociated into silicone glass compounds that are deposited around the arced area. Since low-molecular silicones evaporate in the range of 200°C an area larger than the arc spot would have silicone removed by both evaporation and dissociation. The outer portions of the heat-affected area will have silica deposits from the arc reaction but the silicone film will be removed. The void or film thickness gradient in the silicone created by the arc is the driving force for the silicone material to migrate back into the hole. The migration begins immediately after the void in the film is created.
• The time between successive switching operations is an important factor. For example if the next operation is done immediately there will be insufficient time for silicone to be re-established in the void area and if the arc occurs in the same area there will be little or no silicon glass generated. After this operation as a result of electrical erosion the surface may become cleaner with regard to the glass deposits than it was after the first switching operation. On the other hand, if there is a long delay between switching operations, there will be sufficient time for the void to be filled and a second arc in this same region will again remove the silicone and deposit more silica. A sequence of successive arcing operations under these conditions will, in effect, cause silicone material to be drawn into the arced region and be converted to a build-up of silica, thus the “arc driven migration process.”
Figure 19.16 shows EDXA spectra taken from different regions of Figure 19.15. These results for silicon chemistry spatial distributions are also typical of what is seen in field service failures as a result of silicone migration. Spectrum (a) is for an area of the contact away from the arced area, no silicone line is present since the silicone film is too thin in this area to be detected. Spectrum (b) gives the surface composition average for the entire arced area, after 50 operations, and shows silicon to be clearly detectable and built up compared to the non-arced area. Spectrum (c) gives the composition of the large glass deposit in the arced area: both the silver and silicon lines are strong, with only a minor amount of carbon present. From this analysis it is not known if this amorphous deposit is a mixture of silica and silver or a complex glass containing silver and silicon. This point is not so important since the glass deposit is very resistive in either case. The important characteristics of this analysis is the spatial distribution of silicon. If silicon is present only in the arced area as thick glassy deposits, this is indicative of silicone migration.
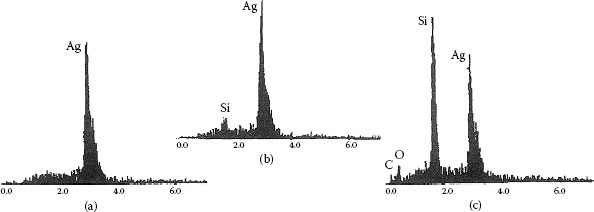
FIGURE 19.16
EDXA spectra for areas A, B, and spot C in Figure 19.15.
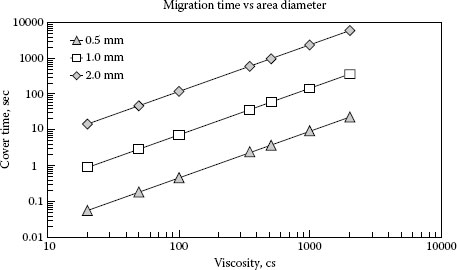
FIGURE 19.17
Estimated time required for silicone migration to cover different diameter areas as a function of silicone viscosity.
Kitchen and Russell generated data for silicones of different viscosity spreading over a phosphor bronze substrate [59]. They presented the following equation for approximating the spreading rate of silicones from knowing the spreading coefficient of the lubricant, σ:
(19.1) |
Where ΔA is the incremental increase in area, cm2, σ is the spreading rate coefficient, cm2h−1/2 and t is the time in hours. The following equation was developed for relating the spreading coefficient of different silicones to their viscosity by using the data that Kitchen and Russell had generated for phophor-bronze substrates.
(19.2) |
In this equation v is the viscosity of the silicone in centistokes, cSt.
Using Equations 19.1 and 19.2 the estimated times for silicones to cover different diameter circular areas is plotted in Figure 19.17. It must be kept in mind that the calculations are not exact since factors such as surface roughness, wetting characteristics of the metal silicone combination, temperature, and others can change the results.
The plots in Figure 19.17 can be used to estimate the contact open time needed between switching operations to allow a maximum build-up of silica on the contacts. For example, in the above described work by Witter and Leiper for switching contacts at 0.5 A with a 350 cSt silicone compound on the surface, the results in Figure 19.12 show that an open time of greater than 30 s, close to 60 s, is needed to generate a large build-up of silica. For this case the arc spot for the 0.5 A load would be about 0.5 mm in diameter. It is known that the silicone depleted area having been affected by a heat of 200°C or more was greater in size than the arc spot. For this example the size was estimated to be twice as large or 1 mm in diameter. Using Figure 19.15 the time estimate for refilling the hole is 35 s, which is lower but in the ball park for 60 s found from the experimental work.
There has been very little published on the effect of current on the results for silicone migration. For example, as the current increases from a level of 2 A to a much higher level such as 50 A, the erosion rate increases by a factor of 2 magnitudes. Cases have been cited where silicone contamination has caused problems for relays operating inrush currents in the 50–100 A range [61]. In such cases, depending on the contact material and the electro-mechanical device characteristics, the electrical erosion can be quite variant, and as a result of this effects from silicone migration may vary. For example, in one case a relay which was designed to operate with silver copper contact material showed no effect from silicone contamination while operating at 50 A, since the surface of the contact eroded away very rapidly. For the same high current load a relay with silver metal oxide contacts that operated with less than one third of the erosion rate failed after 50,000 operations from overheating owing to silica build-up on the contact surface. Further tests conducted on both relays for operating at 12 A with several minutes open time between operations produced failures on both relays in just a few thousand operations. This example shows that qualification testing for devices should include lower current testing with ample time between operations if silicones are at all suspected as a risk. Standard accelerated testing is normally not adequate for detecting problems from silicones since these tests use higher than normal operating current levels, which results in heavier than normal erosion, and also switching rates are too fast to allow replenishment of silicones to the arc spot by migration.
One method that has been recommended for prevention of failures by silicone migration is to coat the area around the contact with a substance with lower surface energy than silicone that will impede silicone migration. Bernett and Zisman found that poly-IH IH-pentadecafluoro-octyl methacrylate, a polymer that can be put on substrates as a very thin film, was effective for impeding silicone migration [63]. Figure 19.18 shows a comparison of relays tested with exposure to silicone migration with and without the above polymer as a barrier to migration [61]. The silicone source was a silicone rubber seal with a high amount of extractable low-viscosity silicone fluid. The seal was put outside the relay and the barrier was coated onto all the plastic surfaces and terminals. The same relays tested with no silicone exposure are included as a control for comparison. The control results are shown slightly off set with regard to the vertical axis for clarity purposes. The results show the control relay to much better than either test relay. It can be seen that the barrier produces some improvements, but is far from being completely effective in stopping the migration of the silicone. This testing was done at 25°C, and certainly the barrier would be much less effective for testing at higher temperatures where vapor transport of silicone would become more of a factor.
As a result of work done investigating the cause of a high percentage of electrical failures in an automotive line, Witter [64] conducted research comparing both resistive and inductive loads for failure potential as a result of silicone migration. In a study of the failures in the actual cars it was found that the wiring harnesses were contaminated with silicone film and each harness housed about 20 automotive relays. The actual failure reports from the service dealerships showed that failures only occurred for the relays running high inductive loads and no failures were reported for resistive loads or mild inductive loads. All the relays had about the same level of contamination. To verify the findings similar tests were run in the laboratory comparing the two types of loads. Figure 19.19 shows the results comparing two inductive and two resistive loads. The testing was done with an open time of 360 seconds between operations and from 1 to 4 amperes for the inductive loads. The testing on the resistive loads included a range from 3 to 20 amperes and none of the tests showed any changes in electrical resistance as would be expected for contacts exposed to silicone migration.
For resistive and low inductance, automotive loads running at 13 V dc the relays normally interrupt in the metallic state and therefore there is no oxygen to react with the silicone in the arc (see Section 10.3.5). Popular silicones such as the dimethyl silicone shown in Figure 19.4 have too high a ratio of carbon and hydrogen to oxygen to allow the formation of silica without the arc reaching a gaseous state. This explains results seen in this study where there were thousands of cars involved and a failure rate of 7% for inductive loads and 0% for other loads.
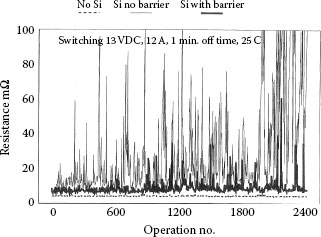
FIGURE 19.18
A comparison of resistance results for relays exposed to external silicone migration both with and without silicone migration barriers.
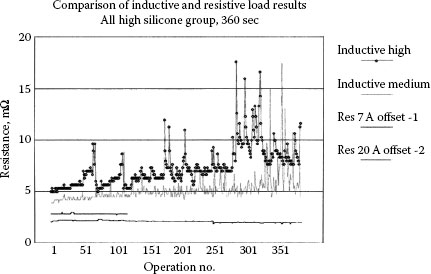
FIGURE 19.19
Comparing the effects of inductive and resistive loads for testing silicone contaminated contacts, bottom lines resistive loads off set and upper plots inductive loads.
19.4.3 Summary of Silicone Contamination Mechanisms
Silicone contact contamination has been discussed in terms of both vapor transport and migration mechanisms. Actually in all cases both mechanisms will be active to some extent.
In both types of transport, the time between switching operations has an effect on the results. For vapor transport you must have enough time for the adsorption of the silicone vapor to take place unless you have a concentration above the diffusion limited range. In migration you need to provide enough time for silicone to migrate over the arc spot and recover the area that reacted with the arc. Most of the work on studying vapor transport used low currents and low device contact force. For devices using higher forces the results would be much less severe for the same contamination levels. For migration the silicone film can be much thicker than for adsorbed vapors and the resultant silica build up much thicker.
In either case of transport, the detection of silicone films before arc build up is not possible using SEM and EDX analysis and more sensitive surface analysis equipment such as auger and XPS must be used. Once the parts have been exposed to many electrical operations EDX is good for detecting the silica build up.
Different attempts have been made to counteract effects of silicone. The uses of lower surfaced energy coating such as fluorides as described in the previous section are only marginally successful. Another marginal solution is to use contact materials that have a high erosion rate so there is no significant built up of silica. This doesn’t work for low current applications. Work by Schrank [65] looked at what had to be done for sealing relays against silicone contamination when put in silicone rich environments. This work showed that water proof seals are not effective and only true hermetic sealing worked. The other solutions being looked at are use of non-silicone type acryl-based polymeric products in the vicinity of the relays, Hasegawa [66], and this is may be the most successful solution.
The following is a summary of points relating to silicone contamination.
1. For silicone vapor contamination the contact must be in an enclosure which contains the silicone source. Silicone vapor contamination is more likely at elevated temperatures but can be a factor at room temperatures where very light molecular weight silicones are present. As the temperature goes up the concentration of the vapor increases but the adsorption amount decreases. Lower concentrations require more time for adsorption.
2. Contamination by silicone migration can take place over long distances and failures can occur for contacts that are not in enclosures. The effects of silicone migration are influenced by the time allowed between switching operations owing to the process described as “arc driven migration.” Rapidly switched contact devices may have prolonged life or no failures, while devices that have long time duration between operations may fail rapidly. Migration times for silicone oils are much faster for low-viscosity low-molecular-weight silicones. Migration can produce relatively thick deposits of silicon glass products on the contacts in just hundreds of operations. Even under good contact force these deposits cause high resistance.
3. Qualification testing for electromechanical switching devices is normally done at accelerated switching rates that do not provide enough time between operations to see the effects of silicon migration, they are also normally done at maximum current which increases erosion of the silica, and therefore this type of testing is not effective for screening for silicone contamination. Silicone screening tests should be done with lower currents, inductive loads or voltages at 15 amperes or more, and a long delay between switching operations, 1 to 5 minutes.
4. Effects from silicone contamination do not show up until devices have been in operation for some time and if the contamination of a device is connected with the manufacturing process many parts can be affected before the problem surfaces. This is why screening tests are important.
5. Many different types of silicones have been developed and the decomposition processes can be quite different and involved. They all can cause failures and low molecular weight versions are the most troublesome.
6. Low power weak arcs involve breaking down silicones into both silica and carbon deposits and both contribute to the high resistance.
19.5 Lubricants with Refractory Fillers
Another type of contamination that is often confused with silicones consists of lubricants that contain mineral particles as fillers. The mineral fillers serve as thickeners for increasing the temperature stability of the lubricants. Lubricants of this type are sometimes used with base-metal contacts that have a sliding action for make and break. Little has been published about problems encountered with this type of lubricants for arcing contact applications. Some of the fillers used are silica, alumina, silicates, and magnesium oxide. Klungtvedt reported on resistance problems associated with the use of silicate-thickened lubricants used on the contacts of an automotive sliding switch that caused switch overheating and failure [67]. For this application the contact forces are over 1 N and the current is 20–50 A. The characteristics of these materials for causing resistance problems for arcing contacts can be thought of as a mixture of the mechanisms described in the preceding sections on mineral contaminants and silicones.
The minerals are suspended in the lubricants as fine particulate. Like silicone and dry mineral contaminants, before arcing these lubricants normally will not create a resistance problem if the particulate is very fine in size; they have a uniform distribution throughout the lubricant and the contacts have contact forces of about 0.5 N or more (see Figure 3.33). Failures of arcing devices owing to high resistance and overheating have occurred owing to these types of lubricants. On examining the contacts from such devices it was found that the mineral particulate is no longer uniform in distribution and that deposits are present which contain high concentrations of the minerals mixed with the contact base metal and carbon.
Although there is little research on this subject, we can make some assumptions as to what happens during the arcing of contacts with these lubricants. The heat from the arc will evaporate and also crack some of the lubricant and leave higher concentrations of the mineral materials around the arced area. The arc will also melt the mineral materials and form aggregates composed of the mineral particulate and base metal similar to that described in Section 19.3 on mineral contamination. The contact resistance that develops depends on the size and concentration of the aggregates that form. Different from the case of solid mineral contamination, where the supply of mineral particles is limited, the migration of the lubricant on the contact will form a continuous supply of mineral material to the arced region.
Another possible detrimental mechanism for this type of lubricant can take place from constriction heating. If a high-resistance spot is made on the contact surface from an arc deposit, heating from the constriction can result in evaporation of the oil near the contact spot. This evaporation will create a migration of replacement oil to the constriction area. The oil will carry more mineral material to the area and continuing evaporation will result in a concentration of mineral material.
Since little is known about this subject, care must be taken in using these types of lubricants where arcing will take place. If using this type of product switching tests should be run at several different current levels combined with periodic soak tests, periods with the contact closed at normal current. Switching should be done with enough time between operations to allow for migration of the oil.
19.6 Oxidation of Contact Materials
Silver alloys are the most popular of the arcing contact materials since they do not oxidize during normal switching operations. The oxides of silver are not stable at elevated temperatures. Silver is alloyed with up to 25% copper without any adverse effects for resistance owing to oxidation during arcing. Almost all of the contact materials that are operated in air are composed of silver or noble metal as a result of the need for oxidation resistance.
One of the exceptions for a class of materials that are operated in air and are not resistance to oxidation consists of the silver refractory composite contact materials, silver–tungsten, silver–tungsten carbide, and silver–molybdenum. These materials form complex oxide compounds with silver during arcing and as a result have limited switching life and must be used with high contact forces. A detailed explanation of this problem is described in Chapters 10 and 16.
Copper is another material that is used in some arcing contact applications but is very limited because it forms high resistance oxides during arcing in air. Most designers are aware of the problems with copper and avoid its use except under protective atmospheres such as SF6 and oil. It has also been used extensively as a contact material in vacuum (see Section 16.4). Little has been published on the problems in using copper as an arcing contact. When copper is used for an arcing application in an air atmosphere, the following conditions are normally employed. A large contact force is used with good contact wiping during make and break. Also, oil coatings are sometimes used to inhibit the oxidation. Sometimes silver plate is used over the copper, but this is of little use if any significant arcing takes place.
Tungsten has been a popular contact material but only for limited applications since it oxidizes during arcing. Tungsten is used only in combination with very high contact forces. It is also used only for rapidly operated devices such as ignition sets and horns where it does not have to carry a continuous current load.
19.7 Resistance Effects from Long Arcs
For fine silver and other silver-based contact materials, it has been found that the contact resistance after the interruption of a long arc, a gaseous arc of approximately 1 ms or longer, will vary significantly and be much higher than the contact resistance after interruption of a short arc, a metallic arc about 0.5 ms duration or shorter. Several independent researchers have reported similar findings [68,69,70]. Witter and Polevoy found the contact resistance of an automotive relay switching an inductive load to be high and erratic regardless of the silver contact material tested which included silver tin oxide, silver cadmium oxide and fine silver [64]. Further tests were conducted on fine silver contacts in a model switch with a contact force of 1 N and 12 V dc and about 30 A current, for both an inductive load and a resistive load. The resistive load arc duration was about 300 μs and the inductive load was about 3000 μs. Figure 19.20 shows the contact resistance measurements made after each switching operation, starting with the inductive load and after 35 operations changing to the resistive load. For clean contacts these two very different contact resistance distributions for the long and short arcs are very repeatable. Sone et al. [68] conducted tests with a pure resistive load at 48 V dc and about 3 A with a similar contact force of 1 N. For this work a very slow opening speed was used (35 mm s−1). As a result of this and the circuit, the arc duration was long and variable (2–8 ms). Sone et al. found a tendency for higher resistance readings after several longer arcs (>10 ms), and contact resistance dropping as arc duration decreased. They explained the difference in resistance between the long and short arcs in terms of surface roughness [71]. It was explained that as the arc transferred from the metallic phase to the gaseous phase the surface became rougher owing to the gaseous arc that resulted in higher resistance. Chen et al. [69] conducted switching tests at 20 V dc and 0.5 and 1.0 A for an inductive load. The resulting arcs were gaseous with a duration of about 1.5 ms. They tested with different mixtures of oxygen and nitrogen (0%, 5%, and 50% O2). The results are shown in Table 19.2. The results show a clear correlation of oxygen level and resistance. Auger analysis of the anode shows a significant amount of oxide is present. The conclusion of these researchers is that silver oxide films are responsible for the higher resistance associated with long arc duration and not surface roughness.
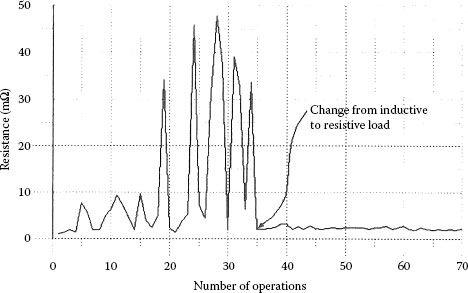
FIGURE 19.20
Contact resistance as a function of switching life for initial inductive load testing, long arc, followed by resistive load testing, short arc.
Witter and Polevoy also conducted surface analysis on the high contact resistance long arc samples they had tested [70]. The work was done using electron spectroscopy for chemical analysis (ESCA), which not only identifies elemental monolayer but also provides information on the valence of the element. This analysis showed that silver, carbon, and oxygen were present on the surface but also the valence state of the carbon and oxygen corresponded to that which matches the compound silver carbonate. From the analysis it was also determined that almost all of the silver on the surface was tied up as this compound.
A switching test conducted by Witter et al. was conducted in ordinary air, which contains 350 p.p.m. CO2 and a small amount of hydrocarbon chemicals from pollution. Chen et al. had done their work with synthetic air which contained no significant amount of carbon compounds. Witter and Polevoy repeated their work in a test chamber with high purity synthetic air. The results for the resistance came out exactly the same as the previous work in ordinary air. The ESCA analysis of these samples showed a distinct shift in the oxygen spectrum to match the valence corresponding to silver oxide. This indicates that in the presence of carbon silver carbonate will form for these long arcs and in the absence of carbon silver oxide will form.
The reasons for these results are not well understood at this time. Some speculations can be made from what is known about the differences in the chemistries of the metallic and gaseous arcs. The difference in the arc plasma chemistries seems to be the main factor for explaining the difference in contact resistance associated with these arcs. Neither silver oxide nor silver carbonate is stable at temperatures above 300°C. This means that these compounds must form after the surface of the contact has cooled to this temperature. The ratio of silver vapor and ions to oxygen in the dying plasma of the metallic arc is much higher than that ratio for the gaseous arc. This means that a fresh silver deposit is more likely to pick up oxygen in cooling from a gaseous arc than from a metallic arc. If a source of carbon is present then the same analogy would hold for ratios of silver to carbon. The cause for the high resistance seems to correlate with the surface chemistry of the contact after arcing rather than the roughness of the contact surface.
TABLE 19.2
Average Contact Resistance for Fine Silver Contacts After Interrupting a 1.5 ms Arc Under Different Mixtures of Nitrogen and Oxygen
Oxygen (%) |
Average Contact Resistance (mfí) |
0 |
20 |
5 |
60 |
50 |
400 |
Source: Data from GJ Witter, Proc. 51st IEEE Holm Conference Proceedings, pp. 1–9, 2—5. [63].
The authors want to thank Dr. Zhuan-ke Chen, Chugai USA, and Dr. Paul Slade for their help in editing and encouragement. We thank Prof. Terutaka Tamai, Consultant in Japan.
1. LH Germer, FE Hawarth. Erosion of electrical contacts on make. J Appl Phys 20: 1085–1108, 1949.
2. LH Germer. Arcing at electrical contacts on closure. Part I. Dependence upon surface conditions and circuit parameters. J Appl Phys 22(7): 955–964, 1951.
3. LH Germer, WS Boyle. Two distinct types of short arcs. J Appl Phys 27(1): 32–39, 1956.
4. EW Gray. Voltage fluctuations in low-current atmospheric arcs. J Appl Phys 43(11): 4573–4575, 1972.
5. EW Gray, LG McKnight. Possible mechanism for deposition of trace organics on electrode surfaces of arcing relays. Int J Electronics 37(2): 257–260, 1974.
6. EW Gray, LG McKnight. A survey of possible mechanisms of activation and erosion of relay contacts. IEEE Trans CHMT PHP-11(2): 121–124, 1975.
7. LH Germer, JE Smith. Activation of electrical contacts by organic vapors. Bell Syst Tech J 36: 769, 1957.
8. LP Solos. Organic adsorption on precious metals and its effect on static constriction resistance. Proc. 16th Holm Conference on Electrical Contacts, 1970, pp 27–36.
9. EW Gray. Effects of vapors from phenol boards and connector lubricants on activation of wire spring relay contacts. IEEE Trans CHMT 1: 107–111, 1978.
10. D Oblas, D Dugger, S Lieberman. The determination of organic species in the telephone central office ambient. Proc. 25th Holm Conference on Electrical Contacts, 1979, pp 35–39.
11. T Ide, T Sakurai, T Sasamoto. Contact reliability evaluation of plastic sealed relay. Proc. 31st Annual National Relay Conference (NARM), 1983, pp 7–17.
12. K Yoshida, Y Aoyama, M Isagowa, K Shirakura. Evaluation of contact failure by vaporized organic gases. Proc. 31st Holm Conference on Electrical Contacts, 1985, pp 191–199.
13. W Bertsch, A Zlatkis, H Liebich, H Schneider. Concentration and analysis of organic volatiles in skylab 4. J Chromatography 99: 673–687, 1974.
14. NE Lewis. A comparative study of the performance of electrical sliding contact lubricants in a chemically active atmosphere. IEEE Trans PHP 12(1): 45–50, 1976.
15. JL Queffelec, N Ben Jemaa, D Travers. Activation de contacts de relais électromécaniques par leurs propres produits organiques de dégazage en atmosphere confinée, en foction de la temperature. Rev Générate de l’Electricité 89(9): 557–586, 1980.
16. N Ben Jemaa, JL Queffelec, D Travers, P Guenot, A Monpert. Effect of evolved organic vapors from electromechanical relays on their contact behavior: erosion and contact resistance. Proc. 11th Int’l Conferences on Electrical Contacts, Berlin, 1982, pp 246–250.
17. A Motoyama, K Yoshida, M Isagawa, Y Miyazaki. Evaluation and selection of organic materials used for communication relays. Proc. 36th Annual National Relay Conference, 1988, pp 16.1–16.8.
18. B Göttert, U Rauterberg. Evaluation of the influence of organic vapors on relay contacts. Proc. 36th Annual National Relay Conference (NARM), 1988, pp 15-1–15-9.
19. B Göttert. Kunststoffausgasungen von Klebefolien beeinflussen Kontaktmaterialien. ETZ 112: 1216, 1991.
20. M Tamura, K Hanada. Minimizing early and random failures of reed contact units by Wiedemann resonance testing. Proc. 8th Int’l Conference on Electrical Contacts, 1976, pp 419–424.
21. RS Barton, RP Gavier. A mass spectrometric study of the outgassing of some elastomers and plastic. J Vacuum Sci Technol 2: 113–122, 1965.
22. K Muhlethaler. Kunststoffausduenstungen und ihre Auswirkungen. Bull Schweiz Elektrotecvh Verein 64: 1374–1378, 1973.
23. WA Crossland, PM Murphy, IA Murdoch. The evolution of organic vapors from plastic materials associated with electromechanical relays. IEEE Trans PHP 10: 60–64, 1974.
24. SW Chaikin. Mechanics of electrical contact failure caused by surface contamination. Electro Technol 68: 70–75, 1961.
25. EW Gray. The role of carbonaceous particles in low current arc duration enhancement I. Break arcs. IEEE Trans Plasma Sci PS-3: 151–162, 1975.
26. JA Augis. Influence of adsorbed layers on the duration of short arcs on make. Proc. 7th Int’l Conference on Electrical Contacts, Paris, 1974, pp 87–93.
27. HP Koidl, WF Rieder, QR Salzmann. Contact compatibility of organic vapours and their physical/chemical properties. Proc. 43rd IEEE Holm Conference on Electrical Contacts, 1997, pp 328–332.
28. W. Reider. Private communciation, Vienna University of Technology, Vienna, Austria, 1996.
29. Y Takenaka, K Funaki, S Shimada. Effects of organic gas components on contact resistance. Proc. 41st IEEE Holm Conference on Electrical Contacts, 1995, pp 260–266.
30. EW Gray. How organic vapors cause contact activation. Insulation Circuits, March 23–25, 1977.
31. T Uhrig. A model of contact activation and the long-term behavior of RC protected contacts. J Appl Phys 46(11): 4705–4711, 1975.
32. LH Germer. Arcing at electrical contacts at closure IV. Activation at contacts by organic vapor. J Appl Phys 25: 332–335, 1954.
33. R Schubert. Electrical contact activation: a phenomenological model. J Appl Phys 45: 2421–2427, 1974.
34. TA Uhrig, EW Gray. Effect of operating rate on the arc duration of activated telephone relay contacts. J Appl Phys 46(11): 4712–4717, 1975.
35. EW Gray, TA Uhrig, GF Hohnstreiter. Arc duration as a function of contact metal and exposure to organic contaminants. Proc. 8th Holm Conference on Electrical Contacts, 1976, pp 15–25.
36. EW Gray. On the electrode damage and current densities of carbon arcs. IEEE Trans Plasma Science PS-6(4): 384–386, 1978.
37. LH Germer. Arcs in opening contacts. Proc. 1st Int’ Conference on Electrical Contacts, 1961, pp 237–257.
38. GJ Witter, I Polevoy. Contact erosion and material transfer for contacts in automotive relays. Proc. 42nd IEEE Holm Conference on Electrical Contacts, 1996, pp 223–228.
39. M Tamura, K Hanada. Contact failure caused by organic vapor in hermetically sealed relay. Proc. 8th Int’l Conference on Electrical Contacts, 1976, pp 413–418.
40. K Kimura, M Ishino, K Matsui, S Mitani. Resistance increase of gold-plated silver contact by carbon and its acceleration factor. Proc. 27th Relay Conference, 1979, pp 1.1–1.6.
41. BJ Wang, N Saka, E Rabinowicz. The failure mechanism of low voltage electrical relays. Proc. 38th IEEE Holm Conference on Electrical Contacts, 1992, pp 191–202.
42. C Neufeld, W. Rieder. Prufverfahren zur Untersuchung der Gefahrdung der Kontakt-zuverlassigkeit durch organishche Dampfe. VDE-Fachbericht 44: 127–135, 1993.
43. C Neufeld, W. Rieder. Electrical characteristics of various contact contamination. IEEE Trans CPMT 18: 369–374, 1995.
44. C Neufeld, W Rieder. Carbon contamination of contacts due to organic vapors. IEEE Trans CPMT 18(2): 399–404, 1995.
45. E Vinaricky, V Behrens. Switching Behavior of Silver/Graphite Contact Material in Different Atmospheres in Regard to Contact Erosion. Proc. 44th IEEE Holm Conference on Electrical Contacts, 1998, pp 292–300.
46. W Rieder, T Strof. Reliability of commercial relays during life tests at low electrical load. IEEE Trans CHMT 15(2): 166–171, 1992.
47. H. Koidl, W. Rieder, QR Salzmann. Parameters Influencing the Contact Compatibility of Organic Vapous in Telecommunication and Control Switches. Proc. 44th IEEE Holm Conf. Proceedings, 1998, pp 220–225.
48. JB Williamson, JA Greenwood. Influence of dust particles on the contact of solids. Proc. Roy. Soc. A 237: 560–573, 1956.
49. GJ Witter, RA Leiper. A study of contamination levels measurement techniques, testing methods, and switching results for silicon compounds on silver arcing contacts. Proc. 38th IEEE Holm Conference on Electrical Contacts, pp 173–180, 1992.
50. W Trächslin. Contact behavior and surface condition of commercially available contact rivets. Proc. 8th Int’l Conference on Electrical Contacts, 1976, p 131.
51. GJ Witter, RA Leiper. A comparison for the effects of various forms of silicon contamination on contact performance. Proc. 24th Holm Conference on Electrical Contacts, 1978, p 371.
52. M Ishino, S Mitani. On contact failure caused by silicones and accelerated life test method. Proc. 23rd Holm Conference on Electrical Contacts, 1977, p 207.
53. A Eskes, HA Groenendijk. The formation of insulating silicon compounds on switching contacts. Proc. 33rd Holm Conference on Electrical Contacts, 1987, p 187.
54. T Tamai. Formation of SiO2 on contact surface and its effect on contact reliability. IEEE Trans CPMT 16: 437–441, 1993.
55. T Tamai, M Aramata. Safe levels of silicone contamination for electrical contacts. Proc. 39th IEEE Holm Conference on Electrical Contacts, 1993, pp 267–273.
56. T Tamai, M. Aramata. Effect of silicone vapor concentration and its polymerization degree on electrical contact failure. IEICE Trans Electron E97-C: 1996, 1137–1143.
57. T Tamai. Effect of Silicone vapor and humidity on contact reliability of micro-relay contacts. IEEE Trans CPMT A 19: 329–338, 1996.
58. T Tamai, K Miyagawa, M Furukawa. Effect of switching rate on contact failure from contact resistance of micro relay under environment containing silicone vapor. Proc. 43rd IEEE Holm Conference on Electrical Contacts, 1997, pp 333–339.
59. NM Kitchen, CA Russell. Silicone oils on electrical contacts effects, sources and countermeasures. Proc. 21st Holm Conference on Electrical Contacts, 1975, p 79.
60. GJ Witter, RA Leiper. A study of the effects of thin film silicone contamination and the rate of testing on contact performance. Proc. 10th Int’l Conference on Electrical Contacts, Budapest, Hungary, 1980, p 829.
61. GJ Witter. Chugai USA, Inc. Unpublished Research, 1994.
62. T. Tamai, S. Sawada, Y. Hattori. Manifold Decomposition Processes of Silicone Vapor and Electrical Contact Failure. Proc. 26th Int’l Conference on Electrical Contacts, 2012, pp 261–266.
63. MK Bernett, WA Zisman. J Phys Chem 66: 1207, 1962.
64. GJ Witter. Contact Contamination and Arc Interactions. Proc. 51st IEEE Holm Conference Proceedings, 2005, pp 1–9.
65. C. Schrank. Reliability of hermetically sealed miniature relays in silicone-rich Environments. ICEC 2012, Beijing, China, May 2012, pp 113–119.
66. M. Hasegawa, N. Kobayashi, Y. Kohno, H. Ando. Contact resistance characteristics of relays operated in vapors evaporated from non-silicone-type acryl-based polymeric products cured in various manners. I Proc. 26th Int’l Conference on Electrical Contacts, May 2012, pp. 104–108.
67. K Klungtvedt. A study of effects of silicate thickened lubricants on the performance of electrical contacts. Proc. 42nd IEEE-Holm Conference on Electrical Contacts, 1996, pp 262–268.
68. H Sone, H Ishida, H Sugimoto, T Takagi. Relationship of contact resistance to arc duration in Ag. Proc. 40th Int’l Conference on Electrical Contacts, 1994, pp 63–70.
69. ZK Chen, K Arai, K Sawa. The influence of oxygen concentration on contact resistance behaviours of Ag and Pd materials in DC breaking arcs. Proc. 40th Int’l Conference on Electrical Contacts, 1994, pp 79–88.
70. GJ Witter, I Polevoy. A study of contact resistance as a function of electrical load for silver based contacts. Proc. 40th Int’l Conference on Electrical Contacts, 1994, pp 563–568.
71. H Sugimoto, H Sone, T Takagi. Relationship between contact resistance and surface profile in arcing Ag contacts. Proc. 40th Int’l Conference on Electrical Contacts, 1994, pp 71–78.