
17 Guidelines and Recommendations
17.1 INTRODUCTION
This final chapter summarizes and integrates the key points made about aging power delivery infrastructures and the technical and managerial methods covered in the previous sixteen chapters, into a coherent overview of the problem and its solution. It provides guidelines and recommendations as well as lessons-learned from experience and the case study (Chapter 16) which the authors think are generalizable.
Section 17.2 begins by summarizing the five main “causes” of aging infrastructure problems and highlighting how they interact among themselves and with other aspects of a utility’s operations. It then summarizes the four key points of solutions – methods that can mitigate the effects of aging infrastructures and improve the performance of the distribution utility. Section 17.3 then presents a series of recommended approaches, not all of which will be relevant to every utility, but all work well at some utilities. These are organized based on two criteria: how quickly they can be implemented and how much impact they can make. Section 17.4 gives guidelines on setting up and managing an aging infrastructure program at a utility.
17.2 FIVE INTERRELATED FACTORS
An aging power delivery infrastructure is an area of an electric utility system that is mostly old equipment near the end of its lifetime, configured in a layout that is itself quite old and not completely compatible with modern needs. For a variety of reasons, the aged equipment and layout create reliability, customer service, and budgeting challenges that if not anticipated and brought under control through proactive management, will eventually overwhelm even the most effective and efficiently run utility company.
Table 17.1 Characteristics of the Aging Infrastructure Areas (same as Table 1.4)
The system layout and design was first put in place more than forty years ago. The majority of equipment in the area is more than forty years old. The system is well engineered and fully meets minimum engineering criteria. The area is seeing steady, if perhaps low, growth in load. The area is plagued by above average equipment failure rates. Overtime is high due to large amounts of unscheduled repair and restoration. SAIFI began rising some years ago; SAIDI is beginning to rise now. Major interruption events always occur due to a bizarre series of outages. Things go bad very often. |
The most easily identifiable characteristic of aging delivery infrastructures is that the equipment in the area is old. It will have an average service age greater than its design lifetime. Situations vary from one location to another, but most aging infrastructure areas share similar characteristics in other areas, exhibiting a type of “signature” as listed in Table 17.1. This “aging infrastructure signature” was discussed in Section 1.1 and Chapters 7 and 8 and Appendix B.
Aging infrastructures are not just about old equipment. There are actually five interrelated, contributing factors at work in these areas, all of which work against efficient, reliable operation. These are:
1. Old equipment, which requires high O&M efforts, and whose higher than normal failure rates degrade customer service quality. Old equipment is discussed in Chapter 7. Methods to measure, manage, and mitigate its effects are discussed Chapters 7 and 8.
2. Obsolete system layouts. Many metropolitan utilities have been unable to obtain new substations or ROW into the central core of their metropolitan areas for decades. As a result, they must serve the high levels of both power and reliability that modern society demands, from systems that are far less than ideal with respect to topology and interconnection/configuration strength for contingencies. This exacerbates problems caused by aging by limiting the system’s strength to tolerate the loss of equipment when it fails. This issue is discussed in Chapter 8. Methods that measure, manage and mitigate problems caused are covered in Chapters 11 – 15.
3. Old engineering methods. Many T&D utilities are using engineering methods that worked well in the 1970s, but cannot fully guarantee reliable operation in a world where substation and line loadings are pushing beyond traditional levels and equipment is old. Traditional tools need to be augmented by new ways of searching for problem areas in a system’s design and in identifying and prioritizing how and where money is spent to bolster reliability of the system. This problem is discussed in Chapter 8. Methods to fix the situation are covered in Chapters 12-16.
4. Uncoordinated and non-optimal use of distribution. Few utilities coordinate the reliability economics and planning of the sub-transmission – substation level and the primary distribution feeder level optimally or even near optimally. As a result, the distribution system is often an underutilized reliability resource. Although it involves more difficult planning methods, coordinated multi-level, reliability – based planning of a power system results in much better reliability and much better use of both capital investment and operating budget.
Table 17.2 Contributing Factors to Aging Infrastructures and Their Impact
5. Old cultures and ideas. Institutionalized procedures and values – what might be termed corporate culture – at many utilities still tends to operate in terms of the culture and goals appropriate for a purely regulated, vertically integrated power industry in the last quarter of the 20th century. Goals are different today and are continuing to evolve. A fresh perspective must be taken by executive management, and professionals in all areas of a utility, to re-examine the most basic concepts throughout the organization, and to apply innovation and creativity to the methods used to manage the utility, in both aged and new areas of the system. Discussion and methods falling into this category are discussed in Chapter 1, throughout the book, particularly in Chapter 14, and in this chapter.
Table 17.2 shows the impacts these five contributing causes and their sub-areas make on the utility’s reliability and cost. The size of the “x: under the three categories of impact shows the degree to which the cause affects that category.
17.3 RESULTS-DRIVEN MANAGEMENT (RDM)
Cross-Functional/Cross-Departmental Results-Driven Management
The authors use RDM here to designate the term “results-driven management,” as discussed in Chapter 15, the uniform application of reliability-focused prioritization of spending in a coordinated manner throughout the utility. This is very highly recommended. Results-driven Management means taking that same basic concept, which lies at the heart of reliability-centered maintenance, budget-constrained capital prioritization, and reliability-based optimization, and integrating its use in all aspects of the utility’s operation. The basic concept is simple:
Spend money where it will do the most good. Be willing to move funds from one budget to another, from one function to another, and to spend it in non-traditional ways if those changes will buy more reliability for the same money.
Chapter 12 presented a lengthy example of RCM applied to decisions about what equipment to maintain, and how to maintain it – a comprehensive but traditional view of RCM. There, alternative actions that could be taken, from inspection to rebuilding of equipment, were all evaluated on the basis of the ratio of expected improvement in reliability of service to expected cost. The most cost-effective actions were approved. Others were not. The key factors in such analysis are:
• Results are measured against what the utility wants to accomplish, specifically the type of customer service it wants to provide.
• Costs are evaluated in terms of what the utility wants to accomplish. Financial, specifically reduction in revenue requirements or increases in profitability.
• The ratio of the two is the measure of efficiency of any proposed project or action: those with the highest ratio of results to costs are the “winners.”
Similarly, reliability-based planning and prioritization (Chapters 13 and 14) assess capital spending on the same basic basis – evaluate “bang for the buck” and approve the most effective projects. Replacement of equipment, either in kind or with different types or sizes of units, can be evaluated from a similar standpoint (Chapter 15).
The standpoint of overall financial efficiency of the utility, spending, whether for new capital projects, equipment replacement, refurbishment and upgrades of older areas, preventive maintenance, repair and restoration, or for performance-based customer service penalties, is all the same and should be evaluated on the same basis: it absorbs revenues, lowering financial efficiency and potentially reducing the bottom line (profits). Therefore, spending on any of these measures should be coordinated. Money should not be spent on only one at the expense of spending on others, but only if and to the extent that spending on that item generates more improvement per dollar than on the other items.
Implementing RDM
RDM frameworks such as the various reliability-centered approaches have been so effective in improving results that they are standard practice in other industries where reliability is an important consideration (e.g. airlines, nuclear materials processing). Their effectiveness in the power industry is well proven. Therefore RDM, as described here, is highly recommended. It gets results and it minimizes costs.
Implementation can follow the approach discussed in Chapters 12 and 16. Evaluation and prioritization within each function in the company (i.e., preventive maintenance, operations, replacement and repair, capital projects, reliability-augmentation projects) is evaluated on the basis of “bang for the buck” as described in those chapters. Executive management enforces consistency in evaluation rules: all departments use the same definitions of “good results” and consistent definitions of costs, all compatible with upper management’s goals. Results are measured in terms of the type of customer service quality desired. Costs are evaluated in the manner that fits the corporate business model. This is not how many utilities currently evaluate results and costs: different departments use different priorities or rules, and cost bases are different and often incomplete from one department to another.
Utilities cannot take a trivial or “band aid approach” here. This is not an easy evolution. This is because total cost must be comparable across departmental and functional boundaries. For example, certain fixed costs that can be (but shouldn’t be) viewed as continuing are often not included in intra-department cost evaluations. The costs of vehicles and line trucks, tools, fittings, test equipment, and training are often not included in the costs of preventive maintenance projects as calculated at some utilities. These costs are a “given” and evaluation of cost effectiveness of different preventive maintenance actions is evaluated on the basis of only the labor, outside services, and parts required for one versus the other.
While that is a sound approach to deciding among projects in that department, it is not valid for extension and comparison outside the department. For example, how can these expenses truly be compared to contract tree trimming, in which the utility has no fixed costs of comparable type? Maybe the utility should buy fewer line trucks and tools, etc., and transfer funds to more tree-trimming. It can’t tell. Also it’s quite possible that analysis against other departments might show more investment in those resources is needed. The point is that cost-comparisons across departments and functions need to include all costs.
Considerable change in cost-computation and tracking – generally a shift to ABC (Activity-Based Cost evaluation), an accounting method that tracks all costs on a function basis – is a pre-requisite to effective RDM. The authors strongly recommend this since it is worth the effort.
Zero-base all expenses
Thus, the way to implement this includes zero-base budgeting, at least for a period of time until the overall pattern of spending for the “new paradigm” of RDM is identified and appears to be stable. All expenses, for all departments, should be justified on the basis of the same cost effectiveness and nothing should be sacred or excluded from this comparison.1
Some departments will be very unhappy
Efforts to implement an effective and optimized RDM program will result in movement of money from one budget to another and from one function to another, often resulting in an allocation of funds to departments that is considerably different than the traditional pattern. The authors have worked with utilities within which the marginal effectiveness of spending differed by a factor of 8 to 1 from one department to another. The utility could improve the effectiveness of dollars already in its budget by a factor of eight, by cutting one department’s budget and giving the money to another department to fund expenses that could not fit within its original budget.
1 The authors fully realize that the utility will be obligated to a good deal of spending that does not fit this evaluation directly. For example, equipment and construction are often required purely for safety reasons and to meet code, zoning, and other requirements. The authors do not imply that such expenses should be denied, just that they should not be excluded from consideration.
In the authors’ experience something similar is common, although perhaps not to that degree in most utilities. Institutionalized spending patterns still in effect at some utilities were for the most part established under regulation and prior to many of the changes in technology, and need, that characterize today’s power industry. It is almost certain that one or more departments will feel very cheated in this process, and that conversely a few will feel vindicated – they always knew their function was more worthwhile. This is a necessary aspect of cultural change which executive management must accept and manage.
17.4 STEPS TO MITIGATE AGING INFRASTRUCTURE EFFECTS
This section presents ideas and concepts – action programs - that will individually mitigate some of the aging infrastructure-related service reliability problems. Implemented selectively as a utility thinks appropriate in its case, they achieve synergies among both their improvements and spending and make the utility’s operations and planning a bit more compatible with approaches it will have to take to deal with the aging infrastructure.
Voltage Reduction on the Primary Distribution System
Chapters 7 and 11 pointed out that the application of a voltage, aside of any current that flows, creates a type of “voltage stress” on insulating materials which eventually leads to deterioration, and over enough time, will alone cause failure. Voltage stress contributes directly to aging – other factors of age are multiplied by its effects. Unlike thermal stress caused by current flow, which occurs only during peak conditions and then only when peak loads last for a considerable period of time, voltage stress of roughly the same magnitude occurs all 8,760 hours of the year. In fact, voltage stress is less during peak conditions (because of an increase in voltage sags, voltage is lower).
The relationship between voltage level and deterioration rate (and hence lifetime) is highly exponential. In the case of some types of UG cable, a 5% reduction in applied voltage will decrease voltage-induced degradation by 35%. This means expected failure rate from voltage stress is reduced by 35%. This will not render a 35% decrease in overall failure rate, because voltage alone is not the only factor causing deterioration. However, it will make a substantial difference – perhaps as much as a 15%-20% improvement.
Therefore, one means to reduce the stress, and increase the expected lifetime of UG cables and the insulation in transformers and voltage regulators, etc., is to reduce voltage to the lowest level consistent with operation within required voltage standards. The utility can implement a type of Conservation Voltage Reduction (CVR) as is recommended (and required) by some state regulatory commissions for energy conservation purposes, but aimed at lifetime extension. This is implemented at the primary voltage distribution level, by adjusting the boost on transformers, tap changers, and voltage regulators at the substation.
Methods of analysis and implementation for CVR are applicable for this purpose. The only modification of traditional CVR methods needed for this application is to analyze the system on a feeder by feeder basis to determine where voltage reduction would in fact have a worthwhile impact on equipment lifetimes. This will tend to be on feeders with substantial UG cable and/or very old, rather highly loaded service transformers (a good TLM program can be used to determine that).
Another factor that needs to be taken into account in assessing when, where, and how to apply voltage reduction for lifetime extension is the impact on revenues. Generally, demand levels are proportional to voltage. A 3% reduction in voltage will render roughly a 3% reduction in demand, although feeders vary greatly in this respect.
Due to the type of loads they serve, some feeders (usually those in industrial areas or residential areas with high saturation of AC and electric heat pump loads) would see no reduction in demand and revenues from a 5% reduction in voltage. A few others (mostly residential areas with high saturation of gas appliances) will see a 10% reduction in demand and revenues. Utility management needs to assess this impact, as it will occur on some feeders. It should be balanced against the expected savings due to the reduction in equipment failure rates and customer interruptions.
Planners and managers should not also use the demand reduction achieved in the pursuit of extended equipment life to justify deferral of required upgrades due to load growth. For example, one can calculate that if the voltage reduction rendered a 5% reduction in load, and load growth is 1.66% per year, then the reduction “bought three years” of deferral on any expansion needs, delaying the time until load exceeds capacity by three years. In truth this does not happen. The current that it carries thermally limits most equipment. Since a reduction in voltage can effect at most a proportional change in current, reducing needed investment in capacity will defeat the desired life extension effects of voltage reduction.
While the above may seem to involve a complicated set of evaluations, it is in fact straightforward. In addition, voltage-reduction can extend the lifetime and reduce the failure rates of equipment that are often both very expensive to replace and virtually certain to cause customer interruptions when it fails. It can be implemented at low or no capital cost, relatively quickly. A very comprehensive assessment can be done using traditional CVR planning methods (Willis, Tram, Powell, 1986), coupled with a detailed spreadsheet analysis of present and future costs and savings on a PW basis. The optimal operating voltage for each feeder is that which produces the most effective impact on the utility’s bottom line: expected costs due to voltage-stress related deterioration.
Adopt Reliability-Based Planning and Engineering Methods
Chapters 8, 9 and 12 discussed why modern power systems, particularly those in aging areas, are particularly prone to customer interruptions due to equipment failures, and how traditional engineering methods cannot always assure that all necessary and sufficient steps have been taken in their design to assure reliable operability at lowest cost.
The authors do not recommend that traditional planning tools (i.e., N-X contingency evaluation loads flows, etc.) be abandoned. Such tools are useful and cost little to use. They provide a good perspective on how the system will deal with each contingency and are often useful for examining what are called post-contingency conditions and determining if recommendations for special operating restrictions should apply after a failure has occurred.
However, utilities must augment their use of those tools with modern planning and engineering tools that work directly with expected reliability of service, tools that can assure measures taken to provide reliability of service are sufficient to reach the levels of customer service quality targeted by the utility. Such tools include a “reliability load flow” analysis of any of several types, and possibly a reliability-based system optimization (see Chapters 12–13).
This use of such tools will have three positive effects on the results that the utility obtains from both its system and all new capital investments:
1. Improved customer service quality. Application of these methods does result in better reliability of service. Planning and Engineering produce plans that are more robust with respect to contingency strength and tolerance to equipment failures, and devoid of sensitivities to relatively likely combinations of multiple failures. Very simply, the power delivery system is better designed from a reliability standpoint.
2. Lower cost. Reliability-based planning and engineering methods can be used to optimize cost effectiveness of capital spending for reliability. In fact, a considerable improvement in this regard is an almost inevitable result of their use. In a very real and practical sense, money spent on improvements can be optimized to buy the most “bang for the buck” in terms of improving reliability where that is most important to the utility. Money is both used more effectively and targeted more accurately at problem areas.
3. Improved predictability of results. The dependability of planning and engineering projections of performance from a reliability standpoint will improve dramatically. Traditional tools deal with reliability implicitly (as capacity margins for contingency backup). Modern reliability-based tools deal directly with reliability of service as a calculated design parameter and thus are much more accurate in determining what to expect in terms of results. Management can be more confident that it will obtain results and can better anticipate where and why problems might develop.
Use Budget-Constrained Planning Methods (Marginal B/C Ratio Prioritization and Pareto Analysis)
Generally, prioritization of capital projects, the selection and approval phase of the planning and engineering process, needs to be done with so-called Budget-Constrained Planning (BCP) methods (see Chapters 5 and 12, and Willis, 1997, Chapter 18). BCP methods should be used in order to fit within both the business model approach recommended here, and to permit valid cross-departmental comparisons of cost that balance capital and operating costs in an effective and completely valid manner.
Budget-Constrained Planning is an approach to prioritization, not engineering or planning method per se, and can be implemented along with planning and engineering tools at any level of analytical rigor and detail. It works best, however, when applied in conjunction with reliability-based methods.
The basic concept behind BCP was described with examples in Section 5.5. Alternatives for each project will be evaluated against one another and against alternatives for other projects on the basis of the same marginal bang/buck target ratio. This is exactly the same approach described for reliability-centered maintenance and used by utilities that practice that in Chapter 15.
Budget-constrained planning has proved effective for both large and medium sized utilities. It has successfully worked within Engineering departments that use only traditional tools and have very limited engineering resources, as well as those that used reliability-based evaluation methods in conjunction with fairly strong labor resources and skill levels in their Planning and Engineering departments. However, it works best in the latter environment.
The authors have seen BCP render capital-spending reductions of up to 30% while still permitting the utility to obtain necessary targeted levels of reliability performance in its system.
In many cases, executive management should expect that when BCP is implemented within the results-driven management structure recommended in Section 15.3, it will result in a noticeable (10% or more) increase in staffing and spending for the engineering and planning functions. BCP dramatically improves the results obtained from engineering effort (the marginal payback at one large IOU in the central United States was over 20:1!). Generally, money spent on more effort and better tools devoted to improving reliability and optimizing (cutting costs while improving performance) is very effective at obtaining results.
Optimize Against PBR Rules
Performance-based rates and penalties or incentives set down by regulatory authorities and/or customer contracts define precisely the costs and value to the utility of customer service performance. If interruptions of service cost $1/customer-minute, then the distribution utility would be less than maximally prudent from a financial standpoint if it were to spend more than $1 to reduce customer interruptions by one customer-minute.
Optimizing spending, engineering, and operation policies to minimize expected pay-out/maximize expected gain under PBR is sometimes referred to as “gaming” the PBR rules, but it is not a game and there is nothing fundamentally unethical or wrong in doing so. Through PBR, the regulatory process identifies the value that customer interruptions have to the utility. If regulators are displeased with the results of a particular PBR formula, they can respond by changing the PBR formula to provide more or less incentive, or to target a different definition of “good.”
Utility Efforts under PBR should be directed at Two Goals
1. Optimization of results. First, the utility should implement the type of optimization – minimization of risk – described in Section 13.5. That example was based on an actual investor-owned utility case. There, a hybrid analytical simulation method, admittedly a fairly advanced, highly skilled method for engineering, was used to determine policies and prioritize spending in order to minimize the utility’s total payout under a PBR penalty formula. However, the basic concept will work to good extent with less sophisticated engineering methods.
Proper implementation requires that this be coordinated with the overall RDM approach: the definitions of reliability used throughout all departmental evaluations under RDM must be identical to the definition of reliability or service problems used in the PBR. Ultimately, the PBR sets the utilitywide marginal cost of reliability.
2. Consistency of regulatory rule. The utility should make one effort it can to influence regulatory policy, so that rates and PBR rules are consistent with one another. If, through PBR, regulators put a certain cost on reliability of service (or lack of it) they really should approve a base rate structure that gives the utility the required amount of money to implement these changes. Marginal cost of reliability sets the optimum decision-making point for RDM: it is the value used as the target in prioritization and its use does assure cross-functional optimality in decision-making value. That is essentially defined by the PBR rules.
But the budget required to implement reliability improvements up to that level is not necessarily a function of that marginal value. The marginal cost of reliability is the derivative (rate of change) of reliability versus spending. Required budget is the total spending up to that point. Two utilities can reach the same marginal cost with very different budgets, as shown in Figure 17.1.
The point is that total allocated spending, and PBR defined penalties, can be set up so they are consistent. Ideally they should be. The authors have seen cases where that is not the case, and typically quite controversial issues develop as a result. The reason is that in such cases the regulatory rules as a whole can be “gamed” in the worst sense of the word. The utility can make decisions which are fully within the rules, yet that benefit some interested parties at the expense of others, in a way not intended by the regulatory process. This might mean “unfairly” favoring industrial and commercial customers over residential, or vice versa, generating extra profits at the expense of customer service levels the regulators expected to be attained, or favoring capital spending (investment that generates future profits) over operating expenses (which are only recovered). In such cases, the financially sound procedure for the utility to follow is to act in its own business interests (that usually means in favor of its stockholders) rather than its customers.
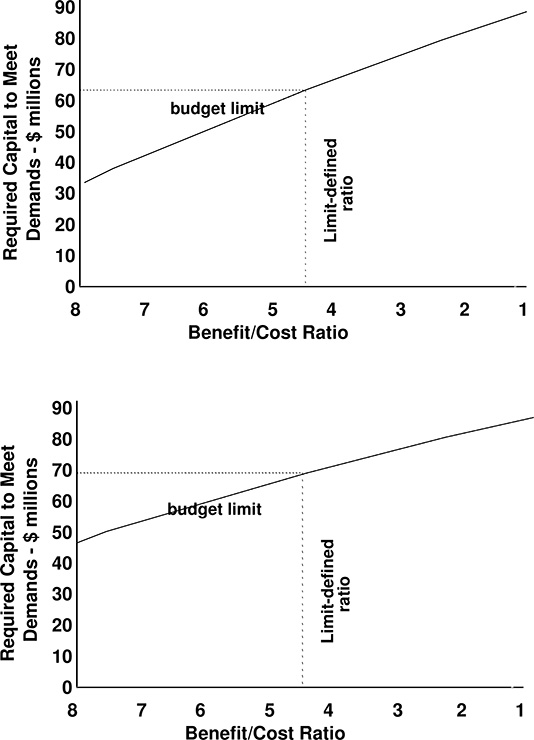
Figure 17.1 Marginal cost of reliability. Basically defined (very much a function of) the PBR formula, does not necessarily correspond to any specific budget level. Optimized budgets for two utilities are shown here. A theoretical, but realistic, example shows that one needs $62 million, the other - $69 million, to work up to the same level of effectiveness in spending for reliability. The reasons for this are numerous. One system may been traditionally allowed (by utility and regulator) to be less reliable than the other and thus need more reinforcement effort. One system could simply be bigger than the other (more customers) and thus need more money. Or, work in one system could be more expensive, for any wide range of reasons, than corresponding work in the other system. The important point is that one utility here needs about 10% more allowable expenses to be covered by rates than the other in order to adhere to the intent of the PBR. That happens only through effort to assure rates and PBR formula are consistent.
Reexamine and Revise All Standards and Guidelines
De-regulation, competition, changes in customer expectations, new planning and engineering tools, the operational IT tools discussed above, and PBR, all mean that the basis for priorities and decisions has changed dramatically since its standards, guidelines, and policies were last revised. The changes occurring in the period 1995 to 2005 are more dramatic than those that occurred during the five decades from 1945 to 1995. Despite this, many utilities are following basically the same approach they traditionally used. A few have not made anything but incremental changes since the early 1970s.
Make real changes
A rigorous and zero-based approach needs to be taken here. Innovation coupled with a good deal of skepticism both for the need to maintain traditional standards, and for the claims made for new ideas, needs to be applied throughout.
Outside help makes a difference
The authors strongly recommend that this examination be made in part by people who are quite apart from those people within the utility who use the standards and work with the policies. Utilities who perform this re-examination using internal resources only - professional personnel who “grew up” in the utility – tend to make only small changes. It is to be expected that people who have long used the existing standards both have faith in them and know little about competing possibilities. Those utilities who seek the input of experts from outside the company tend to examine more objectively the methods used elsewhere (including outside the United States) and ultimately make much more sweeping, and effective, changes.
Customer Service Quality and Cost are the Two Big Goals
During the 1980s and 1990s, electric distribution utilities began implementing large information systems in the management of their distribution facilities, engineering, and operations. This included AM/FM (Automated Mapping and Facilities Management), ALS (Automated Line Switching), AMR (Automated Meter Reading), CAD (Computerized Automated Design), OMS (Outage Management Systems), WOM (Work Order Management, RDM systems (which means, in this instance, Results-Driven Maintenance scheduling), and integrated systems called DMS (Distribution Management System) that linked some or all functions together. Some of these systems (OMS) directly affect customer service quality. Others indirectly affect it and are mostly justifiable on the basis of cost reductions (AM-FM), or efficiency improvements (WOM).
Decisions on what systems and how much IT to implement, and how to use it most effectively, should be based upon a uniform customer-service focused basis, using exactly the same bases for “bang for the buck” as applied in all other departments and to all other functions.
This is fairly obvious in the context of previous recommendations in this chapter. What may not be obvious is the priorities assigned to these various software systems will change greatly depending on the importance given to the customer service aspects of their use. How their priority in the eyes of executive management will rank depends greatly on whether the utility’s focus is mostly on reducing SAIFI or SAIDI. Where aging infrastructures are a major concern, this depends on how advanced the problem has become. As mentioned in Chapter 1 and demonstrated with example in Chapter 15, usually degradation in SAIFI leads that of SAIDI by several years. This is due to a number of interactions of failure rates, utilization ratios, and contingency flexibility (or lack thereof) in a traditionally laid out power system.
Therefore, the priority associated with each of the IT systems shown in Table 17.3 will depend on whether the utility’s immediate concern focuses mostly on reducing SAIFI, SAIDI, or some combination of both. For example, OMS systems help reduce duration of outages much more than they can influence frequency of outages (they only come into play once an outage has occurred). By contrast, RCM (reliability-centered maintenance) software tends to work effectively against failure rate (hence SAIFI), as does improved engineering and protection analysis software (CAD), whereas ALS reduces SAIDI, and if quick enough, SAIFI too.
The reason that SAIFI can be reduced by ALS is that reliability definitions often distinguish between momentary interruptions, which are those less than some arbitrary limit of time, and those that are longer. Events less than this limit (the IEEE standard being considered at the moment is five minutes), are classified as momentary interruptions (MAIFI) and do not “count” as events in SAIFI or SAIDI calculations. In such a situation, SAIFI can be reduced noticeably if automated switching within five minutes restores outages that would take more than five minutes to restore. In such cases they do not “count” with respect to SAIFI statistics. Actual SAIDI as experienced by customers will also fall slightly due to the faster restoration capability of the system as a whole.
Table 17.3 Power Delivery System Related IT Systems and Their Interaction with Major Aspects of Customer Service and Utility Cost
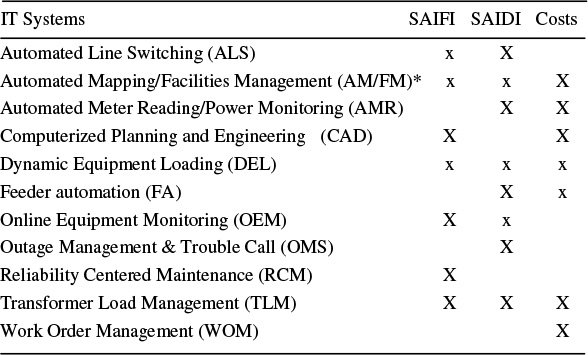
Table 17.3 lists some common distribution-related IT systems and their interaction with SAIDI, SAIFI, and cost control. Size of the X indicates degree of involvement.
Transformer-Load Management Systems
Transformer Load Management (TLM) systems are one of many IT systems which can be applied to power delivery systems. However, they deserve special attention because they can be used quite effectively to improve customer service, they can directly contribute to lowered failure rates among service transformers, and they have the among the highest payback ratios of power delivery IT applications.
TLM programs correlate monthly metered sales to customers with the transformers through which the sales to those customers were made. High levels of sales relative to a transformer’s capacity indicate a possible overloaded transformer, and put it on a “jeopardy list” that is sent to preventive maintenance, so the units can be checked and replaced if found to be overloaded. Good TLM programs use formulae based on type and number of customers, kWh sales, seasonal changes in load, and weather to estimate stress on each transformer and whether it is likely in jeopardy.
TLM systems produce very accurate results (about 90%) in the sense that units predicted to be overloaded are in fact overloaded, and few false positives (units predicted to be overloaded that are not). They also miss only a few overloaded units (estimated to be fewer than 5%). As a result, change out of units that will fail and have to be changed anyway can be scheduled at the utility and customers’ convenience. This reduces cost and improves reliability.
Effective TLM “programs” are much more than just software. They must include:
• Good procedures for use, including monthly inspection of the jeopardy list by field crews and replacement of units found overloaded.
• Proven feedback from the field. Information on units that were predicted to be overloaded and prove not to be, and on units that failed due to suspected overloads but were not on the jeopardy list, should be used to adjust the TLM analysis formulae.
• Adjustments of the jeopardy list functions to accommodate the corporate-wide marginal cost of reliability.
Extending TLM to include performance management of service
The concept of using monthly operating records in an analysis of possible trouble spots can be extended in two ways into what is called a Distribution Performance Management (DPM) system.
First, the analysis is extended to include not just transformers, but the entire lower delivery system (laterals, service transformers, and service level circuits and drops). Using facilities data, as well as metered data, trouble records, weather and other "monthly” records, a DPM can infer where trouble (failure) is likely to occur, as well as where poor quality problems (excessive voltage drop) is likely to occur in any part of that system. Really “smart” programs even use the results of primary distribution voltage analysis to determine the voltage stress on service transformers. This adds only a slight amount of improvement in the resulting analysis but in an integrated software system, costs next to nothing to add.
Secondly, the reporting of a DPM system is extended beyond what are traditional TLM reports, which include only the jeopardy list and perhaps also a list of severely under-utilized transformers (those where no-load losses are high enough to justify switching out to a much smaller size). DPM typically adds a series of management reports that include:
• Predictive jeopardy lists – a “smart” program can look ahead several months. The utility can schedule during the spring change-outs that need to be made before summer.
• Asset management lists for the service transformer set, including utilization of units, average monthly loss of life (during peak months the average unit may lose more than one month’s life, during off peak, less, etc.), predicted failures and replacements over the entire set, etc.
• Predictive trends about future failures, replacements, loss of life, and low voltage events.
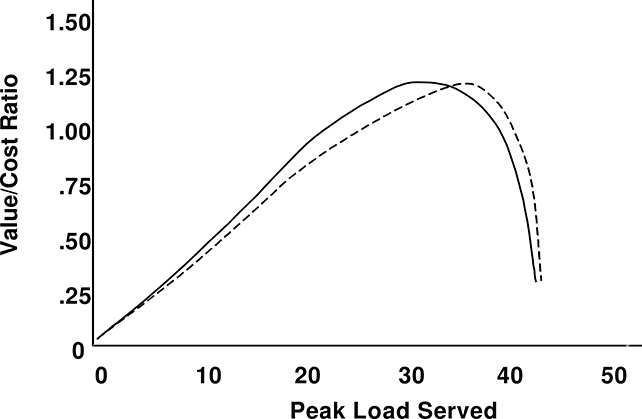
Figure 17.2 The value obtained per unit of investment in a transformer depends tremendously on the way it is used. Here, the ratio of the value/cost for two 32 MVA transformers is shown as a function of the peak load level it will be used to serve. Solid line shows the transformer example from Section 15.4. Value varies by 22% over what could be called the useful range for this transformer (24 – 41 MVA – those loads over which value > cost). Optimum loading is 32 MVA. The dotted line shows the curve for the same type of 32 MVA transformer but at a different site with a different annual load curve shape. Value curve obtained is different as is the optimum peak loading, 36 MW.
TLM and DPM programs often have very high economic paybacks – on the order of less than a year. The major expense is in developing a reliability data link between the customer records and the transformer records (tying each customer to the correct transformer).
17.5 THE AGING INFRASTRUCTURE MANAGEMENT PROGRAM ITSELF
Expect to Need to Use Novel and New Approaches
Despite the fact that it took decades to get into the situation, aging infrastructures are a new and very different problem than those the utility has had to manage in the past. Management and professionals should expect that the ideas, methods, and tools that it ultimately uses will be different, too. An open mind, a willingness to experiment with purpose, and an innovative mindset are needed.
Data are Always Imperfect and Messy
Throughout this book, the authors have discussed the practical realities of data for aging infrastructures: its never enough, its never clean, and its always messy to deal with. Chapter 16’s case study make this particularly clear. CL&P’s pole asset management team had gathered all the data it could on the longest possible history of the company’s pole ownership, some of it coming from innovative places. A considerable amount of manual labor by interns and co-op students was involved in transcribing old records. Ultimately, some data were more useful than others, but a good deal of what proved valuable in the long term was data it gathered “just because it could” up front.
So the lesson is: look wide and far for all the data that might be useful, now or in the future. Put measured and reasonable efforts, including labor into obtaining it. Don’t obsess on cleaning it up: dirty data (with gaps and missing elements) is dirty data, but still worth something if used with analytical methods that are relatively insensitive to such quality issues.
Long-Term Historical Data is Extremely Useful
One cannot expect to build useful and defensible 60-year models from only 15 to 20 years of data. Some means of finding a few data points from long-ago needs to be found, even if the data’s “fuzziness” might be substantial (analytics have ways to deal with that). A key element of success in Chapter 16’s case study was that CL&P’s project team tried to get the longest historical database they could, even if the older elements of it were somewhat incomplete and less detailed than recent data history.
Don’t Assume Old Data are Not Accurate
In that case study, CL&P found data points for some measures of its pole ownership from paper records made in 1933 and 1947. There is a temptation to dismiss old records that are potentially not accurate or important. Although gathered and maintained in a time before computers and precise instrumentation like today’s, the data from those past years were managed by people who were, as far as is known, just as dedicated and just as concerned with accuracy as today’s work force. Data from long ago have to be kept in perspective, but are very likely as accurate as today’s counterparts.
“Bulk” Labor Spent One Time on Data Can Be Worthwhile
A project team should not shy away from just rolling up its sleeves and slogging through data, if the effort looks worthwhile and is one-time only. Here, co-op students and interns can be very useful, as was the case in Chapter 16, where CL&P had such temporary employees transcribe thousands of pages of ancient paper records into a computerized file. Total burdened cost in that example was below $50,000 for this effort, but the data proved many times more valuable in the pole management and other equipment category effort for years afterward.
Advanced Analytical and Pattern Analysis Methods Are Useful
Most utility engineers and managers have a sound foundation in basic statistical analysis and are confident it can extract what is needed from data. This is not true: basic statistical methods often miss a lot of information hidden in masses of messy data.
But it is the flip side of this assumption that can be fatal to a project team: many utility planners, engineers and managers assume that if standard statistical methods fail to find meaningful information in the data – if regression finds no correlation, if statistical analysis shows no tight distribution, then the data are useless. This is not the case in most situations.
Analytics – what the authors often refer to as “statistics on steroids” – can often find surprising amounts and qualities of patterns, correlations, if-then-but-for relationships within large masses of data, such as exist for utility infrastructures. Exactly what “analytics” is and how and why it differs from and goes beyond normal statistical analysis is far beyond the scope of this book. However, in summary analytics involve pattern recognition, logical analysis, and non-traditional statistical methods extended to cover monstrous amounts and dimensions of data. It often finds surprising amounts of information hidden within masses of data as well as surprising facts about non-linearity and special circumstances that are extremely useful.
Advanced Analytical and Pattern Analysis Methods Are Not Enough
Even when using the very best methodology on a considerable body of data, analysis, even advanced analysis, is not going to do a sufficient job of identifying and prioritizing equipment and program focus. The analytical results in the example given here are about as good as they get. Here a very comprehensive (“advanced”) type of analysis was able to build a statistical model that was accurate at predicting trends for the entire population, and as a guide for spatial and location-specific inspection and prioritization.
Chapter 16’s project is a case in point. An information theory based analysis indicates that about 40% of the knowledge ultimately used by the utility to make decisions about CL&P’s wood pole infrastructure management program was generated by the historical data analysis and the models developed from it. Pole inspection and tracking provided roughly the same amount of knowledge. The Physical Pole Examination Program (PPEP) generated about 12%, and the remainder of information used around 10%, came from other sources. The authors believe this is representative of what to expect in most similar studies of large sets of “commodity” level power system equipment.
In general, analysis of historical data is most useful because it determines a fully consistent set of models or information for:
a) failure rate curves (as in Figure 16.11)
b) equipment demographics model (Figures 16.12 and 16.14 – 16.16)
c) long-term base case trends (Figure 16.17, etc.)
The last, c, is the cost basis for determination of savings from any program that is developed out of an aging infrastructure initiative, and therefore a cornerstone of the program. A rigorous, traceable method and process from data to conclusions is needed for credibility and defense of the recommendations.
Analysis and Models Cannot Neglect NCR and Retirement
Failures were actually only one of three causes of poles “leaving the asset base.” In Chapter 16’s case study, for poles newer than about 40 years, it is more likely a pole is removed because of NCR (non-condition based) reasons like relocation, or retirement, than failure. NCR and retirements are less an issue for some types of equipment (i.e., MV breakers) than for others. But for poles and other distribution equipment they are often, as was the case here, larger effects than failure rate in the early years of modeled lifetime characteristics.
More generally, NCR and retirement are on the order of the failure rate and thus have to be taken into account (see Appendices).
Focus on Developing a Good Basic Model First; Do the Details Later
The authors recommend an approach like that used in Chapter 16. Initially, the project team put aside all the small “ifs, ands, or buts” so it could focus on only the basic framework of its first model. It assumed failure, NCR, and retirement rates would be stationary over time, although it knew that strictly speaking they probably were not. It knew effects were unlikely to be identical in all parts of the system, but neglected that initially. It left out a host of little details that were no doubt real, but would get in the way of quickly determining, testing, and setting up that first basic model. Eventually, the project team went back and re-examined all those details, folding many of them into its model. But this approach permitted it to get a good, basic, workable model done first.
An Asset Base Model Is A Useful and Needed Planning Tool
In Chapter 16, CL&P built failure/survivor Asset Base Model first, a model that could analyze and project trends for its entire pole base, but one that had no geographic element to its data: it could project how many poles were at risk, etc., but not tell CL&P where to find them. In Chapter 15’s company discussions, many of the companies had detailed models of the equipment they owned and models, structured around their needs.
Since CL&P wanted to manage its aging equjipment to maximum business value, it needed a good Asset Base Model and used the sustainable point survivor model approach (Appendix A) populated with the data developed as described in the first half of Chapter 16. Initially, it was developed as a spreadsheet. Within a year, however, it was converted to a SAS basis in order to use more advanced analytical tools. Functions representing failure rate, NCR rate, and retirement rates as a function of years since installation were found that best fit the historical record of pole ownership. When these functions were used in this model, the model replicated the CL&P history and ownership statistics with little error.
This is the appropriate first step. Build the model that apprises the problem and puts it in a corporate business context first. The Asset Base Model did, permitting CL&P management to understand the scale and characteristics of the aging pole problem before them, how soon and where and how it would effect their business, and what the scale and characteristics of potential solutions to it would be. At that point, work on obtaining that critical geographic information could be justified.
Geographic Information Is Needed for Implementation
Useful as an Asset Base Model is, eventually a utility will need geographic pole locational data to do anything meaningful. Both Chapter 16’s CL&P, and the two electric utilities and university power system owner discussed in Chapter 15, all used GIS technology to target and manage their aging infrastructure programs. In Chapter 16, CL&P use a non-GIS model that treated all 437,226 poles it owned as one big, location-less set. That Asset Base Model was an essential first step. It could tell CL&P that it had 19,240 poles that were over 65 years old, and that these poles would cause an expected amount of trouble and cost over the next ten years. It could answer myriad questions and run dozens of scenarios in supporting management in understanding the problem and the range of options open to them.
But the Asset Base Model could not tell CL&P where to find those poles in order to inspect, service, or replace them as needed. The utility had to go on to develop a geographic and database with three capabilities:
- It could locate every pole in its system: it could find any particular pole in its system database out in its system, and it could find the data for any pole out in its system in its database.
- It could relate each pole record in its geographic pole database to the asset base’s analysis of the pole population: this pole is among the 12% thought to be the oldest in the system, etc.
- It had statistics and other measures of the dependability of its analysis. It knew its data were not 100% reliable, but it had mathematics to tell it how reliable and when it was reliable enough.
Geographic Information Can Be Developed Even When Not Directly Available
The authors deliberately picked a case study for Chapter 16 in which the utility had no pre-existing way to tie pole records and age/condition measures of the Asset Base Model together, in order to show how this can be done in such circumstances. The utility there used municipal tax records, street and road department data, etc., to determine when each area of the city was first built out, then correlated that with pole locations and refined the results after a good deal of hard work and statistical analysis. It reasoned that the electric system in an area would date from about the time the first buildings were built there. From this data, and with a lot of statistical work, it built up an estimated age for each of the 437,226 wooden poles in its distribution systems.
Strictly speaking, that data developed in this way proved only good enough to guide an inspection program. The location age estimations developed in this innovative GIS program were a bit “fuzzy,” but useful enough as a guide to where to inspect in order to tie down condition well enough to be effective in managing pole quality. The inspection could not have been justified or cost effective without this locational data, imperfect as it might have been. This imperfect data would have not led to good results without inspection to help focus mitigation and management programs more effectively. Both were mutually supporting elements of the overall solution to “where are the bad poles?”
Physical Examination of Equipment is Useful, if Focused
Very few aging infrastructure management programs will be effective and near-optimal as to economics without the use of inspection and tracking of condition. This includes testing and research to build up a base of knowledge about the seriousness of various grades of deterioration found by inspection, etc.
In Chapter 16, investigation and analysis of actual poles was carried out on nearly 1,500 poles that had been withdrawn from service due to failure or NCR reasons. These poles were cut apart and the level of deterioration and loss of strength recorded and analysis. Both the average level of deterioration as a function of estimated age, and the standard deviation of deterioration as a function of age were determined and used to refine estimates of condition for every pole in the system. An important point here is that, by the time the utility carried out this work, its project team knew exactly what type of data it needed and how it would use that: the work was done specifically too look for information to support the Asset Base Model and Geographic Pole Model.
Inspection and Tracking Are Important
Strictly speaking, inspection and tracking do nothing directly to solve the problems caused by aging equipment. But the information they provide makes programs and tools that do solve the problem much more effective. Inspection and tracking are examples of the value of information. They also show the importance of the “new” element. What matters is equipment that needs attention now. Models and databases can come close to providing this, but inspection and tracking focus attention as much as possible. No effective aging infrastructure management system can exist without some element of these activities.
Run to Failure is Often the Only Cost-Justifiable Option
This case study determined that proactive, economically justifiable replacement of most poles in a power system will just never happen. A case just cannot be made for replacement a pole earlier than its end of life in most situations. Any practical, realistic program has to deal with this fact: the “optimum” case for almost all commodity equipment like poles and service transformers is to simply run it to failure and deal with the failures when they occur. The owner/operator has to find the most effective way possible to deal with the levels of operating issues that that will be created, just as the utility has to find a way to live with the business consequences of run to failure. There are no more cost effective options.
Sustainable Point Is a Useful Management Concept Not Just a Useful Modeling and Analysis Concept
The sustainable point is a simple concept. Eventually, given that current operating policies and inspection, service, and repair and replacement policies are followed, the system will reach a stable point of so many failures, so much cost, such and such a SAIDI, etc. This is a vitally useful concept as an operating framework to use to work on aging infrastructures.
1) Things don’t keep getting worse forever. The system is headed toward a stable situation.
2) If the current situation is better than the sustainable point, then in some way, the system is living on borrowed time.
3) The sustainable point can be moved by changing operating policy, inspection, and service and repair replacement policies. In fact, the only way to move it is to change something: the challenge before management is to answer the question, “What do we change, and how?”
4) Things change slowly, period. Escalating failure rates and repair costs will continue to escalate, but slowly, if inevitable. No catastrophic “cliff’s edge” exists. The system will continue to trend toward the sustainable point, but take years to get there. And all solutions act slowly, too.
The Base Sustainable Point Will Not Be Acceptable
The authors have never seen a base case in which the sustainable point – the stable point of ongoing failure rates and expenses to which the system will eventually deteriorate – that is acceptable from a business standpoint. Medium voltage breakers as maintained at some utilities come as close as anything seen. But the case given in this chapter is a representative example. CL&P was looking at a doubling of age-created problems over the next twenty years, and a thirty to fifty year period during which it gradually would reach the sustainable point in most of its equipment categories, at which point customer reliability, breakdown and failure, and safety issues are all three to seven times as bad as today’s.
Driving Straight for the Sustainable Point Is Usually Non-Optimal
By changing operating policies, O&M practices, and service and repair plans, a utility can move the sustainable point to something that it finds acceptable. In fact it has a good deal of choice, depending on what it wants, how it wishes to operate, and, of course, how much it wants to spend, or not. In all cases the authors have seen, there is no doubt that, eventually, spending will have to rise, a lot.
But in no case the authors have seen is the optimum business case for the utility drive to the new, long-term sustainable point immediately. In almost all practical cases, the sustainable point, with its catastrophic levels of reliability problems and operating costs, is so far into the future that time-value money economics attaches little value to its business consequences. What is important is the noticeable erosion of business performance over the next few years that current trends will create: a 4% increase in SAIDI contribution next year is more important than a times-five SAIDI contribution increase 42 years from now. “Now” is the time period driving action now.
Leave the Long Term Solution for the Long Term
“Now” dominates spending decisions at utilities and most other businesses, and in almost all cases it should. The focus of any good plan for aging infrastructures will address current and short-term effects cost effectively, while contributing in some way to the long-term eradication of the problem. In the examples covered in Chapters 15 and 16, the only important longer-term aspect of the aging infrastructure programs was that their short-term programs were economically close to optimum, and that they were not only not worsening the long-term problem, but actually contributing to their solution, even if they were not entirely solving those problems.
Chapter 16 showed in detail how the wood pole management program developed, there was only the front end of a decades-long delaying action that gradually moves the sustainable point, even as it focuses at any point on “what can we do over the next five years to keep things under control in a cost-effective manner?” But this is good enough – in a practical world, it’s about all the utility should expect.
The Final Product is a Criteria-Driven Program
CL&P’s program in Chapter 16, as well as the three utility examples in Chapter 15 that involved managing aging of an infrastructure – Big State Electric, Mid-State Electric, and Big State University system – all ended up with a fairly straightforward, easy-to-implement program for execution. Pole replacement is driven by criteria based on age, inspection, and other factors. Poles meeting the criteria are replaced. Those that do not, are not. The intricacy and complexity, and labor and cost, are all in the data gathering and vetting, analysis, model building, and application that determine the criteria. The criteria can change over time. It is a function not only of the pole population and its characteristics, but of the utility’s business situation, needs, and strategy.
This is a recommended approach. Isolate whatever complexity and involved analysis is needed into a process that sets simple and easily executed criteria. Make that process capable of varying the criteria and matching it to business needs. The actual asset management program, then, will be straightforward to execute, and not require complex models and data analysis.
Mitigating the Consequences Often Works Better Than Solving the Problem
An effective tool in the case study “solutions” given in Chapters 15 and 16 was to change the system’s sensitivity to the problems failing equipment create. In Chapter 16, CL&P’s use of a Smart Switching program reduced the consequences of wood pole created outages. Big State Electric made operating system changes to reduce the reliability impacts of aging equipment. These changes were part of the most cost-effective solutions to short term business performance issues, even if they did nothing directly to “solve” the problem of aging poles. Mitigating the symptoms is not the full solution in most cases, but it is nearly always an element to be mixed with actual age-control programs, as was the case in those examples.
Continuous Improvement
Annually, the performance of the entire aging infrastructure management program should be reviewed, the Asset Base Model and the Geographic Locational Model and all planning and decision-support tools and processes should be examined as to efficacy and possible improvements that could be made, and improvements should be made where they appear to be cost effective. All the assumptions made and small factors left out initially were, in time, re-examined.
Aging Infrastructures Never Go Away
The examples and discussions throughout this book all make for the same “big picture” conclusion: aging infrastructures will be with the utility forever. No matter that once upon a time every element in every utility system was new: any modern power system has a large portion of very old equipment. When managed well, an aging infrastructure continues to have elements within it that age, and continues to have some elements within it that are quite old. Among the most cost-effective strategies available to “fight” the effects of aging infrastructures is life extension – make the equipment last longer so that eventually it becomes even older.
Therefore, a well-designed and executed aging management program will extend life, and keep old equipment longer. Optimization will result in this management program reaching a sustainable point: the infrastructure will have that portion of old equipment on an ongoing basis.
Therefore, Aging Infrastructure Management Programs Are a Permanent Fixture for Utilities
Today the analysis, planning, and maintenance programs needed to manage aging infrastructures are new to many companies – activities forced on them by the realization that they must manage an aspect of their systems they did not have to address in the past. But these challenges are not going away: the aging infrastructures will be with the utilities forever, and thus the programs needed to manage them will be, too. For this reason aging infrastructure management programs should not be treated as one-time-only projects. Electric utilities need to weave the tools, processes, and resources needed to handle aging into their mainstream institutionalized processes and organization, for they will be a necessary part of their future forever.
BIBLIOGRAPHY
Brown, R. E., Electric Power Distribution Reliability – Second Edition, CRC Press, Boca Raton, FL, 2009
Brown, R. E,. Business Essentials for Utility Engineers, Marcel Dekker, Boca Raton, FL, 2010
Brown, R. E. and J. J. Burke, “Managing the Risk of Performance Based Rates,” IEEE Transactions on Power Systems, Vol. 15, No. 2, May 2000, pp. 893-898.
Brown, R. E. and Bruce G. Humphrey, “Asset Management for Transmission and Distribution,” IEEE Power and Energy Magazine, Vol. 3, No. 3, May/June 2005, pp. 39-45.
Brown, R. E. and M. M. Marshall, “Budget Constrained Planning to Optimize Power System Reliability,” IEEE Transactions on Power Systems, Vol. 15, No. 2, May 2000, pp. 887-892.
Brown, R. E. and J. H. Spare, “Asset Management, Risk, and Distribution System Planning,” IEEE Power Systems Conference and Exhibition, New York, NY, Oct. 2004.
Brown, R. E. and J. H. Spare, “Asset Management and Financial Risk,” DistribuTECH Conference and Exhibition, San Diego, CA, Jan. 2005.
Butera, R., “Asset Management For The Distribution Pole Plant - Closing The Performance Gap Between Traditional Maintenance And Asset Management,” IEEE Power Engineering Society Summer Meeting, July 2000, pp. 561–565.
Center for Petroleum Asset Risk Management, “Section 3: A Brief Background of Real Asst Risk Management,” in Petroleum E&P, 6 pp.
Humphrey, B., “Asset Management, In Theory and Practice,” Platts Energy Business & Technology, March 2003, pp. 50-53.
Markowitz, H., “Portfolio Selection,” Journal of Finance, Vol 7., Number 1, 1952, pp. 77-91. (This paper covered work for which Harry Markowitz was eventually awarded the Nobel Price in Economics).
McCullough, J. J., “GSU Transformer Health Monitors Combining EMI Detection with Acoustic Emissions Measurement,” Proceedings of the 38th Annual Frontiers of Power Conference, Oct. 24-25, 2005, Oklahoma State University.
S. F. McFarlan, “Portfolio Approach to Information Systems,” Harvard Business Review, Dept-Oct. 1981, pp. 142, 150.
Morton, K., “Asset management in the electricity supply industry,” Power Engineering Journal, Vol. 13, No. 5, Oct. 1999.
J. Ostergaard , J. and Jensen, A.N. Can we delay the replacement of this component?-an asset management approach to the question, CIRED 16th International Conference and Exhibition, June 2001.
Pareto, V., Manuale di economia politica, Centre d'Etudes Interdisciplinaires, Université de Lausanne, 1906.
Philipson, L. and Willis, H.L., Understanding Electric Utilities and De-Regulation – Second Edition, CRC Taylor and Francis, Boca Raton, FL, 2005
Seevers, O. C., Management of Transmission and Distribution Systems, Fairmont Press, Lilburn, GA, 1995.
Timperley, J. E., “EMI Diagnostics Detects Transformer Defects,” Proceedings of the 2005 Doble Conference, Boston, MA, April 2005.
Van Schaik, et al., “Condition based maintenance on MV cable circuits as part of asset management; philosophy, diagnostic methods, experiences, results and the future,” CIRED 16th International Conference and Exhibition, June 2001.
H. L. Willis, Spatial Electric Load Forecasting, Marcel Dekker, New York, 1996
Willis, H. L., Power Distribution Planning Reference Book – Second Edition, Marcel Dekker, New York, 2004.
Willis, H. L., Tram, H. N. and Powell, R. W., “A Computerized, Cluster-Based Method of Building Representative Models of Distribution Systems,” IEEE Trans. PAS, March, 1986, p. 321b.