CHAPTER FIFTEEN
INTRODUCTION
The vast majority of the 1000-plus NCAA member institutions find sports to be a money-losing endeavor. These losses are expected at each of the nearly 300 Division II and over 400 Division III member institutions, where the athletic department is viewed as an integral part of the university, as indicated by the Division II and Division III philosophy statements. The financial expectations for the members of Division I are typically quite different, with intercollegiate athletics viewed as a potential money-maker. However, as indicated by the NCAA’s most recent financial survey covering the period from 2004–2006, published in 2008, the potential is rarely realized, and the results are usually the same as in Divisions II and III. If institutional support is excluded, none of the 118 members of Division I-AA or the 93 members of Division I-AAA operated profitable athletic departments in 2006. The median I-AA institution lost $7.1 million and the median I-AAA member lost $6.6 million that year.
The financial expectations are much greater for the 120 members of the big-time world of college sports that is NCAA Division I-A. Nineteen universities—most of whom were members of the BCS conferences—had profitable athletic programs, and the median net revenues over expenses were $4.29 million in 2006, excluding institutional support. The remaining 100 schools in Division I-A lost money, with a median negative net revenue of $8.92 million, excluding institutional support. Overall, then, the gap between the median positive net revenues and the median negative net revenues was $13.2 million in 2006, approximately $2 million more than the gap in 2004. The median member of NCAA Division I-A lost $7.27 million in 2006. A closer look behind these numbers is warranted.
In 2006, the median institution in Division I-A fielded 19 teams, the median institution in Division I-AA fielded 18 teams, and the median institution in Division I-AAA, which does not have football teams, fielded 16 teams. However, the only sports that generate net revenues over expenses at almost all of these schools are football and men’s basketball, with a handful of schools also able to run profitable programs in regionally popular sports such as ice hockey, women’s basketball, and wrestling. All of the other sports lose money. Thus, the football and men’s basketball programs must generate significant net revenues in order for the entire athletic program to operate profitably. Despite generating far less revenues than football programs, men’s basketball programs have a greater likelihood of profitability than football programs in both Division I-A and I-AA. Sixty-eight Division I-A men’s basketball programs made money in 2006, with a median profit of $2.72 million. Fifty-one teams lost money, with a median loss of $812,000. Overall, the 119 Division I-A men’s basketball programs had median generated revenues of $3.98 million, with median expenses of $3.06 million in 2006. The median program profited $1.58 million.
The vast majority of the Division I-AA men’s basketball programs lost money in 2006, with a median loss of $529,000 at these 108 institutions. Only 10 Division I-AA men’s basketball programs made money, with a median profit of $187,000. Overall, the median Division I-AA men’s basketball team lost $474,600. In Division I-AAA, 84 schools had a median loss of $774,000 in 2006, while 9 teams made a median profit of nearly $1 million. In total, the median I-AAA basketball program lost $639,600 in 2006.
As noted in the previous chapter, big-time college football is a potentially lucrative business. In 2006, 56% of Division I-A institutions realized this potential, earning a median profit of $8.8 million. It is safe to say that many of these 67 institutions were members of the BCS conferences. Conversely, 52 Division I-A football programs lost money, with a median deficit of $2.5 million. Overall, the median Division I-A football team profited by $5.35 million in 2006.
The financial story is much different in the off-Broadway world of Division I-AA football, where only five football programs generated even minimal profits in 2006. However, 113 Division I-AA football programs lost money, with a median deficit of $1.28 million. Overall, the median football program in Division I-AA lost $1.30 million in 2006.
Across all three levels of Division I athletics, several items are worth noting. First, average revenues and average expenses are both increasing, with expenses growing faster than revenues. Second, there is a continually increasing separation between the “haves” and “have-nots” of college sports. The schools that are making money are making more of it, and those that are losing money are losing more of it. Finally, between 16 and 19 of the 330 Division I institutions were profitable in any given year from 2004–2006. The remainder lost money.
Although Division I-A, I-AA, and I-AAA institutions compete against each other for NCAA championships in all sports other than football, it is this one-sport distinction that marks the difference between these levels of competition. In reality, Division I-A occupies an entirely different financial stratum than the others, with the median institution having approximately four times the amount of both total revenues and expenses. A brief discussion of the sources of revenues and operating expenses in college sports sheds additional light on these differences.
Ticket sales are the single largest source of revenue for Division I-A institutions, with the median school collecting $7.4 million in 2006. This is approximately 26 times the median amount earned in I-AA and 42 times the amount in I-AAA. Fundraising is the second most important revenue source, with the median I-A member bringing in $5.8 million in 2006, or approximately 9 times the amount in I-AA and 12 times the amount in I-AAA. The median athletic department in Division I-A receives 20% of its funding—$7.2 million per year—from the institution despite the fact that most are supposed to be auxiliary enterprises that are financially self-supporting. While the athletic departments in Divisions I-AA and I-AAA receive slightly less institutional support (a median amount of approximately $7.1 million in I-AA and $6.6 million in I-AAA in 2006), it constitutes over 70% of the total revenues at these schools. When looking at the overall profits or losses at any one NCAA member, it is appropriate to exclude institutional support from the revenue equation. Although it does represent the transfer of administrative funds to the athletic department from the institution, it does not represent monies that are otherwise earned by the institution because of the athletic department. Similarly, student activity fees provide Division I-A athletic departments with slightly more revenue than in I-AA or IAAA ($1.4 million versus $872,000 in I-AA and $511,000 in I-AAA) but constitute approximately 15% to 20% of the total revenues of the latter groups. Thus, the median Division I-AA and I-AAA schools receive over 70% of their revenue from their institutions and students, and are hardly self-sufficient. Table 1 shows net operating results excluding institutional support.
The various NCAA and conference distributions discussed in the previous chapter bring in much more revenue to the median institution in Division I-A ($4.87 million in 2006) than in Divisions I-AA and I-AAA ($395,000 and $232,000, respectively). Again, this is largely due to the dominance of the six power conferences. Finally, the median Division I-A school earns much more from broadcast rights ($168,000 in 2006), concessions, programs and novelties ($604,000), licensing royalties, advertising and sponsorships ($1.33 million), and miscellaneous items ($592,000) than does the median school in I-AA and I-AAA (approximately $257,000 and $252,000, respectively, for all of these items combined). Overall, the median Division I-A school had revenues of $35.4 million in 2006 (or $26.4 million when excluding institutional support), whereas the median Division I-AA and I-AAA institution had revenues of $9.64 million and $8.77 million, respectively (or $2.35 million and $1.83 million when excluding institutional support).
On the expense side of the ledger, the single greatest cost at all three levels of Division I is university paid staff salaries and benefits ($12.18 million in I-A, $3.61 million in I-AA, and $3.00 million in I-AAA). The second largest expense at all three levels is funding for athletic scholarships, on which the average Division I-A school spent $6.02 million, the average I-AA institution spent $2.88 million, and the average I-AAA school spent $2.76 million. Other average operating expenses which differed significantly between Division I-A and Divisions I-AA and I-AAA include team travel ($2.67 million versus $911,000 and $762,000); guarantees and options to visiting teams ($1.2 million versus $61,000 and $54,000); equipment, uniforms, and supplies ($1.2 million versus $381,000 and $285,000); fundraising ($1.2 million versus $215,000 and $305,000); severance pay ($189,000 versus $36,000 and $37,000); game expenses ($1.55 million versus $239,000 and $234,000); and recruiting ($677,000 versus $220,000 and $163,000).
Table 1 Net Operating Results (Medians)—Division I
| 2006 Median Values | |
| Football Bowl Subdivision | |
Total generated revenues | $26,432,000 |
Total expenses | $35,756,000 |
Median net generated revenue | ($7,265,000) |
| Football Championship Subdivision | |
Total generated revenues | $2,345,000 |
Total expenses | $9,485,000 |
Median net generated revenue | ($7,121,000) |
| Division I Without Football | |
Total generated revenues | $1,828,000 |
Total expenses | $8,918,000 |
Median net generated revenue | ($6,607,000) |
Source: Daniel Fulks, 2004–2006 NCAA Revenues and Expenses of Division I Intercollegiate Athletic Programs Report (2008). © National Collegiate Athletic Association. 2008–2010. All rights reserved.
In addition to these differences in operating expenses, Division I-A institutions spend more on facilities maintenance and rentals ($5.2 million) than Division I-AA or I-AAA institutions ($594,000 and $365,000). Capital costs constitute a major aspect of total athletic expenditures and are not included in the aforementioned discussion. The NCAA funded study “The Physical Capital Stock Used in Collegiate Athletics” and a companion study “The Empirical Effects of Collegiate Athletics,” both excerpted in this chapter, detail the exorbitant spending on athletics-related facilities by Division I-A institutions and conclude that an “arms race” related to these facilities is occurring. This reflects the recent and still ongoing multibillion dollar spending spree on athletic facilities.
Overall, Division I-A athletic departments had median expenses of $35.8 million in 2006. The median expenses were $9.5 million in Division I-AA and $8.9 million in IAAA.
See Table 2 for a summary of revenues and expenses for 2006 for the Football Bowl Subdivision. Table 3 details sources of revenues for 2006 for the Division I Football Bowl Subdivision, the Football Championship Subdivision, and Division I (without football). Table 4 breaks down operating expenses for 2006 for the Division I Football Bowl Subdivision, the Football Championship Subdivision, and Division I (without football). Table 5 offers information on the naming-rights deals at various NCAA facilities.
Although the above analysis is certainly important, it must nonetheless be taken with a requisite grain of salt. Standard accounting techniques across NCAA institutions are lacking. In addition, related-party transactions involving other departments within the university are commonly used and some revenues and costs are improperly allocated across sports within the athletic department.
Former University of Michigan President James Duderstadt addresses these topics from both a macro and micro perspective, with a focus on Michigan’s athletic department in “Intercollegiate Athletics and the American University: A University President’s Perspective.” The review of the business of sports at the University of Michigan, one of the powerhouses of the industry and a member of the Big Ten conference, continues with a look at the athletic department’s internal budget documents for 2009–2010. Michigan’s profitability in intercollegiate athletics is the exception rather than the rule. In addition to gaining a university president’s thoughts, the findings of a Knight Commission on Intercollegiate Athletics survey highlight another important campus constituency’s perceptions of college sports—those of the faculty.
The fairly bleak financial outlook for most intercollegiate athletics programs has led to an investigation of the indirect impacts of athletics on the institution. The athletic department is often the most visible aspect of the institution. As the front porch to the institutional house, it is important to attempt to know the impact of athletics on institutional fundraising, the size and quality of the student body, and the advertising and public relations of the institution. Anecdotal evidence suggests that these impacts can be substantial, as it has been at Butler University, Gonzaga University, St. Joseph’s University, George Mason University, and the University of Florida in recent years. However, Robert Frank finds that these impacts are very small, if existent at all, in his article “Challenging the Myth: A Review of the Links Among College Athletic Success, Student Quality and Donations” excerpted in this chapter. Pope and Pope examine the impact of success in major college football and men’s basketball on the number and quality of applications for admission to the institution. Stinson and Howard then review the impact of athletic success on fundraising at both the institution generally and in the athletic department more specifically.
The economics of college sports—both direct and indirect, actual and theoretical—often results in institutions making strategic decisions to change either their goals or the breadth and depth of their athletic programs. These decisions have broad consequences. The addition or subtraction of a team from an institution’s athletic offerings is usually spurred by programmatic, gender equity, and/or financial considerations. In the past decade, a number of institutions in pursuit of increased media attention and the big-money potential of college sports have upgraded their athletic departments to a higher NCAA division. Membership in NCAA Division I grew from 261 in 1980 to 330 in 2008–2009. The NCAA put a four-year moratorium in effect in 2007 on permitting institutions to join Division I or upgrade within Division I until 2011, though it did allow the 20 schools that were already in the process of upgrading their programs to proceed. Although there are some success stories, upgrading is typically a foolish endeavor; most schools are unprepared for the move and fail to be rewarded for it either financially or indirectly. The NCAA’s longitudinal study on the impact of upgrading the athletic program on the institution provides the details.
Many athletic departments have found that it is more efficient for them to outsource their marketing and other business operations to one of a handful of third-party providers that specialize in handling these affairs. The excerpt from Burden and Li examines the outsourcing of intercollegiate athletics programs.
As per the Internal Revenue Code, universities are nonprofit entities that are generally tax-exempt. As a consequence, the revenues that university athletic departments receive are not taxed either, despite the profit-motive of Division I members. An important consequence of this favorable tax treatment is that institutions that build or renovate athletic facilities are usually eligible for tax-exempt bonds to help fund these projects, and the lower interest rate allows them to maintain substantially lower debt service than if they were otherwise ineligible for this treatment.
Table 2 Summary of Revenues and Expenses (By Gender), Football Bowl Subdivision, 2006 Generated Revenues
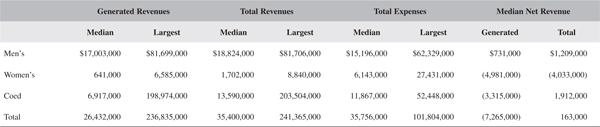
Source: Daniel Fulks, 2004–2006 NCAA Revenues and Expenses of Division I Intercollegiate Athletic Programs Report (2008). © National Collegiate Athletic Association. 2008–2010. All rights reserved.
Notes: Generated revenues are produced by the athletics department and include ticket sales, radio and television receipts, alumni contributions, guarantees, and other revenue sources that are not dependent on entities outside the athletics department.
Total revenues, or allocated revenues, are composed of:
• Student fees directly allocated to athletics;
• Direct institutional support, which are financial transfers directly from the general fund to athletics;
• Indirect institutional support, such as the payment of utilities, maintenance, support salaries, etc. by the institution on behalf of athletics; and
• Direct governmental support—the receipt of funds from state and local governmental agencies that are designated for athletics
Table 3 Sources of Revenues, Division I Football Bowl Subdivision, Football Championship Subdivision, Division I (Without Football), 2006
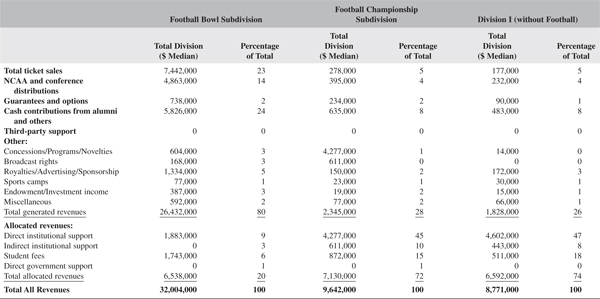
Source: Daniel Fulks, 2004–2006 NCAA Revenues and Expenses of Division I Intercollegiate Athletic Programs Report (2008).
Notes: Generated revenues represent revenues earned by the athletics department and do not include allocated revenues. Allocated revenues include direct institutional support, indirect support, student fees, and governmental support.
Percentages are based on averages for entire subdivision.
Because of zero values reported by respondents, median values can be misleading.
Table 4 Operating Expenses by Object of Expenditure, Division I Football Bowl Subdivision, Football Championship Subdivision, Division I (without Football), 2006 Mean Values*
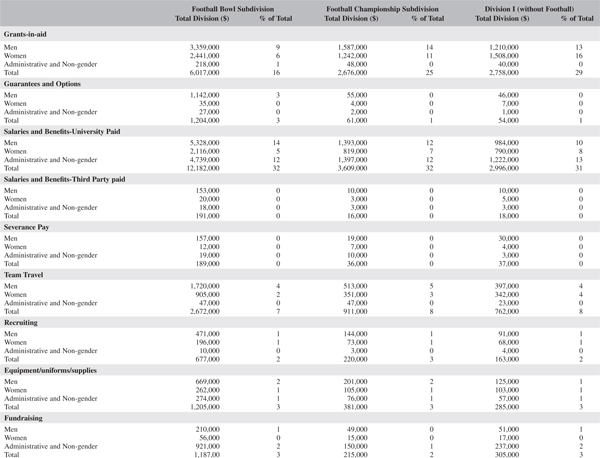
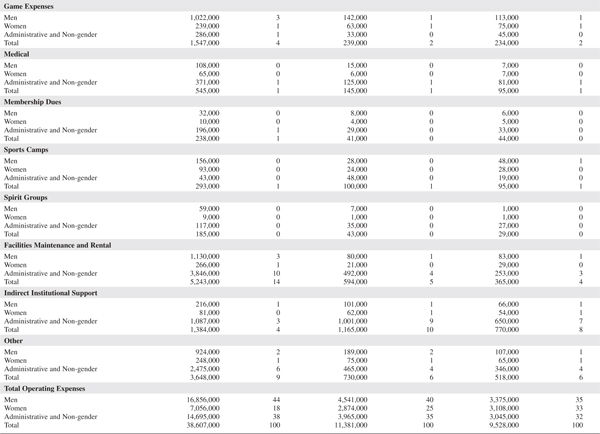
*Because of zero values reported by respondents, median values can be misleading. Consequently, mean values are provided in this table.
Source: Daniel Fulks, 2004–2006 NCAA Revenues and Expenses of Division I Intercollegiate Athletic Programs Report (2008).
Table 5 Naming-Rights Deals at NCAA Facilities (Listed by Total Value)
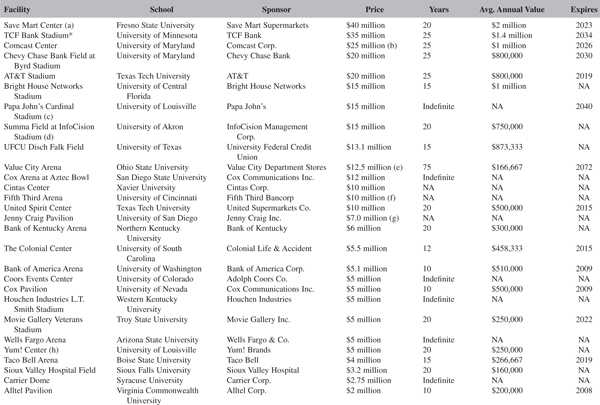
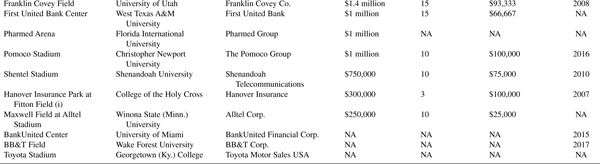
NA: Not applicable or not available
*Under construction or in late stages of development.
(a) PepsiCo acquired naming rights to the venue as part of a 23-year, $40 million sponsorship - the first three years of which came while the arena was under construction – but passed the rights to Modesto, California-based Save Mart Supermarkets while retaining campuswide pouring rights. Save Mart declined to disclose its contribution for the naming-rights portion of the deal.
(b) To be paid over 10 years; additional cost of $5 million included for logo rights to the basketball floor by Comcast.
(c) In August 2007, a $10 million pledge toward Papa John’s Cardinal Stadium expansion from Papa John’s International and its founder, John Schnatter, extended the previous deal worth $5 million.
(d) Field title sponsorship by Summa Health System worth $5 million over 20 years.
(e) Value City Arena was part of the naming-rights deal for the Jerome Schottenstein Center.
(f) Fifth Third’s naming rights to the university was part of a $10 million gift to the university that includes areas other than sports.
(g) Part of an overall $10 million gift to the university.
(h) The Yum! Center is the training facility for the University of Louisville.
(i) The stadium is owned by College of the Holy Cross and serves as home to that school’s baseball team. However, the Worcester Tornadoes brokered and receive all revenue from the naming-rights deal, and Holy Cross refers to the facility as Fitton Field.
Source:Research by David Broughton, Street & Smith’s SportsBusiness Journal. Used with permission.
This not-for-profit status is quite favorable for alumni and boosters making contributions to the athletic department because their donations are fully tax-deductible. When the donation is a prerequisite to the purchase of season tickets or luxury seating, it is still 80% tax-deductible. This makes donating to colleges and universities an even more attractive option for alumni and boosters, and allows athletic departments to generate substantial amounts of revenues from fundraising. The median member of Division I-A brought in $5.8 million in cash donations in 2006, while the median Division I-AA and I-AAA institutions collected $635,000 and $483,000, respectively. Collectively, the members of Division I-A received nearly $845 million in tax-free donations in 2005, most of which was tax-deductible for the donors.1 As this represents forsaken taxable income, it is fair to conclude that the federal government lost hundreds of millions in uncollected taxes—and thus implicitly subsidizes the college sports industry. The tax issues surrounding college athletics are further discussed in the Congressional Budget Office’s report on the topic.
Notes
1. Myles Brand, Letter to William Thomas, Chairman, U.S. House of Representatives Committee on Ways and Means, Nov. 13, 2006, available at http://www.ncaa.org/wps/wcm/connect/2fa84c004e0d90aea0caf01ad6fc8b25/20061115_response_to_housecommitteeonwaysandmeans.pdf?MOD=AJPERES&CACHEID=2fa84c004e0d90aea0caf01ad6fc8b25.
OVERVIEW OF INSTITUTIONAL IMPACT
INTERCOLLEGIATE ATHLETICS AND THE AMERICAN UNIVERSITY: A UNIVERSITY PRESIDENT’S PERSPECTIVE
James J. Duderstadt
The sports media fuel the belief that money is the root of all evil in college athletics. And, indeed, the size of the broadcasting contracts for college football and basketball events, the compensation of celebrity coaches, and the professional contracts dangled in front of star athletes make it clear that money does govern many aspects of intercollegiate athletics.
For example, Michigan, along with many other universities with big-time athletics, claims that football is a major money-maker. In fact, Michigan boasted that it made a profit of $14 million from its football program in 1997, the year it won the national championship…. Yet at the same time, most athletic departments plead poverty when confronted with demands that they increase varsity opportunities for women or financial aid for student-athletes. In fact, many athletic departments in Division I-A will actually admit that when all the revenues and expenses are totaled up, they actually lose money.
What is going on here? Could it be that those reporting about the economics of college sports have difficulty understanding the Byzantine financial statements of athletic departments? Are accounting tricks used to hide the true costs of intercollegiate athletics? Or perhaps those who lead and manage college sports have limited understanding of how financial management and business accounting works in the first place?
It is probably all of the above, combined with the many other myths about the financing of college sports, which confuse not only outsiders such as the press and the public, but even those insiders such as the university administration, athletic directors, and coaches. Before we dive into a discussion of how college athletics are financed these days, I want to straighten out several of the more common misperceptions.
STRIPPING AWAY THE MYTHS
First, most members of the public, the sports press, and even many faculty members believe that colleges make lots of money from sports. In reality, essentially all of the revenue generated by sports is used by athletic departments to finance their own operations. Indeed, very few intercollegiate athletics programs manage to balance their operating budgets. The revenue from gate receipts, broadcasting rights, postseason play, licensing, and other commercial ventures is rarely sufficient to cover the full costs of the programs. Most universities rely on additional subsidies from student fees, booster donations, or even state appropriations. Beyond that, college sports benefit from a tax-exempt status on operations and donations that represents a very considerable public subsidy.
The University of Michigan provides an interesting case study of the financing of intercollegiate athletics, since it is one of only a handful of institutions that usually manages to generate sufficient revenue to support the cost of operations (although not the full capital costs) for its intercollegiate athletics programs. Even for Michigan, financing intercollegiate athletics remains an ongoing challenge. For example, during the 1988–89 fiscal year, my first year as president, the University of Michigan won the Big Ten football championship, the Rose Bowl, and the NCAA basketball championship. The university also appeared in seven national football telecasts and dozens of basketball telecasts, played in a football stadium averaging 105,000 spectators a game, and sold out most of its basketball and hockey events. Yet it barely managed to break even that year, with a net profit on operations of about $1 million on $35 million of revenue….
When I was provost, football coach Bo Schembechler once complained to me about the enormous pressures to keep Michigan Stadium filled. He pointed to the losses that we would face if stadium attendance dropped 10 percent. I responded that, while this loss would be significant, it paled in comparison to the loss we would experience with a 10 percent drop in bed occupancy in the University of Michigan hospitals, which have an income more than twenty times larger than that of Michigan football…. Even football revenue has to be placed in perspective.
The University of Michigan, as one of the nation’s most successful athletics programs, generates one of the highest levels of gross revenue in intercollegiate athletics. Despite this fact, in some years, the expenditures of our athletic department actually exceed revenues…. This paradox is due, in part, to the unique “business culture” of intercollegiate athletics. The competitive nature of intercollegiate athletics leads most athletic departments to focus far more attention on generating revenue than on managing costs. There is a widespread belief in college sports that the team that spends the most wins the most, and that no expenses are unreasonable if they might enhance the success of a program. A fancy press box in the stadium? First-class travel and accommodations for the team? A million-dollar contract for the coach? Sure, if it will help us win! Furthermore, the financing of intercollegiate athletics is also complicated by the fact that while costs such as staff salaries, student-athlete financial aid, and facilities maintenance are usually fixed, revenues are highly variable. In fact, in a given year, only television revenue for regular events is predictable. All other revenue streams, such as gate receipts, bowl or NCAA tournament income, licensing revenue, and private gifts, are highly variable. While some revenues such as gate receipts can be accurately predicted, particularly when season tickets sales are significant, others such as licensing and private giving are quite volatile. Yet many athletic departments (including Michigan, of late) build these speculative revenues into annual budgets that sometimes crash and burn in serious deficits when these revenues fail to materialize.
Needless to say, this business philosophy would rapidly lead to bankruptcy in the corporate world. It has become increasingly clear that until athletic departments begin to operate with as much of an eye on expenditures as revenues, universities will continue to lose increasing amounts of money in their athletic activities, no matter how lucrative the television or licensing contracts they may negotiate.
Well, even if athletic departments essentially spend every dollar they generate, don’t winning programs motivate alumni to make contributions to the university? To be sure, some alumni are certainly motivated to give money to the university while (and, perhaps, only when) basking in the glow of winning athletic programs. But, many of these loyal alumni and friends give only to athletic programs and not to the university more generally. And the amounts they give are relatively modest….
University fundraising staff have known for many years that the most valuable support of a university generally comes from alumni and friends who identify with the academic programs of the university, not its athletic prowess. In fact, many of the university’s most generous donors care little about its athletic success and are sometimes alienated by the attention given to winning athletics programs.
The staggering sums involved in television contracts, such as the $6 billion contract with CBS for televising the NCAA tournament, suggest that television revenue is the goose that lays the golden eggs for intercollegiate athletics. But for most institutions, ticket sales are still the primary source of revenue. Indeed, there is some evidence that television can have a negative impact on the overall revenues of many athletic programs by overexposing athletic events and eroding gate receipts. Lower game attendance brought on by television has been particularly harmful to those institutions and conferences whose sports programs are not broadcast as primetime or national events, since many of their fans stay home from university events in order to watch televised events involving major athletic powers.
The additional costs required to mount “TV quality” events tend to track increasing revenue in such a way that the more one is televised, the more one must spend. More and more institutions are beginning to realize that there is little financial incentive for excessive television coverage. While exposure can convey the good news of successful athletic programs and promote the university’s visibility, it can also convey “bad news,” particularly if there is a major scandal or a mishap with an event.
If the financial and publicity impact of television is not necessarily positive, why is there then such a mad rush on the part of athletics programs for more and more television exposure? Speaking from the perspective of one of the most heavily televised universities in the country, my suspicion is that the pressure for such excessive television coverage is not coming from the most successful and most heavily televised institutions—the Michigans, Ohio States, and UCLAs. It is, instead, coming from the “have-not” institutions, those who have chosen not to mount competitive programs but who have become heavily dependent on sharing the television revenue generated by the big box office events through conference or NCAA agreements.
Stated more bluntly, the television revenue-sharing policies of many conferences or broader associations, such as the NCAA, while implemented with the aim of achieving equity, are failing. They are, in reality, having the perverse effect of providing strong incentives for those institutions that are not attractive television draws to drive the system toward excessive commercialization or exposure of popular events. While the have-not universities share in the revenues, these institutions do not bear the financial burden or disruption of providing television-quality events. In a sense, the revenue-sharing system does not allow for negative feedback that might lead to more moderate approaches to television broadcasting.
What about the suggestion that student-athletes deserve some share of the spoils? The argument usually runs as follows: College sports is golden—witness, for example, the $550 million paid each year by CBS for the NCAA tournament or the … payout per team for the football Bowl Championship Series games. And yet the athletes do not even get pocket money…. And what about college coaches, some of whom make over a million dollars a year? Shouldn’t we pay the athletes who generate all this money? Late in his long tenure as executive director of the NCAA, Walter Byers argued that since colleges were exploiting the talents of their student-athletes, they deserved the same access to the free market as coaches. He suggested letting them endorse products, with the resulting income going into a trust fund that would become available only after they graduated or completed their eligibility.2
These myths are firmly entrenched not only in the public’s mind but in the culture of the university. We need now to separate out the reality from the myth, to better understand the real nature of the financial issues facing college sports.
Reality 1: What Do Universities Really Make from Athletics?
As we noted earlier, in 1997, the University of Michigan generated $45 million from its athletics activities, of which only about $3 million came from television. Although the university actually generated far more than this from the broadcasting of events such as football and basketball games, the Rose Bowl, and the Big Ten and NCAA basketball tournaments, most of this revenue was shared with the other Big Ten and NCAA schools. How much of this revenue can we attribute to the efforts of students? This is hard to estimate. On the one hand, we might simply divide the entire revenue base by the number of varsity athletes (seven hundred) to arrive at about $45,000 per athlete. But, of course, coaches and staff also are responsible for generating revenue, by building winning sports programs or marketing or licensing sports apparel. Certain unusual assets, like Michigan Stadium, attract sizable crowds and generate significant revenue regardless of how successful the team is. Finally, we have not said anything yet about expenses. Operating expenditures at Michigan, as at every other university in the nation, are sometimes larger than revenues. As a result, the net revenues, the profit, is zero! While it is admittedly very difficult to estimate just how much income student-athletes bring to the university, it is clear that it is far less than most sportswriters believe.
Reality 2: What Do the Players Receive from the University?
At Michigan the typical instructional cost (not “price” or tuition) of our undergraduate programs is about $20,000 per student per year. When we add to this support for room and board and incidentals, it amounts to an investment of about $30,000 per year per fully tendered student-athlete, or between $120,000 to $150,000 per athlete over four or five years of studies. The actual value of this education is far higher, since it provides the student-athlete with an earning capacity far beyond that of a high school education (and even far beyond that of most professional sports careers, with the exception of only the greatest superstars). Of course, only a few student-athletes will ever achieve high-paying careers in professional sports. Most do not make the pros, and most of those who do are only modestly compensated for a few short years.
The real reward for student-athletes is, of course, a college education. Despite having somewhat poorer high school records, test scores, and preparation for college, athletes tended to graduate at rates quite comparable to those of other students. The reasons for their academic success involved both their strong financial support through scholarships and their academic support and encouragement through programs not available to students at large. Yet it is also the case that recruiting college athletes based entirely on physical skills rather than academic promise undermines this premise. As William Dowling, professor at Rutgers, has noted, “Problems will remain as long as players in the so-called revenue sports represent a bogus category of students, recruited on the basis of physical skills rather than for academic or intellectual ability.”4
Those who call for professionalizing college athletics by paying student-athletes—and they are generally members of the sports media—are approaching college sports as show business, not as part of an academic enterprise. Only in show business do the stars make such grossly distorted amounts. In academics, the Nobel Prize winner does not make much more than any other faculty member. In the corporate world, the inventor of a device that earns a corporation millions of dollars will receive only a small incentive payment for her or his discovery. The moral of the story is that one simply cannot apply the perverse reward system of the entertainment industry to college sports—unless, of course, you believe college sports is, in reality, simply another form of show business.
A PRIMER ON COLLEGE SPORTS FINANCING
Most business executives would find the financial culture of intercollegiate athletics bizarre indeed. To be sure, there are considerable opportunities for revenue from college sports…. In terms of their revenue-generating capacity, three college football teams, Michigan, Notre Dame, and Florida, are more valuable than most professional football franchises.5 Such statistics have lured college after college into big-time athletics, motivating them to make the investment in stadiums, coaching staffs, [and] scholarships, to join the big boys in NCAA’s Division I-A.
Yet most intercollegiate athletics programs at most colleges and universities require some subsidy from general university resources such as tuition or state appropriation. Put another way, most college athletics programs actually lose money…. And, while football coaches might like to suggest that the costs of “nonrevenue” sports are the problem, particularly those women’s sports programs mandated by Title IX, before blaming others, they should first look in a mirror. While football generates most of the revenue for intercollegiate athletics, it also is responsible for most of the growth in costs. More precisely, when college sports is transformed into an entertainment industry, and when its already intensely competitive ethos begins to equate expenditure with winning, one inevitably winds up with a culture that attempts to spend every dollar that it is generated, and then some.
Stated another way, the costs of intercollegiate athletics within a given institution are driven by decisions concerning the level of competition (e.g., NCAA Division, regional, or nationally competitive), the desire for competitive success, and the breadth of programs. Although football generates most of the revenue for big time athletic programs through gate receipts and broadcasting, it is also an extremely expensive sport. Not only does it involve an unusually large number of participants and attendant coaching and support staff, but the capital facilities costs of football stadiums, practice facilities, and training facilities are very high. Furthermore, many of the remaining costs of the athletic department, such as marketing staff, media relations, and business are driven, in reality, primarily by the needs of the football program rather than the other varsity sports. In this sense, football coaches to the contrary, big-time football programs are, in reality, cost drivers rather than revenue centers.
It is instructive to take a more detailed look at the various revenue streams and costs associated with intercollegiate athletics in order to get a sense of scale. The following are the principal sources of revenues and expenditures:
Revenues
• Ticket sales
• Guarantees
• Payouts from bowl games and tournaments
• Television
• Corporate sponsorships, advertising, licensing
• Unearned revenues
• Booster club donations
• Student fees and assessments
• State or other government support
• Hidden university subsidies
Expenditures
• Salaries
• Athletic scholarships
• Travel and recruiting
• Equipment, supplies, medicine
• Insurance
• Legal, public relations, administrative
• Capital expenditures (debt service and maintenance)
Furthermore, intercollegiate athletics is highly capital intensive, particularly at a big-time program such as Michigan. Few athletics programs amortize these capital costs in a realistic fashion. Including these imbedded capital costs on the balance sheet would quickly push even the most successful programs far into the red.
To illustrate, let us walk through the budget of the University of Michigan Department of Intercollegiate Athletics. First let me note that it is the practice of the university that intercollegiate athletics be a self-supporting enterprise, not consuming university resources. It receives neither state appropriation nor student tuition. Furthermore, this financial firewall works in both directions: any revenue balance earned by the athletic department cannot, under normal circumstances, be transferred to the academic side of the university. They must pay for what they cost the university, and they keep what they make….
Not included in these figures were onetime expenditures of roughly $18 million to expand Michigan Stadium, to decorate it with a gaudy maize-and-blue halo designed by the noted architect Robert Venturi, complete with the ten-foot-high words to the Michigan fight song, “Hail to the Conquering Heroes”; to install $8 million worth of “Jumbo-tron” television scoreboards; and to build a sophisticated control room for Internet broadcasts. These onetime expenses were charged against (and largely decimated) the flexible reserve funds of the department. Lest you think these latter expenses were unusually extravagant, Ohio State is in the midst of several construction projects that will leave their athletic department saddled with a $277 million debt, to be paid over the next thirty years. (And you wonder why people believe that the financial culture of intercollegiate athletics is wacko?)
As I noted earlier, the financial strategy in intercollegiate athletics is strongly driven by competitive pressures. The belief that those who spend the most win the most drives institutions to generate and spend more and more dollars. The prosperous programs at institutions such as Michigan, Penn State, and Notre Dame set the pace for the entire intercollegiate athletics enterprise, no matter what the size of the school. As expenditures on athletics programs continue to spiral out of control, there have been increasing calls for action at both the national and conference level. Yet part of the problem is that many athletic departments hide the true nature of the financial operations not only from the prying eyes of the press and the public, but even from their own universities. Several years ago, the Big Ten Conference launched an effort to contain costs by restricting the growth of institutional expenditures on athletics to the rate of inflation. At that time, many universities were suffering as their athletics revenues were insufficient to cover costs. There were also concerns about competitiveness, since the wealthier schools tended to dominate most Big Ten sports, particularly football.
More specifically, Michigan and Ohio State, because of their very large stadiums, had considerably more gate receipt revenue than the other Big Ten members. Onetime football powers such as Wisconsin and Minnesota had fallen on hard times, with mediocre teams and low stadium attendance. Minnesota was in a particularly difficult bind since it had shifted its football games to the downtown Minneapolis Metrodome and torn down its on-campus stadium. Earlier attempts to address this discrepancy among institutions through revenue-sharing formulas had finally become burdensome enough to the larger stadium schools, particularly with the entry of Penn State that the conference agreed to accept a more equitable formula.
Therefore, attempts to control expenditures rather than to redistribute revenues became the focus. But there was a big problem here. Nobody really knew how much the athletic departments in each university were spending. On top of that, no one seemed to know how much or where the revenue came from. And because most athletics programs were independent of the usual financial management and controls of their institutions, it was clear that this comparative information would be difficult if not impossible to obtain through the departments themselves.
Member institutions decided to form a special subcommittee to the Big Ten Council of Presidents comprised of the universities’ chief financial officers. This CFO committee was charged with developing a system to obtain and compare annual athletics revenues and expenditures within the Big Ten. Needless to say, this decision to go outside of the athletic enterprise for supervision did not go down well in some schools where the athletic department had unusual autonomy. And while opening their books for examination was not particularly troublesome to most Big Ten universities, since as public institutions they frequently had to endure audits from state government, this was a very sensitive matter to the one private university in the Big Ten, Northwestern.
The first set of comparisons across all universities was eye opening.8 Among the factors of particular note was the distribution of revenues.
Ticket sales | 38 percent |
Television and radio | 13 |
Gift income | 13 |
Subsidies | 11 |
Licensing, concessions, etc. | 9 |
Game settlements, guarantees | 8 |
Bowls and NCAA revenue | 4 |
Miscellaneous | 4 |
Although broadcasting and bowl revenues were important—and are becoming more so—the largest single revenue source (38 percent) remained gate receipts. This explains why the three universities with very large stadiums (Michigan at 105,000, Ohio State at 98,000, and Penn State at 96,000) stand out in revenues. Among the public universities, there was great disparity in the capacity to generate private support for athletics (with Michigan ranking, surprisingly enough, toward the bottom of the range) and in their subsidies from state support.
The financial studies revealed that 72 percent of total athletic department revenue is attributable to football. Another 23 percent comes from men’s basketball. In other words, 95 percent is generated by football and basketball combined. (Ice hockey contributes 4 percent and women’s basketball 1 percent.) A further breakdown of revenue sources shows the difference between men’s and women’s sports.
Men’s sports | 71.1 percent |
Women’s sports | 4.3 |
Administrative operations | 24.6 |
In terms of expenditures, 57 percent was spent on football and men’s basketball, while 24 percent was spent on women’s sports, and 14 percent on all other men’s sports. Despite the Big Ten Conference’s efforts to achieve gender equity, women’s programs amounted to only one-quarter of expenditures in the 1990s. Financial aid was distributed 67 percent to men, 33 percent to women, roughly in proportion to their representation among varsity athletes.
Two universities stood out in terms of the breadth and comprehensiveness of their programs: Ohio State, with thirty-five programs, and Penn State with thirty. Michigan’s twenty-three programs were only in the middle of the pack, despite the fact that Michigan ranked number one in revenues….
There was a factor-of-two difference in athletic department revenues and expenditures, ranging from Michigan and Ohio State … to Northwestern and Purdue…. The analysis also quickly made apparent why Northwestern had been so reluctant to share its financial data. In sharp contrast to the public universities, Northwestern was subsidizing its athletics programs from general academic resources to the tune of about $8 million per year (almost half their revenues). Although today, after two Big Ten football championships, faculty and students might believe it was worth the roughly eight hundred dollars per student of tuition (or other academic income) it cost to remain in the Big Ten, at the time of the first CFO surveys, this was highly sensitive information. While Northwestern’s hidden subsidy was the largest among Big Ten universities, it was certainly not unique. Some institutions provided hidden subsidies by waiving tuition or granting instate tuition rates for student athletes. Others received direct subsidies for their athletics programs through state appropriations (e.g., Wisconsin received $634,000 per year).
There were a number of other significant differences among the expenditure patterns of the various universities. For example, several of the public universities charged only in-state tuition to athletes, even if they were out-of-state residents, thereby reducing very significantly their costs for athletic scholarships. In contrast, Michigan charged full out-of-state tuition levels, which were comparable to those of private institutions, thereby driving up the costs of athletic grants-in-aid programs considerably. Labor costs also varied widely among institutions, ranging from urban and unionized wage scales to rural and nonunionized wage scales.
It was finally concluded, after several years of effort, that the great diversity among institutions in terms of the manner in which revenue was generated, expenditures were managed, and accounting was performed made it almost impossible to attempt conference-wide cost containment. Hence, the Big Ten presidents adopted a policy encouraging rather than requiring cost containment. However, they also decided to continue the annual CFO comparative analysis of revenues and expenditures, if only to provide visibility for unusual practices.
SHOW ME THE MONEY!
Revenue flows into athletics departments from a number of sources and out again through a complex array of expenditures…. In this brief discussion, I will focus only on a few items of particular interest.
One of the most expensive elements of sports is the current grants-in-aid system for the financial support of student-athletes. In contrast to the need-based financial aid programs for regular students, colleges are allowed to provide student-athletes with sufficient support to meet “all commonly accepted educational expenses”—a full ride, regardless of financial need or academic ability. This policy, first implemented in football in the 1950s, has spread rapidly to all varsity sports. As the costs of a college education have rapidly increased over the past two decades, the costs of grants-in-aid have risen dramatically…. But there is considerable variation among institutions ….
In some cases, this discrepancy is due to institutions that choose to subsidize financial aid by granting all athletes in-state tuition levels, in effect hiding the subsidy of the difference between in-state and out-of-state levels. Although some universities restrict the number or types of grants-inaid they provide in various sports, the University of Michigan has long had a policy of fully funding all allowable grants-in-aid in all sports in which it competes. Since most student-athletes are subject to out-of-state tuition levels, the resulting cost of athletically related student aid is unusually high ….
A second factor in the inflating costs was the rapid growth in size of football programs as coaches pushed through the unlimited-substitution rules in the 1960s. This system allowed college football to develop specialists for essentially every position and every situation in the game—offense and defense, blocking and tackling, kicking and passing. Although it was promoted as a way to make the game more exciting, it was not just a coincidence that it also made football far easier to play and to coach. More significantly, it transformed college football into a corporate and bureaucratic enterprise, with teams of over one hundred players, dozens of coaches, trainers, and equipment managers, and even technology experts in areas such as video production and computer analysis. Furthermore, unlimited substitution not only transformed college football into the professional football paradigm, but it also demanded that high school football follow the colleges and the pros down the same expensive path.
The third factor driving the rapid expansion of the program’s cost and complexity has been the insatiable desire of football coaches for any additional gimmicks that might provide a competitive edge, either in play or competition. Special residences for football players became common, some resembling country clubs more than campus dormitories. Many football programs have built not only special training facilities but also even museums to display their winning traditions to prospective recruits…. Teams usually travel in high style, with charter jet service, four-star hotels, and even special travel clothing such as team blazers. And, of course, each time a coach at one university dreams up a new wrinkle, all of the other coaches at competing universities have to have it, no matter how extravagant or expensive.
This competitive pressure from coaches and fans—and even the media—has made it very difficult for athletic departments to control costs. Each time actions are proposed to slow the escalation of costs in the two main revenue sports, football and basketball, they are countered with the argument that the more one spends, the more one will win and hence the more one will make. The relative financial inexperience of those who manage athletic departments makes it even more difficult to resist these competitive forces. They tend to develop a one-dimensional financial culture, in which all attention is focused on revenue generation, and cost controls are essentially ignored.
A conversation with any athletic director soon reveals just how much of their attention is devoted to generating revenue to cover ever-increasing costs. This preoccupation with revenue generation propagates up through the hierarchy, to university presidents and governing boards, athletic conferences, and even the NCAA. Far more time is spent on negotiating broadcasting contracts or licensing agreements than on cost containment, much less concern about the welfare of student-athletes or the proper role of college sports in a university.
Though most of the revenue for college sports has traditionally come from revenue associated with football and basketball events, several of the most popular programs have generated very extensive licensing income from the use of institutional logos and insignia. A number of major athletics programs, Michigan among them, have signed lucrative contracts with sports apparel companies. Many athletic departments have also launched extensive fundraising efforts involving alumni and fans, both for ongoing support and endowment. In fact, both athletic scholarship programs and key athletic department staff such as athletic directors and football coaches are supported by endowments in some universities.
Athletic departments go to great lengths and considerable creativity to find new sources of revenues. For example, when Michigan decided to replace its artificial turf in Michigan Stadium with natural turf in 1992, the athletic department got the bright idea that people might want to purchase a piece of the old carpet for nostalgic reasons. They chopped up the old artificial turf into an array of souvenirs, ranging from coasters to doormats to large rugs containing some of the lettering on the field. To their delight, these sold like hot-cakes, and the department made over two hundred thousand dollars….
Another example is the construction of an elegant new plaza and fence surrounding Michigan Stadium in 1995. The athletic department decided to sell paving bricks at a premium (one hundred to one thousand dollars apiece) and allow people to inscribe their names and perhaps even a brief message. Again, demand soared for the opportunity to become “a part of Michigan Stadium,” and the department rapidly raised the several hundred thousand dollars required for the project.
Licensing provides a more standard means for generating revenue for the athletic department. Michigan moved early into a more direct merchandising effort, placing retail shops (the M-Go Blue Shops) in various athletics venues, so that it could participate directly in the profits from athletic or signature apparel. It was always a fascinating experience to browse through these shops to see what the fertile creativity of the marketing side of the athletic department had devised or approved for licensing: maize-and-blue toilet seats that play “The Victors” when raised, the Michigan football helmet chip-and-dip bowl, and hundreds upon hundreds of different sweatshirt designs. The catalog mail-order business became particularly lucrative.
….
We have noted earlier the extreme volatility of most revenue sources for intercollegiate athletics. While a New Year’s Day bowl appearance or success in the NCAA Basketball Tournament can provide a windfall, a poor season can trigger rapid declines in gate receipts, licensing income, and private gifts. Catastrophe awaits the naive athletic director who builds an expenditure budget based on such speculative income, since disaster awaits when the books are finally closed at year end. During my tenure as president, we not only required the athletic department to budget very conservatively, but it also was encouraged to build a reserve fund with sufficient investment income to compensate for any uncertainty in the operating budget. In fact, our athletic director generally measured financial performance in terms of the growth of the reserve fund from year to year.
FINANCIAL ACCOUNTABILITY
The athletic department at most NCAA Division I-A universities is treated as an auxiliary activity, separated by a financial firewall from the budgets of academic programs. This strategy allows athletic directors to offer up the excuse that the sometimes flamboyant expenditures of the department are not being made at the expense of the university. But it also creates major problems. It tends to focus most of the athletic department’s energy (not to mention the conference’s and NCAA’s) on revenue generation rather than cost management. It subjects coaches and staff to extreme pressures to generate additional revenue in the mistaken belief that it will enhance the competitiveness of their programs. And, perhaps most significantly, it further widens the gap between the athletic department and the rest of the university.
Despite the boasts of athletic directors and football coaches to the contrary, intercollegiate athletics at most institutions—perhaps all institutions, if rigorous accounting principles were applied—is a net financial loser. All revenues go simply to support and in some cases expand the athletic empire, while many expenditures that amount to university subsidy are hidden by sloppy management or intricate accounting. Put more pointedly, college sports, including the celebrity compensation of coaches, the extravagant facilities, first-class travel and accommodations, VIP entertainment of the sports media, shoddy and wasteful management practices, all require subsidy by the university through devices such as student fees, hidden administrative overhead support, and student tuition waivers.
Yet our athletic departments not only tout their self-supporting status, but they vigorously seek and defend their administrative and financial independence. And well they should, since their primary activity is, increasingly, operating a commercial entertainment business. As college football and basketball become ever more commercial and professional, their claim on any subsidy from the university is diminished.
Of course, few of our sports problems are self-supporting. If we illuminate hidden costs and subsidies, we find that all intercollegiate athletics burden the university with considerable costs, some financial, some in terms of the attention required of university leadership, some in terms of the impact to the reputation and integrity of the university, and some measured only in the impact on students and staff. Experience has also shown that expenses always increase somewhat more rapidly than the revenues generated by college sports.
In conclusion, the mad race for fame and profits through intercollegiate athletics is clearly a fool’s quest. Recognition on the athletic field or court has little relevance to academic reputation. Nebraska can win all the national championships it wishes, and it will never catch fair Harvard’s eye. Indeed, fame in athletics is often paradoxical, since it can attract public scrutiny, which can then uncover violations and scandal. As the intensity and visibility of big-time athletics build, the university finds itself buffeted by the passion and energy of the media and the public, who identify with their athletics programs rather than their educational mission.
Yet every year, several more universities proudly proclaim they have decided to invest the resources to build sports programs that will earn them membership in NCAA’s Division I-A. Sometimes lessons are never learned.
Notes
….
2. Walter Byers with Charles Hammer, Unsportsmanlike Conduct: Exploiting College Athletes. Ann Arbor: University of Michigan Press, 1995.
….
4. William Dowling, “To Cleanse Colleges of Sports Corruption, End Recruiting Based on Physical Skills,” Chronicle of Higher Education, July 9, 1999, B9.
5. Richard Sheehan, Keeping Score: The Economics of Big-Time Sports, New York: Diamond Communications, 1996, chaps. 11, 12.
….
8. Athletic Operations Survey, 1993–94, Big Ten Conference, Chicago, 1994.
UNIVERSITY OF MICHIGAN DEPARTMENT OF ATHLETICS OPERATING BUDGETS, 2009–2010
For the proposed FY 2010 Operating Budget (described in detail on the following pages), we project an operating surplus of $8.8 million based on operating revenues of $94.4 million and operating expenses of $85.6 million. The budgeted surplus will be added to our operating reserves. [Ed. Note: See Table 6.] Highlights are as follows:
• The budget reflects an eight-game home schedule for football (seven home games were played last year).
• Budgeted sponsorship revenue (including radio rights) has increased to $13.7 million from $8 million in FY 08. Sponsorship revenue includes the IMG and Adidas agreements, both of which became effective in FY 2009.
• Included in operating expenses is a $4.5 million transfer to a deferred maintenance fund established in FY 2003. The deferred maintenance fund is used as a means to provide for major repair and rehabilitation projects for our athletic facilities. We expect to continue to set aside additional funds in future years for this purpose.
• The budget reflects operating expenditure increases of 4.8% over projected operating expenses in FY 2009, principally due to compensation, financial aid, team travel, and home game expense increases.
We are also pleased to report that based on preliminary results, we project that the operating surplus for FY 09 will be $10.2 million, approximately the same as budgeted. The accumulation of operating surpluses will be used to fund our ongoing capital needs and facility renewal projects in FY 2010 and beyond.
….
UNIVERSITY OF MICHIGAN ATHLETIC DEPARTMENT 2009–2010 BUDGET NOTES AND ASSUMPTIONS (ALL DOLLAR AMOUNTS IN 000’S)
Basis for Accounting
The University of Michigan Athletic Department manages its financial activity through the use of three different funds, the Operating Fund, the Endowment Fund, and the Plant Fund.
The Operating Fund budget is presented herein. (A consolidated financial statement is prepared annually and audited by PricewaterhouseCoopers). The Operating Fund budget includes most of the revenues and expenditures of the Athletic Department, with the exception of Endowment Fund gifts and associated market value adjustments (which are recorded in the Endowment Fund), and investments in the physical plant (with the associated debt, which are recorded in the Plant Fund).
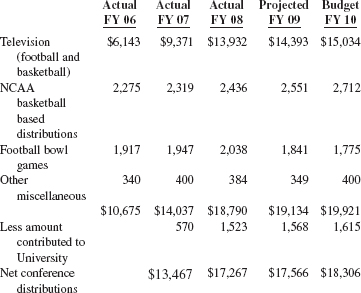
Table 6 Michigan Athletic Department FY 2010 Operating Budget (in thousands)
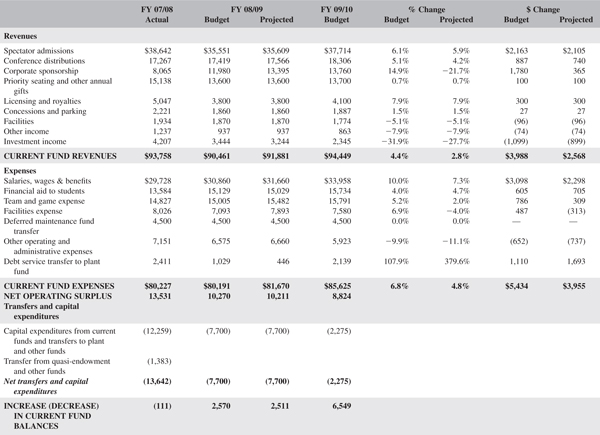
Source: University of Michigan. Athletic Department. Used with permission.
Governmental Accounting Standards Board Statement No. 33 (“GASB 33”) requires that the promises of private donations be recognized as receivables and revenues in the year the pledge was given, provided they are verifiable, measurable, and probable of collection. The Athletic Department Operating Fund budget presented herein records gifts when received (i.e., on a cash basis). The Operating Fund budget presented also reflects 100% of the gifts related to preferred seat donations (“PSD”) as gift income. For financial reporting purposes, 20% of PSD gifts are reflected in spectator admissions.
1. Spectator admissions
Spectator admissions are net of associated guarantee payments to visiting schools and consist of the following:
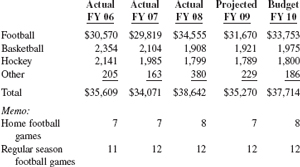
2. Conference distributions
Expected Big 10 conference distributions consist of the following:
3. Facilities
Facility income includes the fee and rental revenue from the University of Michigan Golf Course, the Varsity Tennis Center, Yost Ice Arena, and the various other athletic department facilities.
4. Investment Income
Investment income includes the return from the University Investment Pool (UIP) program as well as the quarterly distribution from Endowment and Quasi-Endowment Funds.
5. Other Income
Other income consists of guarantees received for hockey and basketball away games, ticket handling fees, and other miscellaneous income.
6. Compensation Expense
The athletic department has approximately 245 full time employees including those that have joint appointments with other University units, and various part time employees, interns, and graduate assistants. Compensation expense by area is as follows:
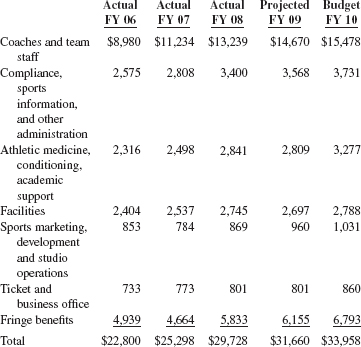
7. Financial aid to students
The athletic department grants the maximum allowable scholarships to all varsity sports. Total grant-in-aid equivalencies are approximately 335 with an estimated in-state to out-of-state ratio of 30%/70%.
Sports program expense is comprised of the following:
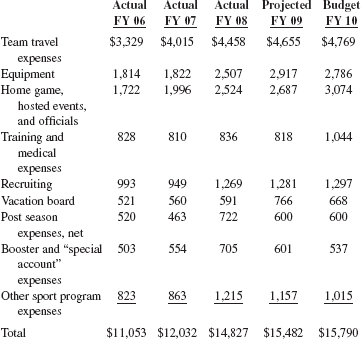
Post season expenses are estimated based on the likelihood of participation in post season events for the majority of varsity sports. The post-season budget assumes that the football bowl expenditures will not exceed the bowl expense allowance received.
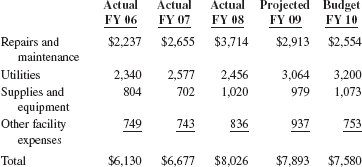
9. Facility Expenses
Facility expenses consist of the following:
10. Deferred Maintenance Fund Transfer
In 2002 the department established a Deferred Maintenance Fund as a means to provide for repair and rehabilitation projects for the athletic physical plant. Transfers from the Operating Fund to the Deferred Maintenance Fund are reflected as operating expenses in this presentation.
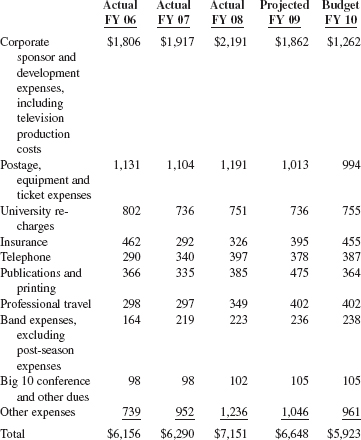
11. Other Operating and Administrative Expenses
Other operating and administrative expenses consist of the following:
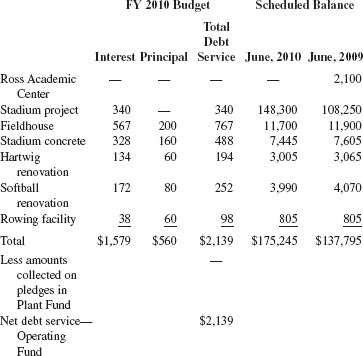
12. Debt Service
Debt service and associated debt is summarized as follows:
13. Transfers to Plant Fund for Capital Expenditures
Capital expenditures and estimated plant fund transfers are budgeted at $2.3 million for fiscal year 2010 and consist of various renovation projects.
FACULTY PERCEPTIONS OF INTERCOLLEGIATE ATHLETICS SURVEY, EXECUTIVE SUMMARY, PREPARED FOR THE KNIGHT COMMISSION’S FACULTY SUMMIT ON INTERCOLLEGIATE ATHLETICS, OCT. 15, 2007
INTRODUCTION
In a national survey of more than 2,000 faculty members at universities with the country’s most visible athletic programs, a striking number of professors say they don’t know about and are disconnected from issues facing college sports. More than a third say they don’t know about many athletics program policies and practices, including the financial underpinnings of their campuses’ athletics programs. Furthermore, more than a third have no opinion about concerns raised by national faculty athletics reform groups. The largest portion of faculty (41 percent) believe faculty governance roles on campus associated with the oversight of intercollegiate athletics are ill defined, and most believe those roles are not particularly meaningful. On other issues, faculty are often equally divided between those who are satisfied with the conduct of their institution’s intercollegiate athletics programs and those who are not.
Faculty members do tend to agree on several key points:
• Athletics decisions on campus are being driven by the demands of the entertainment industry.
• Faculty members are dissatisfied with their roles in athletics governance on campus, although more of them are satisfied with presidential oversight of athletics on their own campuses.
• Salaries paid to head football and basketball coaches are excessive, and the financial needs of athletics get higher priority than academic needs. Still, half of the respondents also think athletics success results in financial gains to campus initiatives unrelated to sports.
• Professors have similar levels of satisfaction with the academic performance of students in general and athletes in sports other than football and basketball. However, they are significantly less satisfied with the academic performance of football and basketball players. They believe athletes are more burdened than other students by demands on their out-of-class time.
• Faculty members are satisfied with the practice of awarding scholarships based on athletics ability, and believe that scholarships for basketball and football athletes may not compensate them fairly for their services.
BACKGROUND
In 1989, the trustees of the John S. and James L. Knight Foundation were concerned that highly visible athletics scandals threatened the integrity of higher education. They formed the Knight Commission on Intercollegiate Athletics to develop and win acceptance of realistic reforms that would close the widening chasm between higher education’s ideals and big-time college sports.
In its 1991 and 2001 reports, the Knight Commission called on university faculties to join other members of the academic community to act together to restore the balance of athletics and academics on campus. In meetings since that time, the Knight Commission has heard testimony from professors involved in campus leadership, athletics governance, and athletics reform groups such as the Coalition on Intercollegiate Athletics and the Drake Group.
Following the Knight Commission’s Summit on the Collegiate Athlete Experience in 2006, members of campus reform groups approached the Knight Commission to propose a summit on the role of the faculty in maintaining a healthy relationship between academics and athletics on campus. The commission agreed to host such a summit.
In preparation for the Faculty Summit, the Knight Commission asked Dr. Janet H. Lawrence, an associate professor at the University of Michigan’s Center for Postsecondary and Higher Education, to conduct a national survey of faculty members at NCAA Division I Football Bowl Subdivision (formerly Division I-A) universities. The purpose was to learn how faculty members who are most likely to have knowledge about athletics issues through university governance involvement, or faculty who are most likely to interact with athletes in the classroom, perceive a range of athletics issues. The findings are to be used as background for discussions at the summit as well as for further conversation that may follow within athletic conferences and on individual campuses. The survey was designed to answer the following questions:
• How do faculty perceive intercollegiate athletics on their campuses?
• How satisfied are they with the governance, academics and financial aspects of intercollegiate athletics?
• What most concerns them about intercollegiate athletics?
• What priority do they think campus faculty governance groups should give to intercollegiate athletics?
The survey took into account how perceptions might be affected by differences in faculty members’ career experiences, campus climate, athletics success, and athletes’ academic success. Finally, the study looked at the likelihood of individual professors agreeing to get involved in solving problems in intercollegiate athletics on their own campuses and whether they believed such activity would be effective.
The survey was sent to 13,604 faculty members at 23 institutions in the NCAA’s Football Bowl Subdivision (formerly known as Division I-A). Two institutions were randomly selected from each of the eleven Football Bowl Subdivision conferences and one was chosen from the institutions not affiliated with any conference. Among those surveyed were 1) faculty currently involved in university governance (e.g., faculty senates); 2) faculty in roles associated with intercollegiate athletics oversight (e.g., faculty athletics representatives, members of campus athletics advisory boards); and, 3) tenured or tenure track faculty who teach undergraduates and, as a result, have a high probability of interacting with athletes in the classroom. Researchers received 3,005 responses from professors at all 23 institutions surveyed. However, the final sample used in the analysis consisted of 2,071 responses after adjusting for those who did not fully complete the survey, faculty currently on sabbatical, emeritus faculty, non-tenure track faculty, and administrators inadvertently included.
The sample design did not attempt to approximate a random sample of faculty that could be generalized with a margin of error since it was important to focus on faculty with governance involvement. Of this purposive sample, more than three-quarters (78 percent) are involved in faculty governance at some level and 14 percent of this group has experience with athletics governance. Only 22 percent of the respondents report no current involvement in either athletics or campus-wide governance.
SURVEY RESULTS
The overarching finding is: A striking number of professors say they don’t know about and are disconnected from issues facing college sports. It’s all the more striking because the survey sample included faculty involved in governance or undergraduate teaching—those more likely to be informed about these issues.
More than a third of faculty members are unfamiliar with select policies and practices pertaining to athletics, the financial underpinnings of athletics on campus, or concerns raised by national faculty athletics reform groups. Perhaps as a result, this lack of information results in large segments of faculty members responding that they have no opinion about a number of academic, governance and financial issues. Those who say they are informed about such operations are divided among those who are satisfied with the conduct of intercollegiate athletics on their campus and those who are not. The large segment of uninformed faculty is particularly noteworthy because the sample was designed to include faculty involved in governance or undergraduate teaching and, as a result, would seem more likely than a randomly drawn sample of university faculty to be informed about these issues.
Concerning academic issues, more than half (53 percent) have no opinion about their satisfaction with coaches’ roles in the admissions process; nearly half (49 percent) do not know if a faculty committee on campus regularly monitors the educational soundness of athletes’ programs of study; 40 percent have no opinion about the academic standards on their campus that guide admissions decisions for athletes in football and basketball, and a similar portion (38 percent) have no opinion about the attention given by campus faculty governance groups to the quality of athletes’ educational experiences.
Regarding finances, 39 percent of faculty do not know if athletics programs on their own campuses are subsidized by institutional general funds. Also, nearly a third (31 percent) offer no opinion on whether they are satisfied or dissatisfied with the use of general funds to subsidize athletics on their campus—likely the result of a lack of information on which to base an opinion.
More than a third have no opinion about the types of roles faculty members play in the governance of intercollegiate athletics (35 percent) and the range of faculty perspectives considered by central administrators when institutional positions on athletics are formulated (34 percent).
While perceptions about and satisfaction with the conduct of intercollegiate athletics are mixed among faculty who do have knowledge of athletics operations, professors generally share the same beliefs about several key issues involving governance, academics, athlete welfare and finances. These shared beliefs include the following:
GOVERNANCE
1. Faculty members say they believe intercollegiate athletics is an auxiliary service and decisions are driven by the demands of the entertainment industry.
More than six in 10 (62 percent) say that intercollegiate athletics is structurally separate from the academic part of their university, and half say that decisions about the athletics program are driven by the entertainment industry with minimal regard for their university’s academic mission.
2. Although faculty are more satisfied than not with their respective president’s oversight of athletics, they are generally dissatisfied with their roles in faculty athletics governance and the consideration of faculty input on athletics decisions. However, when asked to prioritize issues for campus faculty governance groups, intercollegiate athletics ranks very low.
Faculty members are more satisfied (46 percent) than not (28 percent) with their respective president’s oversight of intercollegiate athletics. But more faculty (36 percent) than not (28 percent) are dissatisfied with faculty athletics governance roles. More specifically, the largest portion of the faculty (41 percent) believe faculty governance roles associated with the oversight of athletics on campus are ill defined; 32 percent disagree with that statement and 26 percent do not know. Even a third of those with athletics governance experience (35 percent) believe these roles are ill defined. Further, professors are generally dissatisfied with the extent to which faculty input is considered when athletics decisions are made, and are more dissatisfied (44 percent) than not (25 percent) with the range of faculty perspectives considered by administrators when athletics positions are formulated. Further, more respondents (47 percent) than not (28 percent) believe faculty members are interested in intercollegiate governance issues on their campus. However, they rank intercollegiate athletics second to last, just above Greek life, in a list of 13 priorities for campus faculty governance groups.
3. Faculty members involved in athletics governance are more positive about all aspects of intercollegiate athletics than those who are not involved.
ACADEMICS AND ATHLETE WELFARE
1. Faculty believe athletes are motivated to earn their degrees and are academically prepared to keep pace with other students. Faculty have similar levels of satisfaction with the academic performance of students in general and athletes participating in sports other than football and basketball. However, they are significantly less satisfied with the academic performance of football and basketball players. At the same time, they recognize that athletes have less discretionary time than non-athletes.
A majority of faculty members (61 percent) believe that athletes are motivated to earn their degrees and are academically prepared to keep pace with the other students in their classes. Respondents rate their satisfaction with the academic integrity and performance of athletes and other students at similar levels, although they are significantly less satisfied with the academic performance of football and basketball athletes. Three-quarters of those surveyed believe athletes are more burdened than other students because of the demands on their out-of-class time, and the majority believe that athletes are not engaged in other campus activities.
2. While most faculty members believe that academic standards do not need to be compromised to achieve athletics success, nearly a third disagree.
While faculty acknowledge that athletes are more burdened than other students, half say they believe that academic standards do not need to be lowered to achieve athletics success. However, nearly a third (32 percent) of those surveyed believe that some compromises with academic standards must be made to achieve athletics success in football and basketball.
3. Academic concerns appear to motivate faculty to join campus efforts aimed at addressing those issues.
Faculty who are personally most concerned about the academic aspects of intercollegiate athletics are likely to join campus activities designed to ameliorate problems. Among those who think that the chances their efforts will result in meaningful campus change are greater than 50/50, the largest number said academic issues are of most concern to them. In particular, professors who are concerned about the quality of athletes’ educational experiences and their academic outcomes are the most optimistic about their chances for success.
FINANCES
1. Three in four faculty members say salaries paid to their schools’ head football and basketball coaches are excessive. The majority believe athletics financial needs get higher priority than academic needs; however, half of those surveyed also think athletics success results in financial gains to campus initiatives unrelated to sports.
Nearly three-quarters (72 percent) of faculty believe salaries paid to head football and basketball coaches on their campuses are excessive. However, with regard to finances overall, faculty members see intercollegiate athletics as a mixed blessing. On the one hand, they note the high costs associated with intercollegiate athletics, and the majority of them believe their institutions prioritize construction of state-of-the-art athletic facilities over capital projects for academic departments. On the other hand, half think the success of intercollegiate athletics fosters alumni and corporate giving to campus initiatives outside of athletics.
2. More than half of faculty members are satisfied with the practice of awarding scholarships based on athletic ability, and more faculty than not believe scholarships for basketball and football athletes may not fairly compensate them for their services.
More than half of faculty (53 percent) are satisfied with the practice of awarding scholarships based on athletics ability, nearly a third (31 percent) are not, and 15 percent have no opinion.
Also, 45 percent of respondents do not believe or only slightly believe that athletics scholarships adequately compensate athletes in football and basketball; 39 percent moderately or strongly believe that athletics scholarships constitute fair compensation; and 15 percent do not know. The survey did not ask additional questions that may further explain this perception, such as whether faculty who appear to support additional aid to football and basketball athletes believe additional aid should cover the full cost of attendance, be given only to those athletes with financial need, or be provided as an additional flat stipend.
3. Faculty who believe general university funds are used to subsidize intercollegiate athletics on their campus tend to be dissatisfied with this practice.
Of the 791 faculty members who believe that the use of general funds to subsidize intercollegiate athletics is “Slightly to Very Much” characteristic of their campus, more faculty members (64 percent) than not (24 percent) are generally dissatisfied with the use of those funds for athletics. The level of dissatisfaction dramatically decreases when the perception of the subsidization level decreases. Eighty percent of faculty who believe general fund subsidization of athletics is “Very Much” characteristic of their campus are dissatisfied with this practice, as opposed to 14 percent who are satisfied. A smaller portion (62 percent) of faculty members who believe general fund subsidization is “Moderately” characteristic of their campus are dissatisfied with the subsidization practice, while 25 percent are satisfied. Once the faculty perception reaches the level of subsidization being “Slightly” characteristic of their campus, faculty satisfaction of the practice is nearly split—41 percent are satisfied and 38 percent are dissatisfied.
4. Faculty members cite financial issues most frequently among their own personal concerns about intercollegiate athletics.
When asked what most concerns them about intercollegiate athletics on their respective campus, the largest number of faculty members (342) cite financial issues. In particular, faculty highlight the high costs of athletics and its subsidization with general funds. The next largest groups of faculty concerns about college sports are the treatment of athletes (209) and campus climates that prioritize athletics over academics (193).
IMPACT OF CAMPUS CONTEXT
Although it may seem obvious, it is useful to state that the survey results clearly demonstrate that faculty perceptions of their general campus context predict their perception of and satisfaction with their intercollegiate athletics program.
An experimental taxonomy was created to search for variations in the perceptions of faculty who work in universities that differ in academic and athletics success. Institutions from the sample were placed in one of four categories: Higher Athletic/Higher Academic; Higher Athletic/Lower Academic; Lower Athletic/Higher Academic; Lower Athletic/Lower Academic. Institutions were divided among the higher/lower academic categories based on graduation rates in football and men’s basketball and average test scores for all entering students. The higher/lower athletic categories are based on institutions’ appearances in the men’s basketball tournament and football bowl games over the most recent six-year period.
More faculty at institutions in the Higher Athletic categories believe that athletics is not subsidized by university general funds, perceive that athletics success leads to donations in other areas, and believe that their intercollegiate teams fulfill part of their university’s service mission to the state.
Faculty at institutions in the Higher Athletic/Higher Academic category more often perceive that the faculty and president agree on matters related to athletics; faculty governance roles are better defined; and the athletics department runs a clean program. However, they express more concern about the demands on athletes and are most distressed by the professionalization of intercollegiate athletics on their campus.
Faculty at institutions in the Higher Athletic/Lower Academic group are more concerned about the influence of external groups on intercollegiate athletics decisions and, compared to the other groups, assign the highest priority to intercollegiate athletics for campus governance groups. Another distinguishing characteristic of this group is that they tend to be more concerned about the structural separation of athletics from the university and a campus culture that places a greater emphasis on athletics than academics. Comparatively, faculty at campuses in the Lower Athletic/Lower Academic group are most concerned with the escalating costs of athletics and are least satisfied with the subsidization of athletics with university general funds. Although this group shares similar dissatisfaction with governance aspects, it more strongly perceives that athletics administrators use their power and influence to control decisions. Faculty members at institutions in the Lower Athletic/Higher Academic group share financial concerns with their colleagues in the other lower athletic performance group; however, they do not share the same level of dissatisfaction with governance. Faculty in this group have the highest satisfaction with the academic performance of football and basketball athletes. In contrast, they have the lowest level of satisfaction with athletes in sports other than football and basketball.
CONCLUSION AND DISCUSSION
Survey findings reveal a steep challenge ahead for those seeking greater faculty involvement in intercollegiate athletics. Although faculty members are dissatisfied with many facets of college sports, their dissatisfaction may not be strong enough to motivate action given the low priority they give intercollegiate athletics when compared to other campus issues for faculty governance to consider. Perhaps the greatest challenge to increasing faculty engagement with athletics is the lack of knowledge faculty appear to have about many key policies, practices and issues. Survey results highlight the need for administrators and faculty in campus leadership positions, and particularly those involved in athletics governance, to consider opportunities and mechanisms to better inform faculty members.
The experimental taxonomy also suggests that the level of team academic and athletics success may mediate faculty perceptions, satisfaction and concerns in significant ways. It appears useful for faculty and administrators to consider the impact these institutional characteristics have as dialogue continues about the faculty’s role in maintaining healthy relationships between academics and athletics on campus.
[Ed. Note: The complete research report and data tables are accessible at www.knightcommission.org.]
DIRECT IMPACTS OF INTERCOLLEGIATE ATHLETICS
THE PHYSICAL CAPITAL STOCK USED IN COLLEGIATE ATHLETICS
Jonathan M. Orszag and Peter R. Orszag
INTRODUCTION
In a previous interim report (“The Effects of Collegiate Athletics: An Interim Report”), we explored the financial effects of operating expenditures associated with collegiate athletics.1 That report drew upon a comprehensive database linking information collected by the National Collegiate Athletic Association (NCAA) in conjunction with the Equity in Athletics Disclosure Act (EADA) to a variety of other data sources. The report, however, underscored a substantial concern with the existing data: poor measurement of capital expenditures and the capital stock used in collegiate athletics.
The previous report highlighted two significant problems with data on the capital stock used to support intercollegiate athletics. First, the value of the outstanding athletic capital stock is not recorded anywhere on the NCAA/EADA forms. Second, new capital expenditures are not adequately reflected in the NCAA/EADA data. For example, in a survey of chief financial officers from 17 Division I schools, roughly half the respondents indicated that all athletic capital expenditures were captured by the NCAA/EADA data, and the other half indicated that at least part of athletic capital spending was not. It is thus impossible to estimate in any rigorous fashion the value of the capital services used in the “production” of intercollegiate athletics with the NCAA/EADA data.
As a result of these shortcomings in athletic-related capital data, the previous interim report was forced to focus mostly on operating expenses. Although this approach was reasonable for the purposes of the interim report, the exclusion of capital costs nonetheless represented a gap in the analysis. For example, more than half of all Division I-A schools have either opened a new football stadium or undertaken a major renovation of their old stadium since 1990. The exclusion of capital costs may be particularly important in areas such as analyzing the potential “arms race” in college athletics.
To remedy the shortcomings in the data on intercollegiate physical capital, the NCAA has taken two major steps. First, in conjunction with National Association of College and University Business Officers (NACUBO), the NCAA has devised a new annual financial survey that will better capture ongoing capital expenditures.2 Second, with funding from the Mellon Foundation, the NCAA commissioned this study to examine the existing physical capital stock used in intercollegiate athletics. Our analyses suggest that the survey data, combined with other readily available information (e.g., on stadium capacity), could be used on an ongoing basis as a rough historical measure of annual capital costs in Division I-A, even though such estimates will need to be viewed with some caution given the inherent difficulties in such extrapolation.
II. ESTIMATING THE CAPITAL STOCK USED IN INTERCOLLEGIATE ATHLETICS
The analytically correct measure of the value of capital services used in intercollegiate athletics … is equal to the replacement value of the capital stock, K, used in intercollegiate athletics multiplied by the depreciation rate … plus the opportunity cost of capital…. Obtaining a value for K by school, however, requires a current estimate of the replacement value of the capital stock—including stadiums, training facilities, fields, and other capital—used in intercollegiate athletics.3 In this section, we focus on estimating the current value of K.
A. Capital Survey
To collect information on K, we constructed a survey and, working with the NCAA, sent it to selected university officials…. It collected information on the replacement value of facilities if the institution owned the facility; the lease cost if the institution did not own the facility; the share of time the facility was used for different purposes; and the land for the facilities, practice fields, and parking lots.
The survey was completed by 56 schools, including 28 Division I (with 8 in Division I-A), and 28 schools in Divisions II and III. Table 7 provides the number of responses and representation rate (responses as a percentage of schools) in each Division.
The 56 respondent schools provided information on a total of 362 athletic facilities. Table 8 shows the distribution of facilities by sport. Roughly 7.5 percent of the facilities were used for football, roughly 14 percent were used for men’s basketball, and more than 15 percent were used for women’s basketball. One potential explanation for the greater prevalence of women’s basketball facilities than men’s basketball facilities is that men’s teams may be more likely to practice and play in the same facility.
B. Survey Data on Capital Stock Used in Intercollegiate Athletics
The capital stock used in intercollegiate athletics can be owned or leased by the university. In practice, however, the vast bulk of the relevant capital stock used by intercollegiate athletics is owned, not leased. Table 9 shows the mean survey responses by division for total replacement values, and total annual lease costs (for leased facilities). These two figures are not immediately comparable, just as the value of a house is not immediately comparable to annual rent payments. To make them comparable, we transform the annual lease payments into an estimated replacement value for the underlying facility. If the annual lease payment equals five percent of the replacement value, the mean replacement value of owned facilities represents more than 99 percent of the owned and leased “facility capital stock” used in intercollegiate athletics for the schools completing the survey. (If the lease payments are more than five percent of the replacement value, the share of total facility capital stock that is owned is even higher than 99 percent.) We therefore focus our attention on athletic facilities owned by the universities.
In addition to facilities, another element of K is the land, such as practice fields and parking lots, devoted to intercollegiate athletics. Table 10 shows the land used in intercollegiate athletic activities, as estimated by the size of practice fields and number of parking spots (both weighted by the share of the time they are estimated to be used for intercollegiate athletics). We assume that parking spaces average 350 square feet each, including aisle space.4 The final column in Table 10 therefore adds 350 times the weighted-average number of parking spots to obtain the total land used for practice fields and parking spots combined.
Table 7 Survey Response Rate
| Division | Number of Responses | Division (%) |
I | 28 | 8.6% |
I-A | 8 | 6.8 |
II | 11 | 4.0 |
III | 17 | 4.0 |
Total | 56 | 5.5% |
Source: The Physical Capital Stock Used in Collegiate Athletics. Used with permission.
Table 8 Facilities by Sport
| Sport | Number | |
Football | 27 | |
Men’s basketball | 51 | |
Women’s basketball | 56 | |
Total | 362 |
Source: The Physical Capital Stock Used in Collegiate Athletics. Used with permission.
To assess the impact of including land use in evaluating the capital employed for intercollegiate athletic activities, we must assume an opportunity value of such land for each university. We estimate the opportunity value per square acre in two different ways. In our first approach, we use data from the Integrated Post-Secondary Education Data System (IPEDS) on land values, combined with campus acreages from U.S. News and World Report. In our other approach, we assume an average land value of $15,000 per acre based on an estimate of the value of all land in the United States.5
We then scale this land value by the ratio of average housing values within five miles of the university’s zip code to the national average housing value. The results are shown in Table 11. Using either approach, land values are substantially smaller than facilities values; indeed, land values are such a small share of the total that they can be ignored for practical purposes. Reasonable variation in the assumed value of land per acre will not affect this basic finding.
Our conclusion from Tables 9 and 11 is that the replacement value of facilities used in intercollegiate athletics represents the overwhelming majority of overall capital used in those sports. Since the other components appear to represent a very small share of total athletically related capital, we focus our attention in the rest of this paper on the replacement value of facilities.
Table 9 Average Replacement Values and Lease Payments by Division
| Division | Avg. Replacement Values per Institution ($ thousands) | Avg. Annual Lease Payments per Institution ($ thousands) |
I | $94,301 | $42.4 |
I-A | 240,627 | 68.8 |
II | 10,944 | 1.4 |
III | 23,482 | 0.2 |
All Divisions | $56,429 | $21.5 |
Source: The Physical Capital Stock Used in Collegiate Athletics. Used with permission.
Note: Three schools did not provide replacement values for facilities they own. Other schools did not provide replacement costs for all their owned facilities. Such facilities are, therefore, excluded from the table.
Table 10 Average Land Use by Division
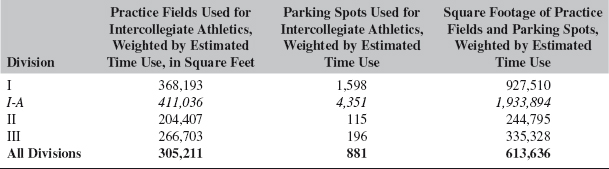
Sources: The Physical Capital Stock Used in Collegiate Athletics. Used with permission.
III. ESTIMATING THE COST OF CAPITAL USED IN INTERCOLLEGIATE ATHLETICS
To obtain an annual capital cost for intercollegiate athletics, we combine the estimated replacement value of facilities with different estimates of depreciation and financing costs. Winsten (1998) assumes a depreciation rate for college facilities (not just athletic ones) of 2.5 percent per year; we adopt that depreciation rate here.6 The value of financing costs should depend on the institution’s alternative investment opportunities; we assume that the alternative investment opportunities would earn 7.5 percent per year.7 Our central estimate of depreciation and financing costs combined is therefore 10 percent; we also show the results for 7.5 percent and 12.5 percent.
… [U]nder our central estimate, the annual capital costs associated with intercollegiate athletics averages $9 million at Division I schools and $24 million at Division I-A schools. The average annual capital cost at Division II and Division III schools is significantly lower; an average of about $1 million at Division II schools, and an average of about $2 million at Division III schools.
To provide some points of comparison for these figures, we initially consider the Division I-A results. The $24 million average annual capital cost for intercollegiate athletic facilities is roughly equal to the average operating cost for intercollegiate athletics in Division I-A of more than $27 million. In other words, the largely unrecorded annual cost associated with intercollegiate capital facilities is roughly equal to the reported annual operating expenditures on intercollegiate athletics.
… The data from the capital survey, combined with data from the Department of Education, can be used to compute the athletic share of overall institutional spending, including capital costs both in the athletic and overall figures.8 Of the Division I respondents to the capital survey, we were able to obtain data on total institutional capital values for eight public universities.9 For these eight schools, operating athletic spending represented 2.6 percent of total operating spending for the institutions. Including athletic and overall institutional capital costs, athletic spending represented 3.7 percent of total institutional spending. In other words, including capital costs does not alter the qualitative result that athletic spending represents a relatively small share of total institutional spending in Division I, at least for the schools for which data were available.
Other comparisons may provide further insight into the magnitude of annual athletic capital costs. (Data on annual non-athletic expenditures for these comparisons were obtained directly from financial reports posted on institutional websites.) The estimated $5 million average annual capital cost for intercollegiate athletic facilities at one Division I school is roughly equal to half of its academic support and student aid expenses. At another Division I school, the average annual capital cost is about one-third the cost of annual library collection purchases. At one Division I-A school, the $23 million average capital cost for intercollegiate athletic facilities is roughly equal to the annual expenses associated with its libraries. At one Division III school, the $5 million average capital cost for intercollegiate athletic facilities is roughly equal to one-third the cost of research.
Table 11 Average Facility Value and Land Value
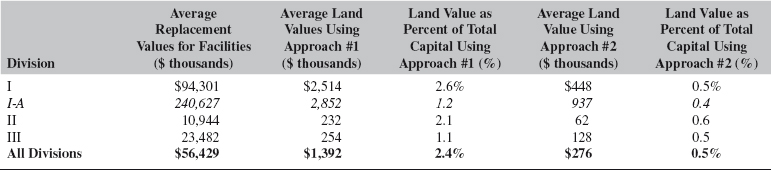
Source: The Physical Capital Stock Used in Collegiate Athletics. Used with permission.
Table 12 Annual Capital Costs of Football and Men’s Basketball Facilities as a Percent of Total Annual Capital Costs for All Athletic Facilities
| Division | Annual Capital Costs of Football as a Percent of Total (%) | Annual Capital Costs of Football and Men’s Basketball as a Percent of Total (%) |
I | 34.7% | 46.9% |
I-A | 44.2 | 54.5 |
II | 6.3 | 26.8 |
III | 2.1 | 9.6 |
All Divisions | 29.5% | 41.4% |
Source: The Physical Capital Stock Used in Collegiate Athletics. Used with permission.
… [A]verage annual capital costs for football facilities are roughly $10.6 million for Division I-A, $69,000 for Division II, and $49,000 for Division III. By comparison, in 2003, average operating expenditures on football were roughly $7 million, $0.5 million, and $0.2 million in Divisions I-A, II, and III, respectively…. [A]verage annual capital costs for basketball facilities are roughly $1.1 to $1.2 million for Division I, $224,000 for Division II, and $177,000 for Division III.
….
Table 12 shows that these two sports represent a significant share of athletically related capital costs: For all schools combined, they represent more than 40 percent of the total. These two sports represent an even higher share of total capital costs among Division I-A schools: 55 percent of capital costs in Division I-A are associated with football and men’s basketball.
Football and basketball facilities play an even larger role in explaining the variation of replacement costs across schools than may be suggested…. To understand how this could occur, assume that every school has similar facilities for sports such as baseball, soccer, and field hockey, but have substantially different facilities for football and men’s basketball. In this situation, football and basketball may, on average, represent a significant share of total costs, but explain even more of the differences in total replacement costs across schools. This is indeed what the data show: football and men’s basketball facilities explain between 80 and 90 percent of the variation in total capital costs across schools; nearly all of this explanatory power comes from football facilities. These findings highlight the benefits of focusing on these two sports, especially football, in explaining the variation in capital costs across athletic programs either for all divisions or within Division I.
Outside of Division I, however, the replacement costs for football and basketball stadiums account for a much smaller share of total costs and explain a much smaller share of the variation of such costs across schools. In Divisions II and III, it is harder to find a single variable that explains a majority of the variation in replacement costs across schools. In those divisions, the total number of varsity teams appears to be the strongest single explanatory variable of total replacement costs.
IV. POTENTIAL APPLICATIONS OF CAPITAL SURVEY DATA
The key role of football in the overall cost of athletic capital (at least when Division I schools are included in the analysis) warrants further examination of the underlying factors affecting capital costs for that sport. In this section, we show that the annual football capital costs are largely driven by the capacity of the stadiums. Since stadium capacity is available for all schools, not just those schools in our sample, this finding may provide a mechanism for assessing changes in annual capital costs over time.
Under the assumption that the relationship between the key observed characteristics of football stadiums and the replacement costs of such stadiums is the same for those schools that completed the survey and those schools that did not complete the survey, and that the relationship holds over time, a statistical relationship can be used to estimate the value of other football stadiums.10 That, in turn, can be used in two key settings.
First, analysts can monitor the most significant component of athletic capital costs simply by observing changes in stadium capacity. The data show that replacement costs are the key driver of total capital costs for Division I schools, that the replacement costs of football stadiums are the key driver of total replacement costs, and that football stadium capacity is the key driver of the replacement costs of football stadiums. Indeed, variation in the level … of football stadium capacity alone explains between 60 and 75 percent of the variation in total replacement costs (in either levels or natural logs) for all athletic facilities. This key finding may provide a simple and cost-effective means of tracking historical athletic capital costs.
Second, for Division I-A schools, football capacity can be used to examine whether an “arms race” has taken place in capital expenditures. An arms race appears to mean different things to different observers. For example, some observers define an arms race as an increase in inequality in athletic capital spending or merely an absolute increase in aggregate capital spending. A somewhat more precise definition of an “arms race” is that increased spending at School A triggers increased capital spending at School B, which then feeds back into pressure on School A to further raise its own capital spending. To examine this definition of an arms race, we examined whether an increase in football stadium capacity by other members of a school’s conference statistically increased the likelihood that the school itself expanded stadium capacity. We use data on football stadium capacity for all Division I-A schools from 1991 to 2004, not just for those schools completing our survey. The analysis suggests the possible, albeit weak, presence of an arms race in football capital spending within Division I-A: The expansion of a stadium at one school within a conference appears to make it more likely that other schools within that same conference will expand the capacity of their stadiums, although this finding is sensitive to specific assumptions employed in the statistical analysis.11 The evidence that does exist to suggest an arms race in football stadium capacity appears to be present in particular within the six major football conferences.12 The magnitude of the effect even within the major conferences appears to be relatively weak. In other words, even in the regression specifications where the effect is statistically significant, the practical implications appear to be limited because the magnitude of the effect is small.13
V. CONCLUSION
The absence of reliable data on the capital costs associated with intercollegiate athletics has significantly limited a full understanding of the finances of college sports. This study represents a useful step toward better understanding athletically related costs. In the future, analysts and university officials will have even more insight into athletically related capital spending because of the improved accounting and data collection devised by the NCAA and NACUBO.
Notes
1. Robert E. Litan, Jonathan M. Orszag, and Peter R. Orszag, “The Empirical Effects of Collegiate Athletics: An Interim Report,” August 2003, available at http://www.ncaa.org/databases/baselineStudy/baseline.pdf.
2. See, for example, http://www1.ncaa.org/membership/ed_outreach/eada/forms/procedures.pdf.
3. See, for example, Gordon C. Winston, “A Guide to Measuring College Costs,” Williams College, DP-46, January 1998.
4. A variety of estimates suggest an average size between 300 and 350 square feet (including aisle space) per parking spot. We choose the high end of this range to produce an upper-bound estimate. See, for example, http://www.nuggetnews.com/archives/20040317/front13.shtml, http://www.ci.bloomington.mn.us/meetings/pc/synopsis/1996/092696pcs.htm, http://64.233.161.104/search?q=cache:l0vj7QSePacJ:gulliver.trb.org/publications/tcrp/tcrp_rpt_35.pdf+%22AVERAGE+PARKING+SPACE+%22&hl=en, or http://pen.ci.santamonica.ca.us/cityclerk/council/agendas/1989/s89121211-E.html.
5. J. Ted Gwartney and Nicolaus Tideman. “The Jerome Levy Economic Institute Conference: land, wealth and poverty.” The American Journal of Economics and Sociology, July, 1996. The paper states that there is no consistent estimate of land value for the U.S., but cites an estimate that results in a total US land value of $30 trillion. We divide this by the 2,271,343,360 acres in the United States to get an estimate of $13,208 per acre, and round up to produce an overestimate and account for inflation.
6. Gordon C. Winston, “A Guide to Measuring College Costs,” Williams College, DP-46, January 1998.
7. If anything, this estimate may be slightly too high, but it is possible that the depreciation estimate is slightly too low. A central estimate of 10 percent for the combined capital costs provides insight into the order of magnitude; as shown below, small variations above and below that central estimate do not change our fundamental conclusions.
8. The most recent available total institutional capital values were for 2001. We converted those figures into 2003 dollars using the Consumer Price Index. To compute the annual capital costs, we adopt the same assumptions as athletic capital costs (i.e., depreciation plus financing costs equal 10 percent of the capital stock).
9. The Department of Education does not publish data on total institutional capital values for private universities.
10. In particular, to predict the replacement cost of facilities used for football, we first attempted to explain the variation in the replacement costs for football stadiums across the schools completing our survey based on a number of key observable characteristics of the football stadiums. We estimated regressions that included characteristics of the schools (e.g., enrollment) and additional characteristics of the facilities (e.g., number of luxury boxes). We concluded that a parsimonious specification that explains a substantial degree of the variation in football stadium replacement costs (in thousands) is:
ln(replacement cost) = 6.61+1.25*ln(capacity) – 0.33*ln(age)
where ln is the natural log of each variable, capacity is the stadium’s seating capacity, and age is its age. The coefficients sensibly imply that larger stadiums have higher replacement costs; older stadiums have smaller replacement costs. The coefficient on ln(capacity) is statistically significantly different from zero at the one percent level and the coefficient on ln(age) statistically significantly different from zero at the 10 percent level. (The impact of age is relatively modest and reflects differences in stadium characteristics (e.g., luxury boxes, number of bathrooms, etc.) based on date of construction.) These variables explain 76 percent of the variation in the natural log of the reported replacement costs; the key variable is stadium capacity, which alone explains 72 percent of the variation in the natural log of the reported replacement costs. Age and capacity also play a key role in explaining men’s basketball replacement costs, but are less effective in explaining the variation of men’s basketball replacement costs than football replacement costs.
11. For example, some schools reported relatively small changes in stadium capacity from year to year that may not reflect true underlying changes in the stadium. If the analysis ignores these small and potentially erroneous changes, the evidence for an arms race, which is not overwhelming in the first instance, is attenuated.
12. We classified as “major” conferences the SEC, Big Ten, Big 12, ACC, Big East, and Pac-10 (and their predecessors).
13. For example, under one specification, the data suggest that if the maximum capacity within one of the major conferences increases by 10,000 seats, the average predicted increase at other schools within that same conference is roughly 500 seats.
THE EMPIRICAL EFFECTS OF COLLEGIATE ATHLETICS: AN UPDATE TO THE INTERIM REPORT
Jonathan M. Orszag and Peter R. Orszag
In a previous interim report (“The Effects of Collegiate Athletics: An Interim Report”), we explored the financial effects of operating expenditures associated with collegiate athletics.1 That report drew upon a comprehensive database linking information collected by the National Collegiate Athletic Association (NCAA) in conjunction with the Equity in Athletics Disclosure Act (EADA) to a variety of other data sources.
The interim report underscored two concerns with the existing data at that time: First, the data suffered from poor measurement of capital expenditures and the capital stock used in collegiate athletics. A companion analysis addresses this concern.2 Second, the available data covered only an eight-year period. Using more recently available data, this update extends the analysis so that it covers a 10-year period.
The interim report specifically examined ten hypotheses about college athletics, focusing primarily on Division I-A schools. Using updated data and other recently released information, we re-examine each of the hypotheses. Our analysis confirms five of the hypotheses; the other five are not proven and require further empirical analysis:3
Hypothesis #1: Operating Athletic Expenditures are a Relatively Small Share of Overall Institutional Spending
• According to Department of Education data, reported athletic spending represented roughly four percent of total higher education spending for Division I-A schools in 2001 (the most recent comprehensive Department of Education data publicly available). In 1997, this share was roughly three percent.
• In 2003, NCAA/EADA data suggest that operating athletic spending represented roughly 3.8 percent of total higher education spending for Division I-A schools. By comparison, the share was roughly 3.3 percent in 2001.
• The share of operating athletic spending in a university’s total budget is higher for smaller Division I-A schools than for larger Division I-A schools because of the fixed costs associated with an athletic department.
• The share of operating athletic spending in overall higher education spending has increased over time as indicated by the comparisons above. In recent years, athletic spending has been growing more rapidly than total spending, so the athletics’ share of the total has been increasing. In particular, total athletic spending increased by roughly 20 percent in nominal terms between 2001 and 2003; total institutional spending rose by less than five percent during the same period, according to NCAA/EADA data.
• Despite the recent increase in relative athletic spending, we continue to conclude that operating athletic expenditures in the aggregate are a relatively small share of total higher education spending for Division I-A schools.
• These spending shares exclude capital spending. Our companion piece finds that including capital spending for both athletics and the overall university budget modestly raises the share of total spending attributed to athletics, but does not alter the fundamental conclusion that athletic spending represents a small share of total institutional spending.
Hypothesis #2: Football and Basketball Exhibited Increased Levels of Inequality in the 1990s
• A common measure of inequality is the Gini coefficient, which would equal one if one school accounted for all spending and zero if spending were the same across schools. Increases in the Gini coefficient represent increased levels of inequality and vice versa.
• Between 1993 and 2003, the Gini coefficient for Division I-A football spending rose from 0.23 to 0.30…. The Gini coefficient for Division I-A basketball spending also rose sharply, from 0.24 to 0.30.
• We continue to conclude that football and basketball exhibited increased levels of inequality between 1993 and 2003.
Hypothesis #3: Football and Basketball Exhibit Mobility in Expenditure, Revenue, and Winning Percentages
• More than 30 percent of the schools that were in the top quintile of Division I-A football spending in 1993 were no longer in the top quintile by 2003. More than three-fifths of the schools in the middle quintile in 1993 were no longer there in 2003; less than two-fifths had moved up and one-fourth had moved down.
• Net revenue also exhibited some degree of mobility: Among the schools in the middle quintile of football net revenue in 1993, roughly three-quarters were no longer in the middle quintile in 2003.
• A school’s winning percentage exhibits only modest levels of persistence. For example, the correlation of winning percentages from one year to the next is only about 50 percent. The correlation dissipates over time: The correlation between winning percentages ten years apart is 20 to 30 percent.
• We continue to conclude that football and basketball exhibit some degree of mobility in expenditure, revenue, and winning percentages.
Hypothesis #4: Increased Operating Expenditures on Football or Basketball, on Average, are not Associated with Any Medium-Term Increase or Decrease in Operating Net Revenue
• Our statistical analyses suggest that between 1993 and 2003, an increase in operating expenditures of $1 on football or men’s basketball in Division I-A was associated with approximately $1 in additional operating revenue, on average. The implication is that spending an extra $1 was not associated with any increase or decrease in net revenue, on average, from these sports.
• These results continue to have limitations. For example, our database covers a 10-year time period, but any effects may have longer lags. If this were the case, our database may be too short to capture the “true” effects of increased spending. In addition, as noted above, the NCAA/EADA data do not adequately record capital expenditures; our analysis therefore focuses on operating spending. It is possible that the effects of operating spending differ from the effects of capital spending.
• We continue to conclude that over the medium term (ten years), increases in operating expenditures on football or men’s basketball are not associated with any change, on average, in operating net revenue.
Hypothesis #5: Increased Operating Expenditures on Football or Basketball are not Associated with Medium-Term Increases in Winning Percentages, and Higher Winning Percentages are not Associated with Medium-Term Increases in Operating Revenue or Operating Net Revenue
• A variety of econometric exercises suggests no robust statistical relationship between changes in operating expenditures on football and changes in football winning percentages between 1993 and 2003.
• A variety of econometric exercises also suggests no robust statistical relationship between changes in winning percentages and changes in football operating revenue or net revenue between 1993 and 2003.
• We continue to conclude that increased operating expenditures on football or basketball are not associated with medium-term increases in winning percentages, and higher winning percentages are not associated with medium-term increases in operating revenue or operating net revenue.
Hypothesis #6: The Relationship Between Spending and Revenue Varies Significantly By Sub-Groups of Schools (e.g., Conferences, Schools with High SAT Scores, Etc.)
• With the updated database, we examined the relationship between spending and revenue across various subsets of schools. We were still not able to detect evidence of systematic differences when separating the schools by characteristics such as: public vs. private schools; schools with high SAT scores vs. schools with low SAT scores; large student populations vs. small student populations; schools that were ever in the Associated Press (AP) rankings; and schools that were ranked in the top 25 in the AP poll in 1993.
• In many cases, the sample sizes for the subsets of schools were quite small; given the paucity of data in some cases, it is difficult to reject the hypothesis outright. Instead, we continue to conclude that the hypothesis that the relationships vary significantly by subgroups of schools is not proven.
Hypothesis #7: Increased Operating Expenditures on Big-Time Sports Affect Operating Expenditures on Other Sports
• Our statistical analysis of the updated data suggests that each dollar increase in operating expenditures on football among Division I-A schools may be associated with a $0.27 increase in spending on women’s sports excluding basketball and $0.37 including basketball, but the results are not robust to changes in the econometric specification. Such a potential spillover effect may be expected given Title IX and other pressures to ensure equity between men’s and women’s sports.
• Previous studies have found that increases in football spending are associated with increased spending on women’s sports.
• Given the lack of robustness of the results, we continue to conclude that the hypothesis that increased operating expenditures on big-time sports affect operating expenditures on other sports is not proven.
Hypothesis #8: Increased Operating Expenditures on Sports Affect Measurable Academic Quality in the Medium Term
• Our statistical analysis of the updated data suggests no relationship—either positive or negative—between changes in operating expenditures on football or basketball among Division I-A schools and incoming SAT scores or the percentage of applicants accepted.
• The academic literature is divided on whether athletic programs affect academic quality. While our results suggest no statistical relationship one way or the other, our data are limited to ten years and such a relationship may exist over longer periods of time. In addition, the relationship between athletics and academic quality may manifest itself in ways other than the effect on SAT scores or other directly measurable indicators.
• We continue to conclude that the hypothesis that changes in operating expenditures on big-time sports affect measurable academic quality in the medium term is not proven.
Hypothesis #9: Increased Operating Expenditures on Sports Affect Other Measurable Indicators, Including Alumni Giving
• Econometric analysis using our updated database shows little or no robust relationship between changes in operating expenditures on football or basketball among Division I-A schools and alumni giving (either to the sports program or the university itself).
• The academic literature is again inconclusive on this issue. As with the previous hypothesis, our results suggest little or no statistical relationship—but our data are limited to ten years and such a relationship may exist over longer periods of time.
• We continue to conclude that the hypothesis that increased operating expenditures on sports affect other measurable indicators, including alumni giving, is not proven.
Hypothesis #10: Football and Basketball Exhibit An “Arms Race” in which Increased Operating Expenditures At One School Are Associated With Increases At Other Schools
• Analysts have used the term “arms race” to describe a variety of phenomena. We use the term to refer to a situation in which increased spending at one school is associated with increases at other schools.4
• In our updated analysis, some econometric analyses suggest that increased operating expenditures on football at one school may be associated with increases in operating expenditures at other schools within the same conference, but most specifications suggest no relationship.
• We continue to conclude that the hypothesis that football and basketball exhibit an “arms race” in which increased operating expenditures at one school are associated with increases at other schools is not proven.
• It is important to emphasize that the existence of an “arms race” may be concentrated in capital expenditures, which are not adequately recorded in the NCAA/EADA data, rather than in operating expenditures.
• In our companion paper on capital expenditures, we explore this issue in more detail. We examined whether an increase in football stadium capacity by other members of a school’s conference statistically increased the likelihood that the school itself expanded stadium capacity.
• The analysis suggests the possible, albeit weak, presence of an arms race in football capital spending within Division I-A: The expansion of a stadium at one school within a conference appears to make it more likely that others schools within that same conference will expand the capacity of their stadiums, although this finding is sensitive to specific assumptions employed in the statistical analysis. Even in the regression specifications where the effect is statistically significant, the practical implications appear to be limited because the magnitude of the effect is small.
CONCLUSION
This update reflects an effort to continue exploring the empirical effects of collegiate athletics. It updates the analysis contained in the interim report with new data and information. As in the interim report, we continue to find that many widely held perspectives about spending on big-time sports by colleges—by both proponents and opponents of such spending—are not supported by the statistical evidence.
Our results must continue to be qualified, however. Although the data in this paper are more comprehensive than other datasets that have been used in the past, they remain imperfect: They are available only between 1993 and 2003, and they fail to capture fully various components of athletic activities (especially total capital expenditures and staff compensation from all sources). Further efforts are underway to improve the data; in conjunction with National Association of College and University Business Officers (NACUBO), the NCAA has devised a new annual financial survey that will better capture ongoing capital expenditures. As these new data become available, they should provide additional insights into the effects of college athletics on institutions of higher education.
1. Robert E. Litan, Jonathan M. Orszag, and Peter R. Orszag, “The Empirical Effects of Collegiate Athletics: An Interim Report,” August 2003, available at http://www.ncaa.org/databases/baselineStudy/baseline.pdf (“Interim Report”).
2. Jonathan M. Orszag and Peter R. Orszag, “The Physical Capital Stock Used in Collegiate Athletics,” April 2005.
3. We note that since our interim report was released in August 2003, an analysis prepared for the Knight Foundation Commission on Intercollegiate Athletics reached many of the same conclusions. Robert H. Frank, “Challenging the Myth: A Review of the Links Among College Athletic Success, Student Quality, and Donations,” May 2004, available at http://www.knightfdn.org/athletics/reports/2004_frankreport/KCIA_Frank_report_2004.pdf.
4. In particular, we define an “arms race” as occurring when an increase in spending at School A triggers an increase in spending at School B, which then feeds back into pressure on School A to further raise its own spending. To examine this definition of an arms race, we examined whether increased spending by other members of a school’s conference was statistically associated with increased spending by the school itself.
INDIRECT IMPACTS OF INTERCOLLEGIATE ATHLETICS
CHALLENGING THE MYTH: A REVIEW OF THE LINKS AMONG COLLEGE ATHLETIC SUCCESS, STUDENT QUALITY, AND DONATIONS
Robert H. Frank
INTRODUCTION
Big-time college athletic programs are expensive. At the University of Michigan, for example, total spending on athletics approached $50 million in the 2003–2004 academic year.1 Athletic budgets are also rising quickly. Between 1995 and 2001, they rose more than twice as fast as university budgets overall in Division I schools, the most competitive NCAA classification. In real terms, athletic program spending rose about 25 percent during that period, while overall spending rose only about 10 percent.2
In view of the enormous revenues that can accrue to the most successful programs, the incentives to compete for the limited number of positions at the top of the college athletics hierarchy are strong. In 2003, the NCAA’s postseason football Bowl Championship Series alone distributed $104 million among 64 Division I college programs.3 Yet the overall distribution of financial rewards is highly skewed, and at all but a small proportion of institutions, revenues are now outweighed by expenditures on athletic programs. Athletic budgets are increasingly funded by student fees, which range from $50 to $1,000 per student each year. Such fees now account for an average of 20 percent of the athletic budgets at Division I Schools.4
If expenditures exceed revenues in most college athletic programs, why are universities investing so much more each year in these programs? I will consider two possible explanations. The first is a structural one common to many other markets in which reward is determined by relative performance. In such markets, we will see, it is not uncommon for contestants to invest more in performance enhancement than can reasonably be justified by the expected gains. The second possibility is that although a successful athletic program may fail to cover its direct costs, it may generate indirect benefits in other domains that are of sufficient value to make up the shortfall. Two such indirect benefits have been widely claimed to exist—namely, that successful college athletic programs stimulate both additional alumni donations and additional applications from prospective students. Since tuition payments typically fall well short of the cost of educating each student, additional applications do not improve a university’s financial position directly, and may even hinder it if they result in larger numbers of students admitted. Yet by enabling an institution to become more selective, additional applications could help a university move up in the race for academic prestige, a valuable benefit in its own right.
COLLEGE ATHLETICS AS A WINNER-TAKE-ALL MARKET
It might seem that a university’s decision about whether to mount a big-time college athletic program is like any other ordinary business decision about whether to enter a particular market. The general rule is that if a business expects that it can enter a market profitably, it will do so; otherwise, it will not. But attempts to apply this rule often play out with unanticipated consequences when the reward from entering a market depends less on the absolute quality of the business’s product than on its relative quality. Philip Cook and I use the term winner-take-all markets to describe arenas with this form of reward structure. In winner-take-all markets, the expectation is often that participants as a whole will not make any money, and that indeed a substantial majority will suffer losses.
A feel for how winner-take-all markets differ from ordinary markets is afforded by experiments involving a simple auction called the entrapment game. First described by the economist Martin Shubik, this game is just like a standard auction except for one feature. The auctioneer announces to an assembled group of subjects that he is going to auction off some money—say, a $20 bill—to the highest bidder. Once the bidding opens, each successive bid must exceed the previous one by some specified amount—say, 50 cents. The special feature of the entrapment game is that once the bidding stops, not only must the highest bidder remit the amount of his bid to the auctioneer, but so must the second-highest bidder. The highest bidder then gets the $20 bill and the second-highest bidder gets nothing. For example, if the highest bid were $8 and the second-highest bid were $7.50, the auctioneer would collect a total of $15.50. The highest bidder would get the $20, for a net gain of $12; and the second-highest bidder would experience a loss of $7.50.
Players in this game face incentives much like the ones that confront participants in winner-take-all markets as they consider whether to undertake investments in performance enhancement. In both cases, by investing a little more than one’s rivals, one can tip the outcome decisively in one’s favor.
Although the subjects in these experiments have ranged from business executives to college undergraduates, the pattern of bidding is almost always the same. Following the opening bid, offers proceed quickly to $10, or half the amount being auctioned. There is then a pause as the subjects appear to digest the fact that, with the next bid, the two highest bids will sum to more than $20, thus taking the auctioneer off the hook. At this point, the second-highest bidder, whose bid stands at $9.50, invariably offers $10.50, apparently thinking that it would be better to have a shot at winning $9.50 than to take a sure loss of $9.50.
In most cases, all but the top two bidders drop out at this point, and the top two quickly escalate their bids. As the bidding approaches $20, there is a second pause, this time as the top bidders appear to be pondering the fact that even the top bidder is likely to come out behind. The second bidder, at $19.50, is understandably reluctant to offer $20.50. But consider his alternative. If he drops out, he will lose $19.50 for sure. But if he offers $20.50 and wins, he will lose only 50 cents. So as long as he thinks there is even a small chance that the other bidder will drop out, it makes sense to continue. Once the $20 threshold has been crossed, the pace of the bidding quickens again, and from then on it is a war of nerves between the two remaining bidders. It is quite common for the bidding to reach $50 before someone finally yields in frustration.
One might be tempted to think that any intelligent, well-informed person would know better than to become involved in an auction whose incentives so strongly favor costly escalation. But many of the subjects in these auctions have been experienced business professionals; many others have had formal training in the theory of games and strategic interaction….
Shubik’s entrapment game obviously doesn’t capture the rich details that characterize the current market for big-time college athletics. So I now consider an example that, while still highly simplified, resembles this market more closely. Suppose 1,000 universities must decide whether to launch an athletic program, the initial cost of which would be $1 million a year. Those who launch a program then compete in an annual tournament in which finishers among the top 10 earn a prize of $10 million each. To further simplify matters, suppose that those deciding to launch an athletic program all have equal access to the limited pool of talented players, skilled coaches, and other inputs required for these programs (making each participant as likely as any other to finish in the top 10). If schools make their decisions about whether to launch a program in sequence, and each school can observe how many other schools have already entered the arena, how many schools will decide to compete?
If every institution’s decision were driven solely by whether it could expect to make a profit (or at least avoid a loss) by launching a program, we would expect only 100 of the 1,000 institutions to launch athletic programs and the remaining 900 to sit out. That way, the competing institutions would each have a one-tenth chance at winning a prize of $10 million, or an expected revenue of $1 million, just enough to cover the cost of entry. In any given year, the top 10 finishers will thus post net gains of $9 million each, while the 90 remaining institutions will post a net loss of $1 million each. Under the assumption that all contestants have equal access to the inputs for athletic programs, each program will end up winning once every 10 years, on average. Under these simplifying assumptions, maintaining a big-time athletic program would be, in effect, a break-even proposition over the long run. Participants wouldn’t make any money, on the average. But they wouldn’t lose any money, either.
This example abstracts from reality in at least two ways that make launching a big-time athletic program seem more economically attractive than in fact it is. For one, it assumes that when a university assesses its prospects, it is accurate in its estimate of the probability that its own program will be among the winners. Yet there is abundant evidence that potential contestants are notoriously optimistic in their estimates of how well they are likely to perform relative to others.
This tendency has been recognized for centuries. As Adam Smith described it,
The overweening conceit which the greater part of men have of their own abilities, is an ancient evil remarked by the philosophers and moralists of all ages. Their absurd presumption in their own good fortune, has been less taken notice of. It is, however, if possible, still more universal. There is no man living who when in tolerable health and spirits, has not some share of it. The chance of gain is by every man more or less over-valued, and the chance of loss is by most men under-valued, and by scarce any man, who is in tolerable health and spirits, valued more than it is worth.6
Smith’s characterization of human nature is no less accurate today than when he offered it more than 200 years ago….
Psychologists call this pattern the “Lake Wobegon Effect,” after Garrison Keillor’s mythical Minnesota town “where the women are strong, the men are good-looking, and all the children are above average.”14 The phenomenon has most often been explained in motivational terms by authors who note that the observed biases are psychologically gratifying.15 …
But the Lake Wobegon bias clearly has cognitive dimensions as well. Thus psychologists Amos Tversky and Daniel Kahneman have shown that when people try to estimate the likelihood of an event, they often rely on how easily they can summon examples of similar events from memory.17 Yet, although ease of recall does, in fact, rise with the frequency of similar events, it also depends on other factors. For example, events that are especially salient or vivid are easily recalled even if they happen only infrequently. Since teams from the most successful college athletic programs appear in a disproportionate share of the televised games and capture a disproportionate share of national media coverage, the good fortunes of these programs are nothing if not salient. In contrast, the fates of unsuccessful programs, which receive little or no media attention, are much less likely to spring to mind.
If the university administrators who decide whether to launch big-time athletic programs are like normal human beings in other domains, they are likely to overestimate the odds that their programs will be successful. The upshot is that many more institutions are likely to launch big-time athletic programs than would be warranted by unbiased profit-and-loss estimates.
A second misleading simplification in my illustrative example is the assumption that the level of expenditure required to launch and maintain a big-time athletic program is fixed. Expenditures on these programs are in fact constantly subject to reassessment and adjustment. As in Shubik’s entrapment auction, any given athletic director knows that his school’s odds of having a winning program will go up if it spends a little more than its rivals on coaches and recruiting. But the same calculus is plainly visible to all other schools. And again as in Shubik’s auction, the gains from bidding higher turn out to be self-canceling when everyone does it. The result is often an expenditure arms race with no apparent limit.
Evidence suggests that big-time college athletic programs find themselves embroiled in just such an arms race. NCAA Division I-A head football coaches, for example, earned an average annual base salary of more than $388,000 last year, an increase of more than 80 percent in real terms over the 1998 average.18 But base salary is often only a small component of coaches’ total annual compensation….
In sum, the logic of competition in winner-take-all markets suggests that participants in these markets are likely to experience much less favorable economic results than they had expected at the outset. Upward biased estimates of success will tempt more institutions to enter than would be warranted by the logic of profit and loss. And each institution, once entered, will face powerful incentives to increase its expenditures in search of a competitive edge. This logic is in harmony with the observation that the revenues generated directly by college athletic programs fall far short of covering their costs in the overwhelming majority of cases.
INDIRECT BENEFITS OF COLLEGE ATHLETIC PROGRAMS
Even if a college athletic program fails to generate sufficient direct revenue to cover its costs, it might generate indirect benefits of sufficient magnitude to bridge the shortfall. Two such indirect benefits have been widely discussed: 1) that a winning athletic program leads to additional contributions from alumni and others; and 2) that a winning program generates additional applications from prospective students (resulting, presumably, in a higher quality freshman class). How do these indirect benefits affect the theoretical presumption that an institution that launches a big-time athletic program should expect to lose money?
Consider first the issue of alumni donations. Given that many alumni donations are earmarked specifically for college athletic programs, there is no doubt that many alumni feel strongly about these programs. Whether such donations simply displace donations that would have been made for academic programs is an empirical question, one that I will address presently. But suppose, for the sake of discussion that having a winning athletic program leads to a net increase in the flow of alumni donations. How do these additional revenues alter an institution’s expectation about the financial consequences of launching a big-time athletic program?
From an economic perspective, indirect revenues from donations are functionally equivalent to revenues generated directly by athletic programs, such as those from ticket sales and television contracts. Growth in direct sources of revenue has two effects: It induces more institutions to launch athletic programs, and it induces those having such programs to invest more heavily in them. Following a once-for-all increase in the revenue distributed from the NCAA’s annual March Madness basketball tournament, for example, the expectation is that a new equilibrium will eventually be reached in which there are more institutions that have serious basketball programs, and in which average expenditures on such programs are higher than before. But just as each competing institution faced the expectation of an economic loss in the original equilibrium, the same will be true in the new equilibrium. From the perspective of each competing institution, the gains from the additional revenues are offset by the presence of additional competitors (which reduces each institution’s odds of having a winning program) and by increased spending on coaches, recruiting, and other inputs.
Adding alumni donations into the revenue mix has precisely the same effect as increasing the payout from television contracts. In the presence of such donations, a new equilibrium results in which both the expected number of athletic programs and the expected level of total expenditures in each become larger than before.
What about the possibility that a successful athletic program might boost the number of prospective students who apply, thus enabling an institution to become more selective, in turn boosting its position in rankings such as those published by the US News and World Report? As in the case of alumni donations, there can be little doubt that a successful athletic program will encourage at least some additional applications. But since all institutions are likely to operate under the same expectation, the existence of this benefit is analogous in its effects to higher TV revenues and increased alumni donations. That is to say, it will cause additional institutions to enter the big-time athletic arena and those already in that arena to spend more than before on their athletic programs. So to the extent that having a successful big-time athletic program stimulates additional applications, that fact implies that institutions will have to spend more money than before to achieve a winning program.
Viewed from the perspective of institutions of higher learning as a whole, it is impossible for additional investment in athletic programs to cause schools to become more selective on the average. Selectivity, after all, is a purely relative concept: It is mathematically impossible for more than ten percent of all schools to be among the ten percent most selective. Still, if applications track athletic success closely, any single school’s failure to invest in a big-time athletic program might mean that its selectivity would fall relative to that of other schools. But even that would not imply that investment in a big-time athletic program is an efficient strategy for becoming more selective. The same funds used to boost athletic performance could be used in other ways that make schools more attractive to potential applicants—financial aid, for example, or increased direct marketing, or improved academic programs. So here again, it becomes an empirical question as to whether greater investment in big-time athletic programs is likely to improve the quality of a school’s entering freshman class relative to what it would have been had the same money been spent in other ways.
EMPIRICAL EVIDENCE: A SURVEY
What does the empirical evidence say about whether success in big-time college athletics stimulates additional applications and alumni giving? Different authors have attempted to answer these questions in a variety of ways. I discuss first the studies that examine the how a school’s athletic success affects the size of its applicant pool.
Does Athletic Success Increase Applications?
Success in big-time college athletics may influence applications for admission in at least two ways. One is that many prospective students are sports fans, some of whom may decide where to apply in part on the basis of their assessments of which institutions are most likely to play host to exciting athletic contests. A second influence is the broader effect of university name recognition. The names of institutions with successful big-time athletic programs appear frequently in the media, making them generally more familiar to prospective students. On this view, a big-time athletic program serves much like a national advertising campaign.
Other factors held constant, if students are indeed more likely to apply to an institution with a successful athletic program, one observable consequence should be that such schools will be more selective than others on such measures as the average SAT scores of entering freshmen. How does this hypothesis fare empirically?
In a widely-cited 1987 study, Robert McCormick and Maurice Tinsley collected data on approximately 150 schools for 1971, 63 of which they identified as having big-time athletic programs. They estimated a multiple regression model in which the average SAT score of an institution’s entering freshmen in any given year depended on a variety of academic control variables and on whether it was a participant in big-time college athletics. The control variables included the number of volumes in the school’s library, the average salary of its faculty, as well as its student-faculty ratio, endowment per student, tuition, enrollment, age, and whether it was public or private. On the basis of various permutations of this basic model, McCormick and Tinsley estimated that a school with a big-time athletic program could expect an entering freshman class with an average SAT score roughly 33 points—or 3 percent—higher than if it did not have a big-time athletic program.
A difficulty with this type of analysis is that it is impossible to gather data on all the various causal factors that might shape an outcome like an institution’s average SAT scores. If schools with big-time athletic programs are different in other ways that prospective applicants find appealing, the regression model will wrongfully attribute the influence of the omitted factors to athletic programs.
In an attempt to control for this difficulty, McCormick and Tinsley employ a second strategy in which they examine the link between changes in average SAT scores and changes in athletic success. Focusing exclusively on schools with big-time athletic programs, their measure of an institution’s athletic success is the trend in its won-lost percentage between 1971 and 1984. Their dependent variable was the change in entering freshmen SAT scores between 1981 and 1984. In various permutations of their model, they found positive estimates of the effect of athletic success trends on change in SAT scores. But in each case the effects were extremely small, and none of their estimates was statistically significantly different from zero at conventional confidence levels.
In a 1993 paper, Irvin Tucker and Louis Amato examine the relationship between a school’s athletic success and the size of its applicant pool by utilizing a different performance measure from one used by McCormick and Tinsley. They measure football success, for example, by assigning points based on the Associated Press’s end-of-season top-20 rankings, and they construct a similar measure for basketball success. Using these measures, football success, but not basketball success, was positively and statistically significantly associated with increases in SAT scores between 1980 and 1989. But here, too, the effect was small. A school whose football program finished in the top twenty for each of the 10 years in the sample would expect to attract a freshman class with 3 percent higher SAT scores than a school whose program never finished in the top 20.
Working with data for the same set of institutions belonging to major college football conferences, Robert Murphy and Gregory Trandel (1994) utilize still another measure of football success—namely, the within-conference won-lost percentage (as opposed to the overall won-lost percentage utilized by McCormick and Tinsley). By constructing a 10-year panel from 1978-1987, they were also able to estimate separate intercept coefficients for each institution, a more reliable way of controlling for unobserved differences among institutions. Murphy and Trandel find that improvements in within-conference won–lost percentages are positively associated with the number of applications received, although the size of the effect is again small. For example, a school that posts a 50 percent increase in its percentage of games won (by moving from, say, winning half of its games to winning 75 percent of them) would on average see its number of applicants rise by only 1.3 percent. The effect they estimate is thus even smaller than the ones estimated by McCormick and Tinsley and by Tucker and Amato.
Although Tucker and Amato found that an institution’s basketball success had no effect on its students’ SAT scores, Franklin Mixon (1995) argues to the contrary on the basis of study in which he employs a different measure of success—the number of rounds through which the school’s team advanced in the NCAA tournament in the spring before applications are filed the next fall. This measure is positively and statistically significantly associated with average SAT scores of the relevant entering class.20 The effect, however, is extremely small. By the largest of Mixon’s three published estimates, advancing an additional round in the NCAA tournament results in a 1.7 point increase in the entering class’s average SAT score.
An alternative to the statistical regression approach to studying causal relationships is the event study, which focus on the experiences surrounding conspicuous examples of changes in a causal factor. For present purposes, the most spectacular such change is winning a national championship trophy in one of the two biggest sports, football and basketball. If athletic success matters, then a school should receive significantly more applications in the wake of a championship season than in the years preceding it.
In a 1996 paper, Douglas Toma and Michael Cross examined records for the 13 different institutions that won the NCAA Division I-A national football championship between 1979 and 199221 and the 11 different institutions that won the NCAA men’s basketball tournament during those same years. For each institution with a championship, they tracked the quantity and quality of undergraduate applications for the five years before and after the championship season.
Toma and Cross report that two football championship seasons in particular were followed by large increases in applications. Applications to the University of Miami increased by 33 percent for the three years following the school’s national title in 1987; and when Georgia Tech shared the national title in 1990, its applications rose by 21 percent over the following three years. Five other football championship seasons were followed by applications increases of between 10 and 20 percent, and the remaining championship seasons were followed by “only modest gains.” Two schools—Alabama in 1979 and Miami in 1993—actually saw applications drop by roughly 5 percent in the three years following a championship season. Toma and Cross report a similar pattern of findings in the wake of championship seasons in basketball. Ten of the 13 schools that won the NCAA Basketball Tournament between 1979 and 1993 experienced increases in applications.
In an attempt to control for other factors that might have influenced changes in applications, Toma and Cross matched each of the championship institutions in both sports with a small number of similar peer institutions. The results of this adjustment varied considerably across institutions, but in general tended to attenuate their estimates of the gains in applications attributable to winning a championship.
Given the enormous visibility of winning a national title in football and basketball, it is perhaps not surprising that significant increases in applications followed in the wake of championship seasons in at least some schools. Much less expected, however, is that Toma and Cross were unable to find any measurable impact of these increases on the quality of admitted or entering students. Perhaps the institutions experiencing increased applications found opportunities to increase their selectivity in ways not reflected in SAT scores, grades, and other student quality measures. Or perhaps, as Toma and Cross speculate, a school’s national championship visibility may have “more impact on the search phase, and less on the choice phase, of student college choice.”22 If their conjecture is accurate, it suggests the intriguing possibility that an institution’s athletic success might actually reduce its admissions yield, thereby reducing its position in the US News rankings.
Perhaps the most careful study to date of the relationship between athletic success and various other outcomes was published as a 2003 interim report by the consulting firm Sebago Associates under a commission from the National Collegiate Athletics Association. In this report, authors Robert Litan, Jonathan Orszag, and Peter Orszag present statistical analyses based on a new database they compiled from information collected as part of the Equity in Athletics Disclosure Act, which was then merged with data from other sources, including proprietary NCAA data and the authors’ own survey of chief financial officers from 17 Division I schools. Because of gaps in data from the various sources, the resulting data set spans only the years from 1993 to 2001. Even so, this study rests on by far the most comprehensive data set used in any of the studies on college athletics published to date. Using fixed-effects models to control for unobserved institutional characteristics, Litan et al. estimate that football winning percentage is positively associated with average incoming SAT scores, but that the effect is small and not significantly different from zero at conventional confidence levels.
How are we to interpret the disparate findings in the empirical literature on athletic success and applications? Before turning to this question, I discuss the studies that focus on athletic success and alumni giving, for these studies are also difficult to interpret, and for essentially similar reasons.
ATHLETIC SUCCESS AND ALUMNI GIVING
With the publication of their 1979 paper, Lee Siegelman and Robert Carter launched an intense debate, much of it carried out in Social Science Quarterly, about whether success in big-time college athletics stimulates alumni to donate more to their alma maters than they otherwise would have. The same technical issues that arose in the debate about athletic success and SAT scores surface in this debate as well. Focusing on Division I schools, Siegelman and Carter performed separate regressions to estimate how an institution’s football winning percentage affected alumni donations to its annual fund for each year in a multiyear sample. Their conclusion was that such donations are essentially independent of football success.
In a follow-up study, George Brooker and T.D. Klastorin (1981) raise the familiar objection that the Siegelman and Carter study is compromised by its implicit assumption that, apart from athletic success, institutions in Division I are alike in all other important respects that influence alumni giving. In an attempt to control for institutional heterogeneity, Brooker and Klastorin estimate separate coefficients for universities in different university groupings over a multiyear sample. They find positive links between alumni giving and some measures of athletic success for some university groups and negative links for others. Unfortunately, they report only the signs of their estimated coefficients, not their numerical magnitudes, making it impossible to assess whether the links they find are economically significant.
In a 1983 paper, Siegelman and Samuel Brookheimer take even further steps to control for institutional heterogeneity by conducting a full panel study with separate fixed effects for each school. They also break alumni donations down into two components, restricted gifts made directly to the athletic department and unrestricted gifts to the annual fund. They report that the two types of giving are essentially uncorrelated with each other, and that only direct gifts to the athletic department depend in any way on athletic success, and those only on football success, not basketball success. By their estimates, a ten-percent increase in football winning percentage sustained over a four-year period would increase donations to the athletic program by more than $125,000 in 1983 dollars.
Unlike most other authors, who focus on a large sample of different institutions, Paul Grimes and George Chressanthis (1994) attempt to estimate the link between athletic success and alumni giving by confining their attention to a single school, Mississippi State University, during the 30-year period between 1962 and 1991. Grimes and Chressanthis also depart from tradition by studying the effects of athletic success not just in football and basketball, but also in baseball. They find that winning percentage in football is actually negatively associated with alumni giving, although not statistically significantly so. Basketball winning percentage has a positive estimated coefficient, but again one that is not statistically significant at conventional levels. Only baseball winning percentage is statistically significantly linked to alumni giving. But the estimated effect is extremely small. Their estimates of the effect of postseason appearances are statistically insignificant for all three sports, and actually negative for basketball.
Grimes and Chressanthis also examine one other factor ignored by the other studies just described—namely, the effect on giving of being sanctioned by the NCAA for rules violations. Being placed on NCAA probation is a nonnegligible risk for institutions seriously attempting to field winning programs, since these institutions are often forced by competition to operate close to the margins of allowable conduct. The authors estimate, for example, that a year’s sanction for a rules violation in football would cost MSU more than $1.6 million in lost donations in 1982 dollars.
In a 1996 paper, Robert Baade and Jeffrey Sundberg constructed separate data sets for public universities, private universities, and liberal arts colleges to examine the factors that governed alumni giving during the period from 1973 to 1979. They also refined previous measures of athletic success by looking not only at won-lost percentages but also bowl game appearances. They concluded that although winning records do not translate into higher gifts at public and private universities, bowl game appearances do result in significantly higher gifts (an estimated average gift increment of $40 per year per alumnus at private universities, $6.50 per year per alumnus at public universities). They also found that NCAA basketball tournament appearances result in higher gifts at public universities (an annual increment of $5.60 per alumnus). At liberal arts colleges, which do not normally appear in postseason bowls, they found a “statistically significant, but very small, correlation between winning percentage and alumni giving.”
In a 2000 paper, Thomas Rhoads and Shelby Gerking provide a useful illustration of the extent to which unobserved institutional heterogeneity can bias estimates in studies that fail to control for it. Focusing on much the same sample of Division I schools studied by Baade and Sundberg, Rhoads and Gerking examine the relationship between athletic success and giving for the period from 1986–87 to 1995–96. Using a standard OLS regression model without fixed effects as a baseline, they estimate that football bowl wins and NCAA basketball tournament wins have positive and statistically significant effects on both total giving and giving by alumni. These effects are about the same magnitude as those estimated by Baade and Sundberg. But when Rhoads and Gerking then run essentially the same model with fixed effects for each institution, they find that none of the athletic success variables has a coefficient that is statistically different from zero. Rhoads and Gerking also estimate that being placed on NCAA probation for a basketball violation reduces total giving by $1.6 million in 1987 dollars.
The 2003 NCAA-commissioned study by Litan et al. also examines the relationship between football success and both total alumni giving and alumni giving to football programs. As noted earlier, Litan and his co-authors have assembled perhaps the most comprehensive database employed in any of the studies described in this review. Using carefully specified fixed-effects models to control for institutional heterogeneity, they report that both football winning percentage and lagged football winning percentage are negatively linked with both total alumni giving and alumni donations to football programs. None of these estimates, however, is statistically significant at conventional levels. Litan et al. also fail to find statistically significant links between football spending or lagged football spending on either form of alumni giving.
Several other studies I will not describe in detail here also look for possible links between athletic success and alumni giving. Some (for example, Coughlin and Erekson, 1984, and Goff, 2000) report positive links. Others (for example, Frey, 1985, and Grace, 1988) do not. Still others (for example, Turner, Meserve, and Bowen, 2001) even suggest that athletic success may diminish the amount that donors contribute for general purposes.
WHAT ARE THE POLICY IMPLICATIONS OF THE EMPIRICAL LITERATURE?
As many of the authors of the studies discussed above would be quick to concede, the limitations of existing data and methods of statistical inference make it exceedingly difficult to reach definitive general conclusions about the strength, or indeed even the existence, of the causal relationships in question. Perhaps the only firm conclusion that can be drawn from a review of the empirical literature on the indirect effects of athletic success is that each of the competing claims regarding these relationships is likely to be true under at least some circumstances.
Certainly there are instances in which the presence of a specific causal link appears compelling, as when Boston College experienced a 12-percent increase in applications during the year following its football team’s dramatic come-from-behind victory over Miami in 1984. [See note below.] Replays of Doug Flutie’s 48-yard touchdown pass to Gerard Phelan as time expired were broadcast so frequently over the ensuing months that the drama of this story could hardly have escaped the attention of even a single American high-school sports fan. Such vivid episodes notwithstanding, the existing empirical literature suggests that success in big-time athletics has little, if any, systematic effect on the quality of incoming freshmen an institution is able to attract (as measured by average SAT scores).
By the same token, precious little can be said with confidence about the relationship between alumni giving and successful performance in big-time college athletics. That there are many wealthy donors who care deeply about the athletic success of their alma maters cannot be questioned. Nor is there any doubt that the good will generated by a successful athletic program prompts many of these people to donate more generously. Yet all major college athletics programs go through cycles of relative success and relative failure. And if success stimulates alumni giving, then failure must inhibit it. The empirical literature seems to say that if the overall net effect of athletic success on alumni giving is positive, it is likely to be small.
As the psychologist Tom Gilovich has suggested, someone who wants to believe a proposition tends to ask, “Can I believe it?” In contrast, someone who wants to deny its truth tends to ask, “Must I believe it?”23 With such a variety of claims and findings in the empirical literature, we must expect individual differences in motivation to explain a substantial share of the variance in beliefs about the links between athletic success and other outcomes. Important players in the debate about college athletic spending are thus likely to cling to conflicting beliefs about the facts.
Under the circumstances, it is all the more important that our thinking about the effects of spending on athletic programs be informed by a clear understanding of the economic forces that govern behavior in big-time college athletic markets. Fortunately, what we know about how such markets function suggests that the answers to many important policy questions may not hinge strongly on the strength of the empirical relationships just examined.
Policy questions arise at two distinct levels in the athletic arena. First, individual institutions must decide whether, and, if so, how much, to invest in pursuit of big-time athletic success. And second, governing bodies, both public and private, must decide whether, and if so, how, to regulate the behavior of individual athletic programs.
Consider first the individual institution’s investment decision. How would this decision be affected by its beliefs about whether successful athletic programs stimulate additional applications or greater alumni giving? What we know from the structure of competition in winner-take-all markets with free entry is that if the reward from successful performance increases, more contestants will compete and each will invest more heavily in performance enhancement. If prospective contestants tend toward optimism in assessing their odds of success (as we saw earlier, a near universal tendency in other domains), or if contestants become involved in expenditure arms races (as we saw in the bidding war among contestants in Shubik’s entrapment game), the clear expectation is that participation in big-time college athletics will be a losing proposition for all but a handful of institutions. That is, once participants respond to an increase in the reward for successful performance, market forces all but assure that participation in big-time college athletics will again be financially unremunerative for most institutions. Indeed, with higher stakes, the expected financial losses are likely to be even larger than before. In Shubik’s entrapment game, for example, bidders’ losses are roughly proportional to the denomination of the bill being auctioned.
The same logic holds, irrespective of the size of the indirect effects of athletic success. So from the individual institution’s perspective, even if an academic study were to establish with certainty that athletic success stimulates large increases in, say, alumni giving, this would not constitute an argument for increased investment. Competition among institutions to capture those gains would have already eliminated any unexploited opportunities for gain that might initially have been available. Conversely, discovering the link between success and alumni giving to be weak would provide no additional reason to curtail investment, since the weakness of that link would already be reflected in the current market equilibrium. Rational investment decisions are forward looking, and in either case, once the market has reached equilibrium, the expected return to additional investment is likely to be negative.
Similar conclusions apply to the relationship between an institution’s athletic success and the size of its applicant pool. Here, too, if the link were known to be strong and positive, more contestants would enter the arena and each would invest more intensely in performance enhancement. A big-time athletic program might be a cost-effective means of expanding the applicant pool if a highly visible winning program could be launched at moderate expense. But as we have seen, even the cost of fielding a losing program is extremely high and growing rapidly. If expanding its applicant pool is an institution’s goal, it faces many more attractive investment opportunities than those it confronts in the domain of big-time college athletics.
If investment in big-time college athletics is unlikely to yield high returns from the perspective of any given institution, it is an even less attractive proposition from the perspective of institutions as a whole. The distinction between the two perspectives is precisely analogous to the distinction we see in the entrapment game. From the perspective of any individual bidding to win the $20 bill, boosting one’s bid beyond that of the current high bidder entails at least the possibility of a favorable outcome. From the perspective of bidders as a group, however, additional bidding serves only to guarantee a smaller overall return than before. It is the same in college athletics. No matter how many hundreds of millions of dollars institutions spend, only 20 teams will finish in the AP’s top 20 in football each year, and only four teams will reach the final four in the NCAA basketball tournament.
The empirical literature does not rule out the possibility that a given institution’s success in big-time college athletics might attract additional applicants or stimulate greater alumni giving. But even if both of those links were strong and positive at the individual level, they would essentially vanish from the perspective of institutions as a whole. Success, after all, is a purely relative phenomenon. Upward movements in the national rankings for some teams necessarily entail downward movements for other teams. If institutions in the first group attracted more applicants and larger donations as a result, the corresponding movements would be in the opposite direction for the institutions in the second group.
The NCAA and other athletic governing bodies have long since recognized the distinction between the incentives facing individual institutions and those facing institutions as a group. When, as in college athletics, reward depends on rank, institutions face powerful incentives to engage in costly “positional arms races.”24 The incentive to spend more may seem compelling from the perspective of each institution, even though each realizes that when all spend more, the competitive balance will be unaffected. The familiar stadium metaphor captures the essential idea: Each spectator stands to get a better view, but when all stand nobody sees any better than if all had remained seated.
Under these circumstances, individual institutions can often achieve better outcomes by empowering a larger governing body to restrict their own behavior. Such “positional arms control agreements” are found in virtually every domain in which the rewards of individuals depend strongly on rank.25 Even when the stakes in athletic competition are relatively modest, as in the Ivy League, governing bodies typically restrict their members’ ability to compete freely.
As in the case of military arms control agreements, however, positional arms control agreements in athletics are often hard to enforce. Sometimes the problem is that the governing body’s jurisdiction is too narrow. A case in point was the Ivy League’s decision to abandon a rule that prevented its members from holding football practice in the spring. The rationale for the rule was that if any one institution held practice in the spring, others would be forced to follow suit. Student-athletes would lose time from their studies, yet the competitive advantage each team sought to achieve would vanish in the end. Half of all teams would still lose on any given fall Saturday, and half would win. The difficulty was that Ivy League football schedules included not just opponents from within the league but also from outside it. At the time, Ivy League teams were losing consistently to rivals from the Colonial League, which allowed spring football practice. The ban was finally lifted in response to complaints from angry alumni.
A second problem is that positional arms control agreements are often mistaken by the antitrust authorities as unlawful cartel behavior. Many elite institutions, for example, were once party to an agreement whereby they pledged to target limited financial aid money for those students with the greatest financial needs. This was essentially a positional arms control agreement to curb competition among member institutions for students with elite credentials. Animated by its belief that unbridled competition always and everywhere leads to the best outcome, the Justice Department took a dim view of this agreement. And it brought an antitrust suit that led to its termination.
Once we appreciate the logic of the financial incentives that confront participants in winner-take-all markets, however, we may feel less inclined to embrace the mantra that all outcomes of open competition must be good. The problem, as noted, is that when reward depends on rank, behavior that looks attractive to each individual often looks profoundly unattractive from the perspective of the group. Collusive agreements to restrain these behaviors can create gains for everyone. Of course, cooperative agreements to limit competition can also cause harm, as in the notorious price-fixing cases of antitrust lore.
The challenge, of course, is to make informed distinctions. Antitrust authorities might consider a retreat from their uncritical belief that unlimited competition necessarily leads to the greatest good for all. Manifestly it does not. Collective agreements should be scrutinized not on quasi-religious grounds, but according to the practical test of whether they limit harmful effects of competition without compromising its many benign effects. The collective agreement among universities to concentrate financial aid on families with the greatest financial need was a positional arms control agreement that clearly met this test.
Because the reward structure in college athletics is so strongly rank dependent, the design and implementation of positional arms control agreements are by far the most important policy decisions that athletics governing bodies such as the NCAA must confront. And these decisions would take essentially the same form irrespective of the strength of the individual links between athletic success, on the one hand, and indirect benefits, such as larger applicant pools and greater alumni giving, on the other. A review of the empirical literature suggests that these indirect benefits constitute at most only a small fraction of the total revenue stream generated by big-time college athletic programs. If those indirect benefits were found either not to exist at all, or else to be larger than existing studies suggest, participating institutions would still find themselves embroiled in a positional arms race with very high stakes.
CONCLUDING REMARKS
To observe that the reward structure in big-time college athletics gives rise to costly positional arms races is in no way to deny that athletic programs generate numerous real benefits to the institutions that sponsor them. As a report recently commissioned by the athletics subcommittee of the board of trustees at Rice University noted, for example,
Athletic competitions serve as focal points to which diverse constituencies of the University, who might otherwise never share a common experience, can relate…. Athletics also helps achieve the diversity goals of the school—athletes often bring a completely different set of social, ethnic, economic, and experiential backgrounds to the University. Finally, NCAA athletics provide a phenomenal training ground for participants, with valuable instruction in teamwork, leadership, discipline, and goal setting.26
For policy purposes at the collective level, however, the important point is that each and every one of these benefits would occur with equal measure if every institution were to reduce its expenditures on big-time college athletics by half. Any institution that made such a cutback unilaterally would substantially increase its risk of fielding consistently losing teams. But if all institutions cut back in tandem, competitive balance would be maintained.
Policies that curtail positional arms races promise large benefits for participating institutions at little or no cost to the spectators who consume big-time college athletics. For these consumers, it is much less the absolute performance of teams that matters than the fact of there being spirited contests. (If absolute performance were of primary concern to spectators, they would have long since deserted college athletic contests in favor of their professional counterparts.) So if governing bodies such as the NCAA were able (or were permitted by the antitrust authorities) to create incentives for each program to limit its expenditures, resources can be diverted to meet other pressing ends without sacrificing any of the real benefits that college athletic programs generate.
The most forceful conclusion that can be drawn about the indirect effects of athletic success is that they are small at best when viewed from the perspective of any individual institution. Alumni donations and applications for admission sometimes rise in the wake of conspicuously successful seasons at a small number of institutions, but such increases are likely to be both small and transitory. More to the point, the empirical literature provides not a shred of evidence to suggest that an across-the-board cutback in spending on athletics would reduce either donations by alumni or applications by prospective students.
References
Henning, Lynn. “Martin Charting New Course at U-M,” The Detroit News, February 4, 2004: www.detnews.com/2001/um/0102/05/d01-183919.htm.
Lowitt, Bruce. “Flutie’s ‘Hail Mary’ Shocks Hurricanes,” St. Petersburg Times, October 20, 1999: http://www.sptimes.com/News/102099/Sports/Flutie_s__Hail_Mary__.shtml.
Litan, Robert E., Jonathan M. Orszag, and Peter R. Orszag. “The Empirical Effects of College Athletics: An Interim Report,” Commissioned by the NCAA, August 2003.
McCormick, R., and M. Tinsley. “Athletics versus Academics? Evidence from SAT Scores,” Journal of Political Economy, volume 95, 1987: 1103–1116.
Mixon, Franklin G. “Athletics versus Academics? Rejoining the Evidence from SAT Scores,” Education Economics, December 1995, volume 3: 277–304.
Mixon, Franklin G., and Hsing, Yu. “College Student Migration and Human Capital Theory: A Research Note,” Education Economics, 1994, volume 2: 65–74.
Mixon, Franklin G., and Rand W. Ressler. “An Empirical Note on the Impact of College Athletics on Tuition Revenues,” Applied Economics Letters, October 1995, volume 2, number 10: 383–87.
Murphy, Robert G., and Gregory A. Trandel. “The Relation between a University’s Football Record and the Size of Its Applicant Pool,” Economics of Education Review, 1994, volume 13: 265–70.
Rhoads, Thomas A. and Shelby Gerking. “Educational Contributions, Academic Quality, and Athletic Success,” Contemporary Economic Policy, April, 2000, volume 18, issue 2: p. 248 ff.
Sigelman, L., and R. Carter. “Win One for the Giver? Alumni Giving and Big-Time College Sports,” Social Science Quarterly, 1979, volume 60, issue 2: 284–294.
Sigelman, L., and S. Bookheimer. “Is It Whether You Win or Lose? Monetary Contributions to Big-Time College Athletic Programs,” Social Science Quarterly, 1983, volume 64, issue 2: 347–359.
Smith, Adam. An Inquiry Into the Nature and Causes of the Wealth of Nations (1776), http://www.online-literature.com/adam_smith/wealth_nations/.
Svenson, O. “Are We All Less Risky and More Skillful Than Our Fellow Drivers?” Acta Psychologica, 47, 1981: 143–48.
Sylwester, Mary Jo and Thomas Witoski. “Athletic Spending Grows as Academic Funds Dry Up,” USA Today, February 18, 2004. http://www.usatoday.com/sports/college/2004-02-18-athletic-spending-cover_x.htm.
Tiger, Lionel. Optimism, New York: Simon & Shuster, 1979.
Toma, J. Douglas and Michael Cross. “Intercollegiate Athletics and Student
College Choice: Understanding the Impact of Championship Seasons on the Quantity and Quality of Undergraduate Applicants.” ASHE Annual Meeting Paper. 1996. http://www.edrs.com.
Tucker, Irvin, and Louis Amato. “Does Big-Time Success in Football or Basketball Affect SAT Scores,” Economics of Education Review, 1993, volume 12: 177–181.
Turner, S., L. Meserve, and W. Bowen. “Winning and Giving: A Study of the Responsiveness of Giving At Selective Private Colleges and Universities,” Social Science Quarterly, December 2001, volume 82, issue 4: 812–826.
Tversky, Amos and Daniel Kahneman. “Judgment Under Uncertainty: Heuristics and Biases,” Science, 185, 1974: 1124–1131.
Weinstein, N. D. “Unrealistic Optimism about Future Life Events,” Journal of Personality and Social Psychology, 39, 1980: 806–820.
Weinstein, N. D. “Unrealistic Optimism about Susceptibility to Health Problems,” Journal of Behavioral Medicine, 5, 1982: 441–60.
Weinstein, N. D. and E. Lachrendo. “Egocentrism and Unrealistic Optimism About the Future,” Personality and Social Psychology Bulletin, 8, 1982: 195–200.
Wylie, R. C. The Self-Concept, Vol. 2, Lincoln, NE: University of Nebraska Press, 1979.
Young, Steve. Statement On the issue of Fundamental Fairness and the Bowl Championship Series (BCS) Before the House Judiciary Committee September 4, 2003. http://www.house.gov/judiciary/young090403.htm.
Notes
1. Henning, 2004.
2. Sylwester and Witosky, 2004. These figures, which omit capital expenditures, are likely to substantially understate the overall rate of athletic spending growth.
3. Young, 2003.
4. Sylwester and Witosky, op. cit.
….
6. Smith, 1776, Book I, Chapter 10, part I.
….
14. Gilovich, 1991, p. 77.
15. The anthropologist Lionel Tiger, for example, takes this approach in his 1979 book. See also Gilovich, 1991, chapter 5.
….
17. Tversky and Kahneman, 1974.
18. USAToday, op. cit.
….
20. In papers with different co-authors (Mixon and Ressler, 1994; and Mixon and Hsing, 1995), Mixon argues that athletic success stimulates additional applications primarily from out-of-state residents who are shopping, in effect, for pleasurable consumption experiences.
21. Toma and Cross define a national football championship as a first-place finish in either the AP poll or the CNN/USA Today poll.
22. 1996, p. 21.
23. Cite.
24. See Frank, 1992.
25. Again, see Frank, 1992.
….