
14
Multimodality Imaging with MR/PET and MR/SPECT
Troy H. Farncombe
CONTENTS
14.1 Multimodality Imaging Systems
14.1.1 Radionuclide Transmission Imaging
14.1.2 CT-Based Co-Registration
14.1.5 CT Attenuation Correction
14.1.6 Clinical Applications of PET/CT and SPECT/CT
14.1.7 Problems with CT-Based Co-Registration
14.1.8 Requirements for PET/MR and SPECT/MR
14.2 Basics of Pet and SPECT Imaging
14.2.1 Scintillation Detectors
14.2.3 Acquisition Electronics
14.4 Alternative MR Configurations
14.5 Alternative Radiation Detectors
14.5.1 Scintillation Detectors
14.5.3.1 Avalanche Photodiodes
14.5.3.2 Multi-Pixel Geiger-Mode Avalanche Photodiodes
14.5.4.1 Si(Li) and Ge(Li) Detectors
14.5.4.2 CdTe and CdZnTe Detectors
14.1 Multimodality Imaging Systems
Since its inception, nuclear medicine imaging has always been known as a functional imaging technique rather than an anatomical imaging method. Three-dimensional images obtained from SPECT or PET devices depict the accumulation of radiopharmaceutical by specific cells, thus representing cellular function (see Figure 14.1a). As a result, these images lack the spatial information and instant recognition of other medical imaging techniques such as x-ray CT or MRI. The underlying information conveyed to an educated reader, however, is substantial as the distribution of radiopharmaceu-tical within the body provides physiological information about the body rather than strictly anatomical information. Nuclear medicine images often provide an early glimpse into disease progression as physiological changes occur prior to structural changes appearing. Even so, nuclear medicine has long been described as “unclear” medicine due to the fact that images typically lack any readily identifiable landmark information such as bones or lungs. In fact, an ideal nuclear medicine should contain no anatomical information whatsoever but rather depict the highly specific uptake of radio-tracer in certain cell types. Admittedly, the lack of structural information may introduce some difficulties in localizing disease or framing the extent of disease. In order to provide some measure of anatomical structure and to correlate the radiopharmaceutical distribution with anatomy, numerous methods have been used.

FIGURE 14.1
Typical whole-body PET scan showing the distribution of 18FDG (a). A radionuclide transmission scan using Cs-137 (b). Note the absence of contrast between soft tissues.
14.1.1 Radionuclide Transmission Imaging
Among the first methods used to obtain anatomical information along with functional information was through the use of radionuclide transmission measurements [1–4]. This type of acquisition places a radioactive source opposite the detector and rotates it around the body with the radiation detector measuring the resultant transmitted radiation. By also measuring a blank transmission scan (i.e., no patient) and using the relation
![]()
it is possible to reconstruct the 3D distribution of linear attenuation coefficients in the patient. Because the detectors operate in photon-counting mode rather than in current mode, images produced using transmission-based imaging suffer from poor spatial resolution and poor tissue contrast due to the low number of detected photons. In essence, images made using radionuclide transmission can distinguish soft tissue from air but little else (see Figure 14.1b). This is reasonably acceptable in order to perform attenuation compensation but generally is not of much value for accurately localizing disease.
The shortcomings of radionuclide transmission-based imaging have led to it being relegated to perform attenuation correction only. In fact, until the early 2000s, most PET scanners still utilized a Ge-68 or Cs-137 source for attenuation correction and even now, several SPECT machines offer radionuclide transmission sources (typically Gd-153) for attenuation correction.
14.1.2 CT-based Co-Registration
Because of the limitations of radionuclide transmission imaging, many investigators turned to combining x-ray CT images with nuclear medicine PET or SPECT images [5,6]. Typically, PET or SPECT imaging would be performed on one system followed by CT imaging on another system, often in a different physical location. Care has to be taken to image the patient in the same orientation on both systems and often external fiducial markers are used in to aid in the co-registration process. Once acquired, PET or SPECT images would be matched to CT images by shifting the radionuclide images in three dimensions until they align with the CT. Image co-registration such as this often requires substantial operator interaction and a keen eye as image alignment is usually subjective.
In the late 1990s, the value of incorporating a high-resolution x-ray CT into a PET gantry was realized and the first PET/CT imaging system was developed [7,8]. By colocating the PET and CT in the same room and sharing a common patient bed, it became possible to obtain accurately co-registered PET and CT images in much reduced time. The benefits of PET/CT soon became apparent [9] and combined PET/CT was commercialized in the early 2000s. Sales of PET/CT have increased to the point where currently no major equipment manufacturer offers a PET-only device for routine clinical imaging. Similarly, SPECT/CT devices were soon developed and are now available commercially through all major vendors [10] are now available commercially through all major vendors.
14.1.3 Image Co-Registration
When performing radionuclide (PET or SPECT) and anatomical imaging (CT or MRI) with different physical systems, the accuracy of co-registration becomes paramount. In the simplest case, it is assumed that the patient can be represented as a rigid body and is free to move about only 6 degrees of freedom from one scan to the next. Thus, a given coordinate in one scan corresponds a transformed coordinate in the other scan via the transformation

where θ, ϕ, ξ and Δx, Δy, Δz represent rotation and translations, respectively, about the three orthogonal axes.
Often in rigid-body transformations, it is up to the user to manipulate the transformation parameters in order to arrive at a suitably co-registered image. However, as this is a subjective assessment and dependent upon user interactions, it is often not reproducible from user to user. As a result, a number of methods [11] have been used to quantify the degree of co-registration, principal among them is the use of mutual information [12,13].
14.1.4 Image Display
Once anatomical (MR or CT) and functional (PET or SPECT) information has been gathered and co-registered, it must be presented to the interpreting physician in the most clear and concise manner possible. Often, even though images are co-registered, images are viewed separately in split windows. When the interpreter selects a location on either the anatomical or functional image, the viewer is usually shown three orthogonal views centered at the selected location.
As an alternative, it is common to present co-registered images simultaneously in a fused display using alpha blending [14]. In this type of display, each image is shown superimposed on the other but in a different color scale. For example, a PET and CT image can be displayed as a fused image by combining the red, green, and blue color channels of each image appropriately. Given the PET and CT images as 24 bit color images (8 bits in each channel), a fused image can be created with altered RGB color channels through the transformation

where α is given as an opacity value in the range 0–1 controlling to mixing of the two fused images (see Figure 14.2).
14.1.5 CT Attenuation Correction
Along with providing accurate spatial localization when overlaid with PET or SPECT images, co-registered x-ray CT images can also be used to compensate for the attenuation of photons during the PET or SPECT data acquisition process [2,4,8,15]. As x-ray CT is acquired using a polyenergetic spectrum of x-rays, resultant images do not represent a linear attenuation coefficient but rather are represented in Hounsfield units (HU) where air is defined as −1000 HU and water as 0 HU with all other tissue types distributed accordingly along this scale. In order to perform accurate photon attenuation correction, CT images must first be converted into units of linear attenuation (i.e., cm−1) specific to the PET or SPECT isotope energy. Various schemes exist for this [16–19], but in the simplest implementation, CT images are rescaled to linear attenuation coefficients via the expression

FIGURE 14.2
(See color insert.) Alpha blending of PET/CT images shown (from left to right): α = 0 (CT only), α = 0.5 (equal PET and CT), α = 1.0 (PET only).

At low tissue densities, the conversion of CT number to linear attenuation coefficient follows this relation, but for CT numbers greater than soft tissue, this conversion is no longer linear with the same slope but rather becomes

In order to implement this type of conversion, calibrations must first be performed in order to evaluate and for each CT gantry and x-ray tube.
14.1.6 Clinical Applications of PET/CT and SPECT/CT
Probably the most common application of PET/CT imaging is 18F–fluorodeox-yglucose (FDG) imaging for oncology [7]. With standard FDG-PET imaging, the distribution of FDG follows that of glucose metabolism (i.e., areas of high glucose metabolism result in large accumulations of FDG). As many malignant tumors have a high affinity for glucose, it follows that these tumors also would have a high affinity for FDG. Because FDG depicts cellular glucose metabolism, the resulting PET images lack any inherent anatomical information and typically have spatial resolutions on the order of 6–9 mm, thus making it difficult for interpreting physicians to pinpoint the exact location of a malignant tumor with certainty.
The introduction of PET/CT however has been able to change this. By acquiring a CT image of the same area of the body and overlaying the PET and CT on the same spatially co-registered image, it is possible to determine the location of FDG-avid tumors with a high degree of accuracy. In the case of head and neck cancers that typically spread to the neck lymph nodes, PET/CT has made it possible to correlate the uptake of FDG to specific lymph nodes, thus making surgical excision more precise [19,20].
Imaging 111In-labeled white blood cells (WBCs) with SPECT has become an important procedure for determining sites of infection following ortho-pedic replacement surgery or in patients with fever of unknown origin. The immune system recruits leukocytes to fight bacteria at areas of infection and so labeling these cells permits physicians to localize injury. An ideal WBC SPECT image would lack any anatomical information as the distribution of WBCs would be specific only to the site of infection. Thus, the resultant image would depict a diffuse spot of activity with no anatomic context. As a means to provide some additional localization information, it is common to take advantage of the multi-isotope imaging capabilities of SPECT in order to perform simultaneous 99 mTc-MDP bone imaging. The uptake of 99 mTc-MDP is confined to the skeletal system and so provides a rough anatomical context to place the resultant WBC information. While dual-isotope imaging provides some measure of anatomical context, it fails to provide the spatial resolution needed to accurately localize infection. With the introduction of SPECT/CT, anatomical imaging is made much simpler and more precise as WBC distributions can now be correlated exactly with patient morphology [21–25].
Myocardial perfusion imaging with SPECT is one of the most commonly performed procedures in nuclear medicine and used to detect perfusion abnormalities in the heart. The distribution of 99 mTc-labeled compounds such as sestamibi or tetrofosmin is related to the coronary arterial blood supply. As the blood supply to the heart is affected by the diameter of the coronary arteries, any reduction in perfusion is typically the result of a narrowing in the arteries, usually the result of either calcification of the lumen or buildup of atheromatous plaques (atherosclerosis) within the arteries. While useful for determining the extent of perfusion abnormalities, SPECT is incapable of determining the exact site of narrowing. However, with SPECT/CT imaging, it is possible to obtain anatomical information and correlate it with perfusion imaging in order to determine where the perfusion defects originate. As well, CT imaging is able to provide quantitative measures of calcification (calcium scoring) or 3D angiography (CTA) to depict the 3D coronary artery structure. By obtaining complementary information such as this in one single SPECT/CT exam, patients are able to be treated more effectively and in a more timely fashion [26].
14.1.7 Problems with CT-based Co-Registration
While multimodality imaging with x-ray CT has proven itself valuable for a number of applications, it is not immune to problems. Because of the polyen-ergetic nature of x-ray production, a significant amount of low-energy x-rays exist in most spectra. Because of the energy dependence on photon attenuation, low-energy x-rays are preferentially attenuated as they pass through the body. The result is a progressive increase in the average x-ray energy, commonly referred to as beam hardening, the result of which produces, sometimes significant, streaking artifacts in resultant CT images (Figure 14.3). Materials such as Al or Cu are often used to reduce these low-energy x-rays as they pass from the x-ray tube, but usually this filtration does not remove all of this component. Images with beam hardening artifacts may lead to misinterpretation and incorrect attenuation compensation to the nuclear image data.

FIGURE 14.3
Examples of artifacts seen in x-ray CT scans. (a) Image showing streak artifacts resulting from beam hardening through dental fillings. (b) CT image of the thorax showing mild respiratory motion artifact. Note the stair step effect in the dome of the liver at the point of the arrow.
Because of the different time scales of data acquisition involved in nuclear medicine imaging and x-ray CT (minutes vs. seconds), it is possible that physiological processes occurring over short (or long) time scales can also interfere with the imaging method. For example, in the case of lung cancer imaging, FDG-PET scans may be acquired over the course of several minutes, thus motion artifacts as the result of normal tidal breathing essentially get “averaged out” over the course of imaging in order to obtain a single PET image. Contrast this to CT imaging where the entire lung volume may be imaged in a single breath-hold in just a few seconds. Since the PET image represents an average motion, CT and PET images are inherently misregis-tered [27,28], resulting in the possibility of incorrect localization.
While the addition of x-ray CT imaging has had a profound impact on nuclear medicine, there are some applications in which CT is not the optimal imaging modality. Because x-ray CT characterizes materials based on electron density (x-ray attenuation is primarily dependent upon photoelectric effect and Compton scattering), it follows that materials or tissues with similar electron densities may not produce much variation in x-ray attenuation. This is particularly true in imaging areas such as the brain where white and grey matter have very similar properties and cannot typically be distinguished with x-ray imaging.
Because of the shortcomings of x-ray CT imaging, there is interest in alternative approaches to perform anatomical/functional correlative imaging. Magnetic resonance imaging is one technique that is capable of high-resolution anatomical imaging that, at the same time, produces superior soft-tissue contrast compared to x-ray CT. As well, in contrast to x-ray CT that produces high-resolution images of anatomy, MRI is also capable of bridging the gap between anatomical and functional imaging by being capable of performing studies such as brain activation, chemical metabolism, or perfusion. As a result of these advantages, there is increasing interest in combining MR imaging with molecular imaging using PET and/or SPECT.
14.1.8 Requirements for PET/MR and SPECT/MR
MRI machines utilize high-strength magnetic fields and radio-frequency generators to manipulate the magnetic moments of certain atoms. Typical magnetic fields for clinical MRI machines range from 0.1 T (open field) to 4.7 T (fMRI) but with 3 T machines quickly becoming the norm. The high field used in MR requires that any material placed within the MRI field both have negligible effect on the field homogeneity and still operate normally under such a large magnetic field.
The design of most MRI systems also imposes a constraint on the size of the incorporated PET or SPECT device as high-field MRI systems use a cylindrical gantry with a fixed bore size. The ideal PET or SPECT imaging system that would be incorporated into an MRI device would need to have the following characteristics:
Ability to operate in a high magnetic field with negligible effect on imaging performance
Must be made of magnetically compatible materials and produce negligible effect on magnetic field homogeneity
Small and relatively lightweight
Produce image quality comparable to stand-alone systems
As can be expected, the logistics of incorporating PET or SPECT radiation detectors into a typical MR gantry are complex.
14.2 Basics of Pet and SPECT Imaging
In order to investigate the various approaches to combining MR with PET or SPECT, it is first important to describe the basics of radionuclide imaging and the imaging systems.
14.2.1 Scintillation Detectors
Overwhelmingly, scintillation detectors make up the majority of radiation detection methods used for PET or SPECT imaging. Briefly, these detectors usually consist of inorganic crystalline material that fluoresces in the presence of ionizing radiation. As many materials scintillate when exposed to ionizing radiation, the appropriate scintillator material must be selected for the chosen application. For example, in PET imaging, the requirement of the scintillator is to stop 511 keV photons and to distinguish two detections based on very short time scales. Thus, PET scintillators must have high stopping power (effectively a high density) and a very fast response time (i.e., short fluorescence time) [29]. Since most imaging used in SPECT utilizes lower-energy radionuclides, stopping power is less of a concern, but the ability to distinguish different photon energies is important. Thus, scintillators with high light output and good energy resolution are important. In the case of combined MR/PET or MR/SPECT, an appropriate scintillator must be chosen that meets the earlier mentioned criteria but is also compatible with the high magnetic field present in MR [30]. Table 14.1 presents some of the properties of the most common scintillators used in PET and SPECT imaging. As expected, the gadolinium-based scintillators, GSO and LGSO, have a very high magnetic susceptibility, thus making them unsuitable for PET/MR or SPECT/MR [30].
Regardless of the material used, any scintillator used for radionuclide imaging must be capable of absorbing the high-energy gamma rays originating from the radioactive decay and converting this energy into optical photons. When a high-energy gamma ray is incident upon a scintillator, three different interaction types are possible: photoelectric absorption, Compton scattering, or pair production. In typical nuclear medicine imaging, only the first two effects are relevant as pair production requires incoming gamma ray energies in excess of 1.022 MeV.
In the photoelectric effect, high-energy gamma rays interact with inner shell electrons of the scintillator. As the energy of the high-energy gamma ray is higher than the binding energy of the electron, an electron will be ejected from the atom with a kinetic energy equal to the difference between the original gamma ray energy and the binding energy. In the Compton effect, the incoming gamma ray is initially absorbed by the scintillator atom, thus producing an electron ionization but also emitting a secondary photon. The energy of the ejected electron and the secondary photon is equal to the original gamma ray. The secondary photon is then free to interact via additional photoelectric or Compton interactions. In both cases, the ionization electrons that are produced give rise to the fluorescent properties of scintillators.
TABLE 14.1
Properties of Some Common Scintillators Used in Nuclear Medicine Imaging Equipment

Source: Lecomte, R., Eur. J. Nucl. Med. Mol. Imaging, 36, suppl. 1, S69, 2009.
14.2.2 Photodetectors
In order for the radiation to be detected, the light produced in the scintillator material must be detected by a photodetector and converted to a measurable electrical signal. Various approaches exist for this conversion, but the most common is through the use of the photomultiplier tube, or PMT.
Essentially, a PMT consists of an evacuated glass housing with numerous components inside it. These components consist of (1) photocathode, (2) multiplying region, and (3) collector. The photocathode is on the front surface of the PM tube and is responsible for the conversion of incident light into electrons. This conversion takes place via the transfer of energy from the incoming photon to the material electrons. For most photocathode materials, this requires approximately 2–4 eV of energy for each liberation. Once liberated, these electrons must now transit the photocathode material, be emitted from the photocathode, and be accelerated to the first detection stage. In order to be emitted, the electrons require at least enough kinetic energy to escape the potential barrier holding the electrons to the material (i.e., the work function, typically a few eV) [31].
As a result of the energy required to liberate electrons (the work function), most photomultipliers are more sensitive to higher-energy light photons (i.e., shorter wavelengths) and in fact are optimal for scintillators like NaI(Tl) or Lutetium Oxyorthosilicate (LSO) that scintillate in the blue/green region of the visible light spectrum. After the electron is liberated, it must travel to the cathode surface in order to be ejected. Typically, electrons will only travel a very short distance (several nm) before being reabsorbed so it is imperative that the photocathode be kept as thin as possible. However, in keeping the cathode thin, it becomes less efficient in absorbing the photons from the scintillator in the first place. The efficiency in converting scintillation light to photoelectrons is deemed the quantum efficiency (Q.E.) and is typically in the range 20%–30% for modern PMTs [31].
At the heart of a PMT is the electron multiplication stage. An electron emitted from the surface of the photocathode will typically have very low kinetic energy (on the order of a few eV). If an electrode (the dynode) placed near the photocathode is held at a high positive potential relative to the photo-cathode (say, 100 V), then the emitted electron will be accelerated across the gap, thereby acquiring a kinetic energy of 100 eV en route. This electron will then collide with the dynode resulting in more electrons being liberated. As the creation of each electron requires sufficient energy to overcome the band-gap (2–3 eV), it is possible that the original 100 eV electron will ionize several electrons within the dynode material. However, not all of these electrons will have enough energy to traverse the dynode material and subsequently make it to the surface. As a result, only a small fraction of the electrons liberated will retain enough energy to be ejected from the dynode surface. When another dynode is placed in close proximity to the first dynode and again held at a positive potential relative to the first dynode, then the ejected electrons will be accelerated across this gap and will impact the next dynode, whereupon this process repeats itself. A typical PMT may have 6–12 such dynode stages, with each dynode stage increasing the number of electrons produced. At each dynode stage, the number of low-energy liberated electrons can be represented by δ. Thus, after N stages, the overall photomultiplier gain is given by
![]()
where α is the overall multiplier tube efficiency (i.e., the number of detected photoelectrons per number of emitted photoelectrons). It is not uncommon for modern PM tubes to achieve gains on the order of 106–107. It is also worth noting that the PMT gain is a function of the applied electrical potential. As a higher voltage is applied between the dynodes, more secondary electrons are produced when the incoming electron ionizes the dynode material and more of these secondary electrons are accelerated toward the next dynode. Additionally, each electron acquires more kinetic energy en route. So, while more electrons are incident upon the dynode, they penetrate the dynode material to a greater depth, thus making it more difficult for the secondary electrons to escape the material. Additionally, at typical room temperatures, there is a finite probability of an electron being spontaneously emitted from the photocathode even though a scintillation event did not occur. When operated with high operating bias, this single electron may result in a large photocurrent at the anode that may be mistaken for an event.
The final dynode of a photomultiplier is called the collector anode and has the highest potential difference between all the dynodes and the pho-tocathode. At such, it represents the end of the line for secondary electron emissions. Between the anode and the high voltage, a load resistor is used to drain the photocurrent generated through the PMT.
As described, the successive PMT dynodes must maintain a positive potential difference between them in order that secondary electrons get accelerated from the current dynode to the next dynode. These voltages are typically configured in one of two ways:
Positive bias: In this case, the photocathode is held at zero potential and each successive dynode has a corresponding higher positive bias applied, with the full bias applied to the anode (see Figure 14.4).

FIGURE 14.4
Schematic depicting the layout of a conventional PMT. The PMT is shown in the positive bias (a) and negative bias (b) configurations. The photocathode is shown on the left in both cases. (Adapted from Knoll, G.F.: Radiation Detection and Measurement. 3rd edn. 2000. Copyright Wiley-VCH Verlag GmbH & Co. KGaA.)This is most usually applied via a resistive divider network that separates each dynode with a resistor. Because the anode voltage is high, the resultant photocurrent pulse ride will ride atop a large DC bias. To remove this bias, the anode output is then AC coupled by means of a capacitor placed in parallel with the load resistor. AC coupling ensures that only the photocurrent passes through the capacitor and not the underlying high-voltage bias.
Negative bias: In order to eliminate the need for AC coupling, it is instead possible to negatively bias the PMT (see Figure 14.4). In this configuration, instead of the anode being held at high positive bias, the photocathode is held at a high negative voltage. Again, each successive dynode is held at a higher positive voltage with the anode held at ground. In this way, the resulting photocurrent pulse is riding atop an inherent 0 V bias, thus negating any need for AC coupling.
With either bias configuration, it is important that the PMT current along the resistive network be kept large enough to supply the dynodes with enough bias to keep them at constant voltage even in the event of large photocurrents. This is particularly true for latter-stage dynodes that may be producing a substantial photocurrent prior to the anode. Thus, in order to keep this bias stable, it is common for the last few dynodes to also utilize a stabilizing capacitor across them in order to supply the current lost from the dynodes during photocurrent pulses [31].
When secondary electrons are liberated from each dynode, they typically have very low energy and are accelerated via the applied potential difference to the next dynode. This acceleration requires a finite amount of time for each electron as each electron will have a different amount of kinetic energy when ejected. Over the course of all electrons progressing through the dyn-odes, there will be a spread in the time it takes for electrons to transit from the photocathode to the anode (i.e., the transit time). The most crucial step is the initial transit of primary photons from the photocathode to the first dynode and is primarily due to the different distances that electrons must travel from one location on the photocathode to the dynode [31]. In an effort to reduce the transit time spread, photocathodes are often curved in order to equalize, as much as possible, the photocathode–dynode distance as well as incorporating focusing electrodes to guide the electrons to the dynode.
As PMTs utilize vacuum tubes and streams of low-energy accelerated electrons, they are inherently susceptible to magnetic fields. When placed in the vicinity of even low-strength magnetic fields, the electrons traversing from dynode to dynode are subject to magnetic forces that may affect the electron trajectories. Such effects have been seen even for small magnetic fields on the order of 10 Gauss [32], thus making PMTs impractical to utilize for photode-tectors in conventional MRI devices. In an effort to reduce the effect of small magnetic fields, PMTs are usually wrapped in a thin magnetic shield such as Mu-metal [31].
14.2.3 Acquisition Electronics
The electrical signal output from a PMT, while amplified through the electron-multiplying process, is still rather small and must be further amplified and shaped [31]. A typical PMT output consists of a sharp drop in voltage (several nanoseconds) when the scintillator initially fluoresces followed by a longer tail, usually lasting several hundred nanoseconds. The amount of photocurrent produced by a photomultiplier is proportional to the initial photon energy and even though amplified through the PMT, the signal is still generally too small to be measured reliably. Thus, the output from the PMT is passed through a preamplifier (pre-amp) in order to yield an output signal that is proportional to, but greater than the input signal. This is usually accomplished through the use of either a voltage-sensitive (VSA) or charge-sensitive preamplifier (CSA). In order to overcome the capacitive loading of the connecting wires, it is usually located as close as possible to the photodetector.
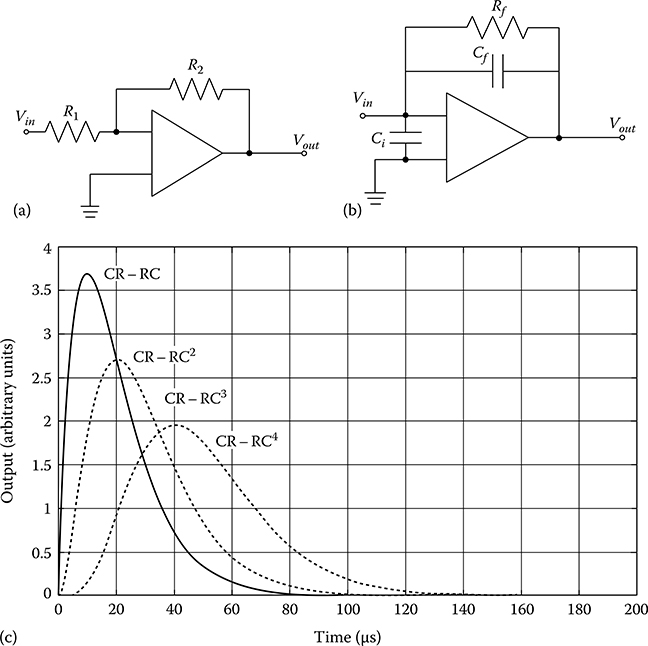
FIGURE 14.5
(a) Schematic of a VSA. The output Vout is proportional to the input signal Vin multiplied by ratio R2/R1 but is dependent upon the detector capacitance (not shown). (b) Schematic of a typical CSA. The output signal Vout is now independent of the detector capacitance and decays with time constant Rf Cf. (c) The effect of CR–RCn pulse shaping on preamplifier signals. With more RC stages, the output pulse becomes more symmetric but with a longer rise and decay time.
A typical VSA is shown schematically in Figure 14.5a and consists of a basic inverting amplifier. Given an AC-biased input, the maximum voltage across the bias capacitor on the input side is given by
![]()
After passing through the amplifier, the input voltage is inverted and scaled by the ratio of the resistors such that
![]()
Such a preamplifier design works well for detectors whose capacitance does not change, such as PMTs, but for semiconductor detectors whose capacitance may change under different operating parameters, the ever-changing relationship between Q and Vmax makes consistency difficult to achieve.
In contrast to the VSA, a CSA is shown schematically in Figure 14.5b. In this configuration, the output from the photodetector is first coupled through an input capacitor, Ci, before being passed through the amplifier. An input charge builds up on the feedback capacitor, Cf, and is dissipated through the feedback resistor, Rf. The subsequent output voltage through the CSA is thus

In this scenario, the resultant output voltage is only a function of the integrated charge, Q, produced in the photodetector. Under realistic circumstances, the output pulse Vout will rise very quickly to a maximum that is proportional to the detected charge, followed by a slow decay described by the time constant RfCf. It is common for the initial rise time to be several ns long but the ensuing decay to proceed for several hundred microseconds.
As a result of these long tails, it is possible that in the presence of high count rates, each ensuing output pulse is added to some residual of the previous pulse. Thus, the detected absolute output voltage may be severely overestimated. If the count rate is high enough, it is possible that the output voltage will be above the saturation level of the amplifier thus making each detection appear with the same magnitude.
As it is only the height of the initial rise that is important, it is common to employ additional circuitry to provide pulse shaping to extract only this portion. Examples of such shapers include CR–RC circuits or Gaussian shapers. If the output pulse from a preamplifier (essentially a step function) is fed through a simple CR circuit, the output is a differentiated signal, equal to
![]()
where τ represents the time constant, RC. Similarly, if an input is directed through an RC circuit with the same time constant, τ, the output is an integration of the input equal to
![]()
If the preamplifier pulse is fed through the CR–RC circuit in series, the output signal is equal to
![]()
By combining multiple RC stages, the net result is a CR–(RC)n pulse shaper of which the output is described by

This type of shaper reduces the output tail further and achieves a Gaussian-shaped output function after the addition of only about 4 RC stages. While the output becomes more Gaussian in shape (as shown in Figure 14.5c) and the tails decay to baseline faster than with a standard CR–RC shaper, the initial rise time does become longer, thus limiting the peak counting rate.
In PET and SPECT imaging, in order to measure high count rates, it is common to clip the incoming PMT pulse while the scintillator is still scintillating. When clipped, the preamplifier will only integrate over a short time period and accumulate only a portion of the total charge produced. While the use of pulse clipping can improve the overall count rate capability of the detector, the trade-off is a larger noise component in the amplified signal due to less than complete charge being accumulated.
In current PET and SPECT designs, it is common for each shaped signal to then be digitized via an analog to digital converter (ADC). It is normally sufficient to use 8 or 10 bit flash ADCs for this task. In order to distinguish actual events from background noise, a summing and triggering circuit is used. Signals from all PMTs are passed through a summing circuit in order to determine the total signal produced during a scintillation event. The total signal is then compared to a preset threshold (situated well above background noise levels) and if the event signal is above this threshold, a trigger signal is sent to each PMT channel, thereby initiating the ADC conversion. Within each channel, a peak detect and hold circuit latches onto the peak of the shaped pulse and holds it until sampled by the ADC. Once sampled, the peak detect circuit is reset back to baseline to await the next pulse.
For each scintillation event, the location of the event must now be determined. SPECT imaging typically uses a large, monolithic scintillator coupled to an array of many photodetectors. For each scintillation event, multiple photodetectors will sense the light produced and by using all the signals, the (X,Y) location of the scintillation can be determined. This is typically performed using an Anger logic-type algorithm or some other variant whereby the scintillation location is determined via a weighted averaging in both the X and Y locations depending on the detector position, such as

where α and β are weighting factors for the ith digitized signal.
PET scanners typically consist of multiple modular detector blocks with each block comprised of a 2 × 2 array of PMTs coupled to a scintillator. For each scintillation, the light is shared among only 4 PMTs, thus making the localization somewhat simpler. Using the four digital PMT outputs, the (X,Y) location of the scintillation can be determined via the equations
![]()
where A, B, C, and D correspond to the four PMT outputs, respectively.
The total gamma ray deposited energy (E) is simply determined by summing all the PMT signals. Once the (X,Y) locations are determined, it is then possible to display a histogram of detected positions on a computer monitor. In the case of SPECT, the detector then needs to rotate around the patient in order to acquire angular projections from which the 3D distribution of radioactivity can be determined. In the case of PET, an entire ring of detectors is positioned around the patient and acquires all possible projection angles simultaneously without any detector motion.
14.3 Imaging with MRI
14.3.1 basics of MRI
MR imaging uses a high, static magnetic field (B0) in order to align the proton magnetization vector within the object. Typically, this magnetic field is on the order of 1.5–3 T and is produced using a superconducting magnet. This magnet is usually cylindrical with an open bore of approximately 70 cm diameter and 2 m long, although some low-field, open-gantry systems consist of a flat permanent magnet.
Within the bore is a set of three additional magnetic field-producing coils. These coils are the gradient coils Gx, Gy, and Gz and are used in conjunction with the main magnetic field to alter the local magnetic field within the bore. Also within the bore is a set of RF coils. These coils are used to transmit an RF pulse to the protons of the object, causing the magnetization vector to change as a result of the applied magnetic field. As the proton magnetization decays back to its normal state following RF excitation, a subsequent RF pulse is emitted from the protons, which is detected by the coil. By using a series of RF pulses in conjunction with altering the magnetic gradients within the bore, images can be obtained depicting localized properties of the magnetization vector. The RF coils may transmit and receive, transmit only, or receive only. In the case of transmit-only coils, a receiver set of coils must also be used to detect the emitted RF signal from the protons. It is important to note that RF coils should be placed as close as possible to the object being imaged in order to obtain the highest signal to noise ratio (SNR). This factor will become important when considering where PET or SPECT inserts can be placed within the bore.
MRI is able to distinguish tissues based on their proton density or magne-tization properties such as their spin–spin (T2) or spin–lattice (T1) relaxation times. As these properties vary in the proximity of different tissues, MR images can depict subtle changes in tissues even though the tissue density does not vary much. Given the improvements in soft-tissue contrast in MRI compared to CT and the complementary functional information obtained, it seems natural to combine MR imaging with nuclear medicine imaging. In fact, combining PET or SPECT with MR images has been performed rather routinely using separate imaging systems and software co-registration methods. However, given the success of combined PET/CT and SPECT/CT, the combination of PET/MR or SPECT/MR in a single imaging gantry would seem to offer several advantages over separate imaging systems, not least of which is the improved diagnostic value of perfectly co-registered images. As we will see, however, the development of PET/MR or SPECT/MR is not necessarily as straightforward as the development of PET/CT or SPECT/CT.
The biggest hurdle with simply grafting a PET or SPECT machine onto an MR gantry is that the radionuclide imaging system must operate in the vicinity of a high magnetic field strength (typically 1.5−3 T but possibly upward of 9–14 T for animals). The high magnetic field creates problems for conventional nuclear instrumentation and so alternative techniques must be used. Some attempts have focused on using alternative MR configurations, while other attempts have investigated alternative nuclear detectors. We will investigate some of these approaches in the following section.
14.4 Alternative MR Configurations
In order to achieve higher spatial resolutions with higher SNR, there has been a push in MR imaging for higher and higher magnetic field strengths. In order to achieve these high magnetic fields, most MR machines utilize cryogenic superconducting magnets, making it impossible to cycle MR magnets on and off in order to provide sequential imaging with PET or SPECT. However, by using alternative approaches to generate the magnetic fields needed, it becomes possible to perform co-registered sequential nuclear/MR imaging.
14.4.1 low-Field MR
As mentioned previously [32], even small magnetic fields can have a signifi-cant effect on the performance of PMTs. As such, conventional PMT-based radiation detectors cannot be placed in the vicinity of high-field MR scanners. Goertz et al. [33] however have taken the approach of using a non-superconducting, low-field MR (0.1 T) in conjunction with a single detector NaI(Tl) SPECT camera in order to conduct sequential SPECT/MR imaging in small animals. While resulting in lower spatial resolution and lower SNR compared to high-field MR, the advantage of using a low-field MR lies in the fact that the 5 Gauss line is situated only 15 cm from the edge of the main magnet, thereby making it possible to place a conventional PMT-based SPECT camera at this location. In this configuration, the animal is first imaged using the pinhole SPECT camera then manually moved the 15 cm or so to the MR system. Since the animal remains in the same imaging cell for both scans, any deviation in positioning can be remedied with a relatively simple rigid-body transformation. In fact, co-registration parameters between the MR and SPECT images were first determined using a three-tube geometric phantom and for all successive imaging experiments using animals, the SPECT scans were co-registered to the MR images using the same set of registration parameters.
While the low-field MR was not capable of providing high-resolution anatomical imaging or spectroscopy information, the spatial resolution and soft-tissue contrast was deemed of sufficient quality to be used for anatomical co-registration with SPECT. As well, it was pointed out that if the only requirement of the MR is for SPECT co-localization, then low-field MR is more than adequate for this purpose.
14.4.2 Field-Cycled MR
As another alternative to cryogenically maintained static magnetic fields, research has focused on using field-cycled MR [34–36]. In conventional MR, the main static magnetic field is used to both induce the magnetization within the object and create the magnetic environment for the transverse magnetization to precess. Thus, the field strength affects the amount of magnetization generated in the sample and must be kept as uniform as possible.
In contrast, the field-cycled MR consists of two nonsuperconducting magnets, one large field for generating the polarizing magnetization and a smaller homogeneous magnet for readout. The large field magnet is first applied creating a net magnetization in the object. After a short time (on the order of 1 s), the polarizing magnet is turned off, and the readout magnet is turned on, again for a short time. When the readout magnet is turned on, the net magnetization produced by the polarizing magnet will precess at the Larmor frequency while it decays. During this time, RF pulses and gradient fields are applied as in conventional MRI in order to gather the resonance signal.
Since the field-cycled MR does not utilize a static magnetic field, it is possible to incorporate conventional PMT-based radiation detectors into the gantry [36]. These detectors would not be operated simultaneously with the MR, but rather acquisitions would be interleaved between the MR pulse sequences when the main and readout magnetic fields are cycled off.
14.5 Alternative Radiation Detectors
Recent developments in radiation detection have made it possible to consider alternatives to the conventional scintillator/PMT arrangement.
14.5.1 Scintillation Detectors
In many respects, scintillation detectors still offer many advantages over other radiation detection methods. Reasonable cost, good energy resolution, and high detection efficiency are just some of the advantages scintillation detectors offer. As well, if appropriate scintillators are chosen, their relative insensitivity to high magnetic fields enables them to function properly in the presence of high magnetic fields. By the same token, the high electrical resistance of most scintillators reduces the effect of eddy currents within the detector material, thus reducing the influence of the scintillator on the magnetic field. For these reasons, scintillating detectors are still a good option for combined radionuclide/MR imaging. However, care must be taken to either place the photomultipliers at sufficient distance from the main magnet or to use alternative, magnetic-compatible photodetectors.
14.5.2 Fiber-Optic Coupling
The magnetic field at the center of most clinical MRI systems is typically between 1.5 and 3 T; however, this decreases rapidly with distance such that by ∼3 m from the center, most magnetic fields are less than 10 mT [37]. Thus, if the sensitive PMTs and electronics of a PET or SPECT device can be placed in this lower-field area, then it would permit simultaneous imaging. This was the approach taken in the development of the first simultaneous PET/MR detectors [37–39].
The McPET I was a single, 38 mm diameter ring consisting of 48 − 2 × 2 × 10 mm LSO scintillators with each crystal coupled to an individual pixel of a multichannel photomultiplier. This detector was integrated between the poles of a 0.2 T vertical field MRI. In order that the magnetic field exhibit negligible effect on the photomultipliers, the PMTs were placed ∼3 m from the magnet and connected to the scintillators via a 4 m long and 2 mm diameter optical fiber. At this distance, the magnetic field strength was measured to be less than 0.1 mT.
As some light will inevitably be lost during transit through the fiber optic, the significantly greater light output of LSO compared to BGO lends itself well as the scintillator of choice even though the detection efficiency is slightly less. As the crystals were oriented with their long axis parallel to the axial direction, detection efficiency was somewhat reduced as only a 14% detection efficiency was realized, thus contributing to an energy resolution of 41%. Timing resolution for this system was also somewhat high at 20 ns. Nevertheless, this system was able to show that simultaneous PET and MR imaging was indeed possible using separated scintillators and photodetec-tors and that no noticeable distortion effects were seen in either the PET or MR images.
This system was further developed into the McPET II, which utilized 72 − 2 × 2 × 5 mm crystals oriented radially in a single slice and coupled to the same photodetection subsystem. By reorienting the crystals, an improvement in detection efficiency to 34% was obtained with similar energy resolution (45%) and timing resolution (26 ns) to the McPET I. This system was tested in magnetic fields up to 9.4 T without showing any noticeable effects on the PET images.
While the use of fiber-optic coupling showed the feasibility of simultaneous PET and MR imaging, a number of limitations are present with this approach. The attenuation of scintillator light output along the long optical fibers reduces the energy resolution and coincidence timing. As a result of the issues with using PMTs for photodetection, there has been increased interest in alternative types of photodetectors [40].
14.5.3 Photodiodes
Photodiodes are semiconductor photodetectors that convert incident light into electrical current proportional to the intensity of the incoming light. As such they have replaced PMTs in some applications [41,42]. Photodiodes consist either of PN-type (p- and n-type semiconductor layers) or PIN-type materials (p- and n-type layers with a depleted i-type region between them). Most photodiodes used in conjunction with scintillators are of the PIN type due to their superior sensitivity and responsiveness. Compared to PMTs, photodi-odes offer higher intrinsic quantum efficiency, low power consumption, low operating bias, and insensitivity to magnetic fields.
As light photons enter the p-layer, electron/hole pairs are produced and collected on the boundary layers of the i-type region, driven there by an applied reverse bias across the PN contacts. Once at the anode, the electrons contribute to a small amount of current. Through the collection of many light photons, several electron/hole pairs are liberated and a small but detectable photocurrent is produced.
The inherent Q.E. of typical PIN photodiodes is 50%–70%, several times higher than PMTs [31]. However, photodiodes typically have a different response curve as a function of wavelength compared to photomultipliers. Most PMTs have a peak Q.E. around 400 nm, thus making them suitable for use with common scintillators such as NaI(Tl), LSO, or BGO. However, pho-todiodes typically have responses peaked more toward the red end of the visible light spectrum, making them more efficient with scintillators such as CsI(Tl).
It is worth noting that for each visible light photon incident on the photodi-ode, a maximum of only one electron/hole pair will be generated (theoretical Q.E. of 100%) and so the conventional photodiode is a unity gain device. As most scintillation events only generate a few thousand scintillation photons, the resultant charge buildup is quite small for a single scintillation. Even so, with a low-noise CSA, it is often possible to detect the resultant charge buildup from a single event over the background detector noise.
With the small level of signal produced in photodiodes when operating in pulse mode, they are extremely sensitive to electronic noise. The two most important factors contributing to noise are the photodiode capacitance and the leakage current. Because of the PN junction, a photodiode has an inherent capacitance that increases with area but decreases with thickness. It is typical that photodiodes have capacitances on the order of 20–50 pF/cm2 although some may be as high as 300 pF/cm2. Because photodiodes are semiconductors, they will always show a small amount of conductivity as a result of thermal ionizations. This leakage current increases with temperature as well as with increasing thickness. Small fluctuations in the leakage current give rise to jitter that may obscure the small signal from a legitimate photo event. As the leakage current decreases with temperature, it is common for photodiodes to be actively cooled in order to reduce the dark current enough so as to be able to detect photo events.
In order to limit the device capacitance and dark current, photodiodes are typically only available in small sizes (typically less than 1 cm2). Thus, it is tempting to consider using arrays of photodiodes coupled to large-area scintillators in order to replace conventional PMTs. The problem with this, as pointed out by Groom [31,43], is that as the light collection increases with photodiode area, so too does the inherent noise and as a result, very little gain in SNR is actually obtained. As a result, most applications of photodi-odes as radiation detectors use individual scintillation crystals coupled to individual photodiodes [44]. With this design, most of the light produced in the scintillator interacts within a single photodiode, thus maximizing the SNR. Because of the relatively small size of photodiodes compared to the effective area of most imaging devices, designs incorporating photodiodes as photodetectors typically require the use of multichannel digital electronics and parallel processing. However, as a result, these devices do not suffer from the same dead-time considerations as conventional monolithic scintillators and Anger logic detectors.
The Digirad 2020Tc is the first commercially available photodiode-based gamma camera. This camera uses a 64 × 64 array of CsI(Tl) detectors (3 × 3 mm) with each detector pixel coupled to a PIN diode. Since there is no sharing of the scintillation light across multiple diodes, this camera does not suffer from excessive noise on each detector channel, although the system is also actively cooled to reduce background noise. It is noted that although this system uses PIN diodes, it has not been designed to operate in the vicinity of an MR.
14.5.3.1 Avalanche Photodiodes
As mentioned, photodiodes are unity gain devices and suffer from poor SNR when detecting the small signals produced in scintillation events. To mitigate this problem and achieve some level of signal amplification, the avalanche photodiode (APD) was developed. A typical APD device is shown in Figure 14.6a. In essence, an APD consists of a PN semiconductor, with a drift region between the p and n junctions. When a high reverse bias is applied across the junctions, it sets up a nonlinear electric field through the multiplying region. When exposed to light, electron/hole pairs are created in the drift region of which, because of higher electron mobility, results in the electrons preferentially being pulled toward the anode. Because of the high electric field residing in this region, the electrons are accelerated and collide within the semiconductor matrix, thereby resulting in more ionizations and more electron/hole pairs. The secondary electrons are then free to be accelerated and undergo further ionizations, and so forth. Eventually, the freed electrons will reach the anode and result in an amplified electrical signal.
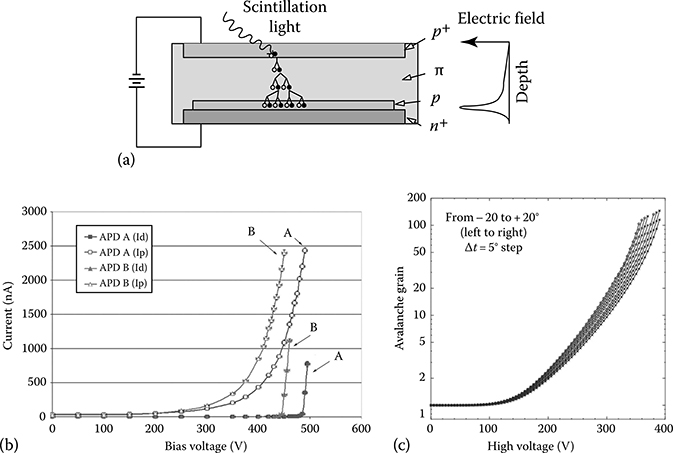
FIGURE 14.6
(a) Representation of a standard reach-through APD. Incoming light photons liberate electron/hole pairs in the semiconductor material that then are accelerated through the multiplying region, thus liberating more electron/hole pairs. The subsequent collection of electrons at the anode is amplified through the avalanche process. (b) Plot of gain vs. bias for two silicon avalanche photodiodes (Hamamatsu S8550–1010). Note the breakdown voltage is different for both diodes even though the model is the same. (c) Plot of gain vs. operating bias for a silicon APD (Hamamatsu S8550–55). In addition to an increase in gain at lower operating bias when cooled, the thermal noise content is significantly lowered when cooled, thus increasing the SNR. (From Kataoka, J. et al., Nucl. Instr. Meth. Phys. Res. A, 564, 300, 2006.)
As the applied electrical potential increases, the number of impact ionizations in the multiplying region also increases, thereby resulting in increased signal gain. However, at high bias, the normally immobile holes will be attracted toward the cathode and produce impact ionizations en route. The additional electrons get pulled easily toward the anode, producing an additional, undesired, cascade effect. The point at which this occurs is the breakdown voltage (Vbr) and is temperature dependent. When operated above breakdown voltage, the number of electron/hole pairs produced via the original interaction and subsequent multiplying process is no longer proportional to the intensity of incoming light. For this reason, APDs are generally operated at operating voltages somewhat below the breakdown voltage at a given operating temperature.
It is important to note that while the gain of an APD is greater than standard PIN diodes, the gain is dependent upon the operating voltage and the operating temperature [45]. Figure 14.6b depicts the system gain for a standard 10 × 10 mm APD exposed to light from a red LED over a range of operating voltages. As the bias is increased, the overall gain of the APD is also increased. However, in addition to increasing the APD signal, the noise also increases with bias. There comes a point prior to breakdown voltage where the noise is increasing faster than the useful signal, thus the SNR starts to decrease. It is at this point where the SNR is maximal that is usually optimal to operate the APD.
Figure 14.6c depicts the overall APD gain as a function of operating temperature. It is seen that by cooling the APD, at a given operating bias, the gain will be higher when at lower temperatures. As well, the breakdown voltage also decreases when cooled so that for a given gain, the APD can be operated with a lower operating bias [46,47]. Furthermore, the APD background noise also decreases when cooled thus improving the SNR. This temperature dependence on gain can become a problem, however, as it means the APD output varies as the device warms up or cools down. For most APDs, this variation in gain as a function of temperature is on the order of 2%–3%/°C, thereby making it rather challenging to operate an array of APDs without some form of active gain compensation [45].
One of the first APD-based radiation detectors for use with PET was the small animal PET developed by Lecomte et al., at the Universite de Sherbrooke [48–52]. This device utilized two rings of 256 − 3 × 5 × 20 mm BGO scintillators each coupled to an individual APD. This device has since been commer-cialized as the LabPET [53] and though the device has not been shown as of yet to operate in the vicinity of magnetic field, these devices were the first to show that a stable imaging system can be developed using APDs.
Recently, Pichler et al. [54–56] have replaced the PMT photodetectors on a clinical PET detector module with an array of APD detectors for use in simultaneous PET/MR. This detector uses a 3 × 3 array of 5 × 5 mm APDs coupled to LSO scintillators. The output of each APD is then fed into a CSA and associated electronics similar to PMT detectors.
In an effort to both improve the spatial resolution of large-area APDs and reduce the complexity of multichannel acquisition electronics when used with individual APD elements, position-sensitive APDs (PSAPDs) have been developed [57]. In essence, PSAPDs are large-area APDs (up to 14 × 14 mm) with a resistive layer on the back face upon which multiple contacts are placed (see Figure 14.7a). The usual configuration is to divide the back face into quadrants with separate outputs for each quadrant. Because the total charge produced in the APD is shared among four anodes, PSAPDs require high gain in order to overcome the inherent noise associated with each anode.

FIGURE 14.7
(a) Schematic of a PSAPD. Note the anode is divided into four quadrants, thus resulting in a charge division across the four anodes. The individual signals are combined in order to determine the (X,Y) location of the original scintillation event. (b) Preclinical PET/MR ring produced at UC Davis. The detector ring consists of a series of LSO detectors fiber-optically coupled to PSAPDs and CSAs. The entire ring and electronics is enclosed within a copper “can.” (From Catana, C. et al., J. Nucl. Med., 47, 1968, 2006.)
When coupled to an appropriate scintillator (usually pixelated CsI(Tl) or LSO), it is possible to acquire the four quadrant signals for each scintillation event and to subsequently determine the appropriate scintillator detector that gave rise to these signals via the same equations used for PET imaging (i.e., equations X, earlier). Given the relatively low SNR on each channel, PSAPDs also utilize a fifth detector channel on the top layer in order to obtain a summed signal over the entire array. This output is useful for obtaining low-noise information for subsequent energy discrimination. These devices have been investigated for use in preclinical imaging owing to the possibility of high resolution (300 μm [58]) both for PET [59,60] and SPECT [61].
Using these PSAPDs, Cherry et al. [62–65] have developed a preclinical PET insert for hybrid PET/MR imaging (Figure 14.7b). This device uses a ring of LSO detector modules fiber-optically coupled to PSAPDs. The entire ring consists of 16 detector modules with each detector module comprised of an 8 × 8 array of LSO scintillator crystals (1.43 × 1.43 × 6 mm). A short 6 × 6 fiber-optic bundle (1.95 × 1.95 mm per fiber) is used on each module to carry the light information from the scintillators to the 14 × 14 mm PSAPD. This bundle incorporated a 90° bend in order to minimize the radial extent of the insert. Each PSAPD utilized five outputs (four back layers for position information plus the top layer for timing and energy discrimination) with each channel passing through a low-noise CSA. As the APD and preamplifiers were placed inside the MR field, they were shielded with a cylinder of high-frequency laminate in order to minimize RF interference. Outputs from the preamplifiers were then fed to standard PET acquisition electronics located at a safe distance from the MR magnet. In order to reduce dark current, the PSAPDs were cooled to approximately −5°C by blowing cold nitrogen gas over them. Of note is the fact that a relatively large 40 ns coincidence timing window was used to discriminate coincidence events. This was explained by fact that the top layer PSAPD signal has a position-dependent delay as it was recognized that signals originating from the edge of the PSAPD would typically be measured sooner than signals originating from the center. Because the purpose of this system is preclinical imaging, it was noted that the large coincidence window would not represent a significant problem as anticipated random events will be quite low due to the relatively low radioactive doses administered to the animals.
As can be imagined, as the bias voltage is continually increased, additional impact ionizations occur within the APD at the same time some electrons are collected at the anode. However, there will come a point when more electrons are produced than can be collected at the anode. This is referred to as the breakdown voltage and at this point, the ensuing runaway production of electron/hole pairs leads to a large photocurrent that is no longer representative of the original light intensity. When operated in this way, the APD is said to be operating in Geiger mode as the detection of a single light photon in the APD results in a large photocurrent. Because the output is no longer proportional to the incident light intensity, APDs used as alternatives to PMTs for imaging are typically operated well below breakdown voltage. However, as the APD bias is increased above breakdown, the generation of electron/hole pairs increases exponentially. As the semiconductor material has some series resistance, more of the voltage is dropped across the resistance as the photocurrent grows, thus limiting the avalanche effect until at some point the voltage across the high-field region is reduced to breakdown when the generation of electrons is matched by the extraction of electrons at the anode. So, in the continued presence of applied bias, this large photocurrent will continue to flow indefinitely, thereby rendering the detector unresponsive to further photodetections. In order to further detect photons, the APD must be quenched.
Two means of quenching an APD are possible, passive quenching or active quenching. In the former case, the bias is simply removed from the APD once it is in the steady state. Once removed, the inherent resistance and capacitance results in a gradual decline in photocurrent until the avalanche process no longer occurs, thus resulting in dead time while the APD discharges. In active quenching, the APD bias is again removed after the avalanche process is initiated, but once the discharging starts, a quenching circuit steps in to shunt the APD and quickly discharge the device, thereby reducing the APD dead time. Once discharged, the bias can then be reapplied through the use of a switch. For simplicity, most applications of Geiger-mode APDs uti-lize a large series resistor, Rs, between the power supply and the APD, thus creating a virtual open circuit that continually charges the APD with time constant RsC while allowing the APD to discharge with time constant RC.
For all diode-based photodetectors, every effort is made to reduce the number of high-energy gamma rays from interacting within the photodiode by using thick scintillators and making the diode as thin as possible. Even so, it is still possible that a gamma ray will penetrate the scintillator and interact within the diode material itself. When this occurs, electron/hole pairs are created the same as when low-energy light photons interact, thus giving rise to electrical signals. This is problematic as the signal from a direct ionization is several times larger than that which would be detected from the scintillator, thus making it possible that spurious events may have a large effect on subsequent processing.
14.5.3.2 Multi-Pixel Geiger-Mode Avalanche Photodiodes
Since the output signal of a single channel Geiger-mode APD is not proportional to the deposited gamma ray energy, APDs operated above Vbr are not useful for imaging applications. However, as they are extremely sensitive, it is possible to measure single optical photons with these devices. If the APDs were miniaturized sufficiently and an array of such APDs configured, then for a given scintillation event in a crystal, each APD element would be capable of detecting a single optical scintillation photon and outputting a large photocurrent. Since each Geiger-mode APD would output the same voltage when it detects a photon, simply summing up the total signal over all elements would give an indication of the total number of optical photons detected. This is the basis of the multi-pixel Geiger-mode APD, sometimes referred to as solid-state or silicon photomultipliers (SSPM or SiPM) [66–68], depicted schematically in Figure 14.8a.

FIGURE 14.8
(a) Schematic of a multi-pixel Geiger-mode APD. Each APD element is typically between 25 and 50 μm in size, with the entire array usually about 1 mm × 1 mm. (b) Schematic representation of SiPM array using 4 × 4 SiPMs. The output of each SiPM can be independent (i.e., 16 channels per array) or summed together for a single output. When summed, the array behaves similar to a conventional PM tube and when operated in multichannel mode, the array becomes position sensitive for high-resolution applications.
Most SiPM designs use an array of several thousand APD detector cells all operating in Geiger mode. Each cell is typically between 20 and 50 μm square, thus the entire array is usually around 1–3 mm square. When a scintillation event occurs, the light photons will spread out through the scintillator and will be incident upon the SiPM that then initiates an avalanche process that creates a large current through the cell, thereby leading to an infinite gain if not for a quenching resistor integrated into each cell. As many light photons will be generated during a scintillation, many cells will undergo the avalanche cascade, thereby leading to an overall current proportional to the number of cells that undergo avalanche. As each cell can only react to a single light photon and output a given current, it is important that there are more cells than light photons expected and that the time required to reset each cell be as short as possible.
The overall gain of silicon photomultipliers approaches that of PMTs (around 106) [69] yet do not suffer from the same sensitivity to magnetic fields as PMTs. As well, they offer superior gain to either PIN diodes or APDs but with increased robustness, reduced noise, and the capability to operate at much reduced bias (∼30 V). Because of these benefits, many research groups are currently investigating the use of SiPMs for PET or SPECT imaging [70–74]. Commercial SiPMs are available through suppliers such as Hamamatsu, SensL Ltd., and Zecotek among others. Further development of SiPMs has led to arrays of SiPMs such as the large-area SensL SPMArray. This device consists of a 4 × 4 array of 3 × 3 mm SiPMs with each SiPM being comprised of 3640 microcells (see schematic in Figure 14.8b). This array can be operated in single channel mode where all SiPMs in the array are summed together or in position-sensitive mode where each of the 16 elements outputs an independent signal. With this configuration, the SiPM array would normally be coupled to pixelated scintillators and the 16 outputs used to determine the site of photon interaction.
14.5.4 Solid-State Detectors
Over the past several years, there has been renewed interest in replacing the scintillator/photodetector combination with solid-state radiation detectors for PET and SPECT. The inherent robustness of semiconductor detectors in strong magnetic fields makes them an attractive alternative to scintillator/photodetectors; however, their relatively high cost due to low manufacturing yields has limited their use, until recently, to research only.
In essence, semiconductor radiation detectors behave similarly to PIN diodes as described earlier. When a high-energy gamma ray interacts within the semiconductor, a number of electron/hole pairs are produced. The migration of these electrons and holes across an applied electric field gives rise to a measurable electric charge at the electrode. The electron/hole cloud of charge that is created has been seen to remain relatively intact (less than 250 μm) as the charges migrate through the electric field, limiting the charge spread to less than 0.5 mm from the original interaction location [31], thus making them ideal for high-resolution PET or SPECT imaging.
14.5.4.1 Si(Li) and Ge(Li) Detectors
Lithium-doped silicon- and germanium-based semiconductors have been used extensively for spectroscopy applications due to their high energy resolution (2%–3% at 662 keV). While capable of extremely high energy resolution, Si(Li) and Ge(Li) semiconductors suffer from an inherently high thermal noise component, thus making it necessary to cryogenically cool the material. Additionally, the relatively low stopping power of silicon and germanium materials limits their usefulness to primarily spectroscopy applications although some use has been made in SPECT or PET applications [75].
14.5.4.2 CdTe and CdZnTe Detectors
The most commonly used semiconductor radiation detectors are cadmium telluride (CdTe) and cadmium zinc telluride (CdZnTe or CZT). While CdTe and CZT has a density sufficient to stop 511 keV photons for PET, most crystals of CZT can only be grown of sufficient thickness for low-energy applications (typically 3–5 mm thick). Thus, CZT arrays are primarily used for SPECT applications, although some groups have investigated them for use with PET [76].
CZT detectors are typically either pixelated into discrete detector elements or used as a monolithic block. In the former case, each pixel requires its own anode and cathode, thus resulting in an inherent improvement in spatial resolution as pixels are made smaller and smaller; however, this comes at the cost of increased readout complexity in the requirement for thousands of individual readout channels. In the case of large single blocks of CZT, there is a single common cathode for the entire block but individual anodes distributed in an array on the back side of the block. Because of the small amount of diffusion of the charge carrier cloud, there is minimal spread of the carriers as they traverse the detector block.
Recently, Gamma Medica-Ideas has produced a prototype CZT detector insert for preclinical SPECT/MR imaging [77,78], shown in Figure 14.9. This insert consists of 24 CZT detector modules arranged in three octagonal rings. Each module uses a single block of 25.4 × 25.4 × 5 mm CZT with a single cathode and with a 16 × 16 array of pixelated anodes. A −500 V potential bias is applied to the cathode, thus creating the large electric field required to draw electrons to the anodes to produce a measurable signal.
Each anode of the detector block is connected to a single channel of a multiple-channel application-specific integrated circuit (ASIC) [79]. In total, each ASIC has 128 input channels with each channel incorporating a CSA, pulse shaper, peak–hold circuit, and a threshold discriminator. Two ASICs are connected to each CZT module in order to acquire the entire 16 × 16 pixel array. The collimation system for this detector insert is comprised of an MR-compatible heavy-metal composite cylindrical sleeve, 35 mm in diameter. This sleeve consists of a series of pinhole apertures, with each pinhole corresponding to one of the CZT detector modules.

FIGURE 14.9
(a) CZT detector module used in the first MR-compatible SPECT detector. (b) SPECT/MR ring insert consisting of three rings of eight CZT detector modules. Each module uses a single pinhole collimator. (From Azman, S. et al., IEEE Med. Imag. Conf. Rec., 2311, 2007.)
In the past, CZT production has been plagued with low production yields and small crystal sizes. New production methods [80–82] offer the promise of delivering higher-yield materials with higher grade, thus making the transition from scintillators to solid-state detectors possible. At least two manufacturers now offer CZT-based clinical gamma cameras (GE and Spectrum Dynamics) for limited applications.
14.6 Other Considerations
14.6.1 Magnetic Compatibility
To reduce the influence of background radiation, PET and SPECT detectors are usually surrounded by a heavy-metal material that acts as radiation shielding. On stand-alone devices, this material is typically lead because of its high stopping power and relatively low cost. Because PET imaging utilizes coincidence detection, the required shielding is not very significant and in fact is usually used more to shield the photomultipli-ers from magnetic field effects. However, as SPECT detects a single photon at a time, any background radioactivity can have a significant effect on the imaging performance and so camera shielding is quite signifi-cant. Additionally, SPECT systems incorporate a heavy-metal collimator attached to the scintillator that limits the angle of acceptance of incoming gamma rays. Again, this collimator is typically constructed of lead or tungsten alloys.
In order to function in the high magnetic field of MR, it is necessary to consider the appropriateness of the radiation shielding and collimator materials used in PET and SPECT detectors [83]. Ideal PET and SPECT shielding materials would have the following properties:
High stopping power for radiation
Magnetically compatible (i.e., low magnetic susceptibility)
Nonconductive
Thin and lightweight
Properties (1) and (4) are very much related as, in general, for a material to have high stopping power, it must have a high effective atomic number, Z, and high density. Thus, there are trade-off considerations between weight and radiation stopping power that should be addressed for each application.
In order to measure magnetic compatibility, the use of magnetic susceptibility, ξ, is most often used [84]. This property measures the extent of an induced magnetic field produced by the material when placed in a magnetic field and is defined as
![]()
where
M is the volume magnetization (magnetic moment per unit volume)
H is the magnetic field
Susceptibility is usually described in terms of parts per million (ppm) with the sign denoting the direction of the magnetization vector and the absolute value denoting the strength. For example, water has a low magnetic susceptibility of about −9 × 10⁻⁶, while pure iron has a susceptibility of around 2 × 10⁵. Depending on the application, it is common to also use relative permeability rather than susceptibility. In free space, the two quantities are related by the expression
![]()
In selecting appropriate MRI-compatible materials, it is important to select materials both with low absolute susceptibility values and with similar susceptibilities to those materials that are being imaged [85]. In the former case, materials with high susceptibility will produce large magnetic field distortions and lead to severe image artifacts. Materials with widely different susceptibilities also produce image artifacts as local perturbations in the magnetic field will be created from the different materials. These perturbations may result in spin dephasing between voxels or geometric distortions by warping the imaging plane. In either case, so-called susceptibility artifacts are produced [86–88].
It is also important to consider the generation of eddy currents in any material introduced into the MR system. Eddy currents form when conductive materials are placed in the changing magnetic fields produced by the gradient coils or B1 field. These induced fields may alter the magnetization vector flip angle, thereby resulting in image artifacts.
Along with artifacts produced in the MR images, it is also important to consider the effect of the magnetic fields and the radio frequencies on the performance of the radiation detection equipment. If used in conjunction with PET imaging, the magnetic field used in MR may actually have a beneficial effect on spatial resolution [89]. This is because the charged positrons produced as a result of the radioactive decay process will experience a Lorentz force on them as a result of moving through the strong magnetic field. This force will be directed perpendicular to the magnetic field so that the net effect is to produce a helical path. The radius of this path is given by
![]()
where
B is the magnetic field strength
mp is the positron rest mass
Et is the positron kinetic energy perpendicular to the magnetic field
While MRI systems have multiple magnetic field gradients, the main static field is the only magnet that appreciably affects the positron path. Given that this magnetic field is oriented axially, it is expected that spatial resolution improvements will only be seen along this direction. Nevertheless, improvements in spatial resolution are seen to be appreciable when the positron energy is significant, with little improvement with lower-energy positrons such as those emitted from F-18 [90]. Table 14.2 depicts some of the improvements seen for different nuclides in the presence of high B0 fields.
Aside from the theoretical improvements in spatial resolution, most of the other consequences of the MR device will be detrimental to the operation of the radiation detectors. As already mentioned, the magnetic field will have a disastrous effect on PMT performance, thereby rendering them useless. Even if alternative detectors may be resilient to high magnetic fields, they may be susceptible to RF interference from the RF pulses used in MR imaging. This is particularly true of highly sensitive components such as APDs. The need to place additional electronics such as preamplifiers or ASICs in the vicinity of the magnetic field may also introduce problems with electrical interference. To overcome some of these effects, copper shielding may be used to reduce the amount of RF interference.
For SPECT imaging, the choice of collimator material introduces some problems of its own. The large lead collimator typically used for SPECT would probably not be optimal for a SPECT-capable system as the electrical conductivity results in induced eddy currents when exposed to RF that may yield magnetic field inhomogeneities [83] or susceptibility artifacts in the MR images.
TABLE 14.2
Spatial Resolution Measurements Expected for Some of the Most Common PET Radionuclides in the Presence of a 10 T Magnetic Field

Source: Raylmann, R.R. et al., IEEE Trans. Nucl. Sci., 43, 2406, 1996.
To produce 3D images using SPECT, a typical parallel-hole collimator must rotate around the object collecting views at multiple angles. This motion would most likely require the application of an electric motor, the exact placement of which, for obvious reasons, cannot be placed directly into the MR bore. Alternative approaches utilizing a ring of stationary cameras may alleviate some of the technical challenges involved in mechanical rotation. Designs that incorporate full detector rings [e.g., 91–93] with multiple pinhole or coded aperture collimators would appear to be the most promising.
14.6.2 System Design
Given the space constraints within an MRI bore, it is important to consider the placement of the SPECT or PET system within the bore. In essence, three different designs for integrated nuclear/MR imaging are possible [94]: (1) separate systems, shared patient bed; (2) removable insert for PET or SPECT; and (3) fully integrated system (as shown in Figure 14.10). System (1) earlier would necessarily involve sequential imaging rather than simultaneous imaging and while the resultant images would be reasonably co-registered, it would still require at least twice the imaging time compared to simultaneous imaging. On the other hand, it has been shown that existing PMTs may be used when coupled to PET detectors via fiber optics and so system (1) may currently be clinically feasible. Systems (2) and (3) however would involve continued development of new radiation detection systems and in the case of (3), a complete redesign of the MRI and PET/SPECT system in order to integrate all components.
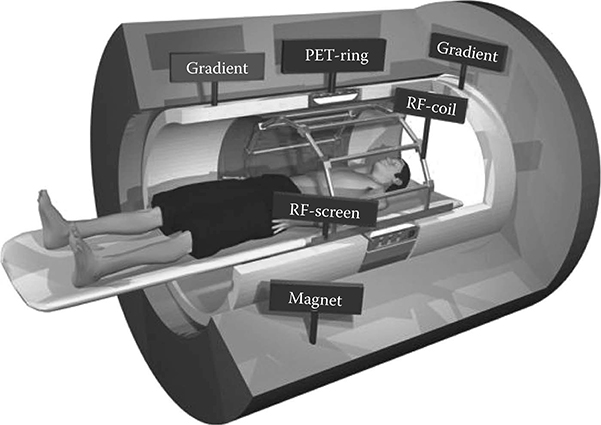
FIGURE 14.10
Theoretical integrated PET/MR system showing PET detector ring integrated into the gradient coil subsystem. This system would appear externally as a conventional MR system and be capable of whole-body PET/MR imaging. (Courtesy of Philips.com.)
Additional, consideration must be made as to where the place the various needed for the respective imaging. As mentioned, in MRI imaging the receiver RF coils are usually placed as close as possible to the patient in order to maxi-mize the SNR. In order to reduce costs and improve spatial resolution, PET or SPECT detectors must also be placed close to the patient being imaged thereby creating a conflict as to the exact placement of each detector system. It seems logical to place the RF coils closest to the patient, but the addition of these coils may introduce attenuation or scatter artifacts into the PET or SPECT data.
14.6.3 MR Attenuation Correction
As described previously, the conversion of CT numbers to linear attenuation coefficients must be performed in order to use the CT for attenuation correction [95]. While not necessarily trivial, this conversion is still rather straightforward as CT numbers do have a direct relation to photon attenuation (i.e., both related to electron density). The conversion of MR images to linear attenuation coefficient is not as straightforward, however, as MR images represent a measure of proton density and magnetic properties, not necessarily correlated to electron density. As a result, alternative approaches to derive linear attenuation coefficients must be devised.
The simplest approach is to simply segment MR images into air, soft tissue, and bone and to apply known attenuation coefficients to these regions. This technique has been successfully applied to neurological imaging [96] but does require some user intervention to aid in image segmentation. While working reasonably well for the brain, problems exist in extending this approach to the rest of the body that encompasses many more tissue types [97]. Alternative approaches have mapped MR images to standard attenuation coefficients [98] or have mapped MR to CT images in order to derive linear attenuation coeffi-cients [99]. Such techniques require additional image co-registration in order to align the patient-specific MR with a generalized atlas. As PET/MR and SPECT/MR are still relatively early on in their development, ongoing research will no doubt improve the accuracy of MR-based attenuation correction schemes [100].
14.7 Conclusions
The development of MR-compatible PET and SPECT imaging devices has rapidly increased over the past several years with the development of new radiation detectors. The recent introduction of Geiger-mode silicon photomultipliers and improved production yields of high-quality CZT crystals has meant that there are now real alternatives to PMTs and scintillators for PET and SPECT. While the development of PET/MR and SPECT/MR may seem to offer many advantages over separate systems, with continued development of these systems come other issues relating to health-care costs [101] and patient safety [102] that will need to be addressed before the mainstream clinical adoption of these technologies. Given this, it is not surprising that much of the early development on these devices has been applied to preclinical imaging [79,103,104]. Many soft-tissue tumor models cannot be adequately visualized with x-ray CT as soft-tissue contrast is not sufficient to delineate tumor from tissue. However, MRI, with its superior soft-tissue contrast, has proven itself very valuable for a lot of preclinical imaging studies. The ability to visualize the in vivo distribution of new radiotracers in the context of high-resolution, high-contrast MR imaging has provided valuable insights into drug metabolism and disease progression.

FIGURE 14.11
(See color insert.) (a) First simultaneously acquired PET/MR images from the PSAPD PET detector ring developed at UC Davis. The PET image depicts 18fluoride uptake within the skeletal system. (From Catana, C. et al., J. Nucl. Med., 47, 1968, 2006.) (b) Simultaneous acquired PET/MR image depicting 18FDG uptake in the brain of a human subject. The MR image was acquired using a FLAIR sequence and the entire MR + PET procedure was acquired in 15 min. (From Schlemmer, H.P. et al., Abdom. Imaging, 2008, http://www.SpringerLink.com)
While many technical challenges still need to be overcome before PET/MR or SPECT/MR devices are commonplace, significant progress has been made to the point where prototype systems have been developed and initial imaging studies have been performed (see Figure 14.11a and b). Already, a number of potential clinical applications have been identified that will benefit from further SPECT/MR or PET/MR development. Applications such as oncology [105], neurology [106,107], cardiology [108], abdominal imaging [109], and cell trafficking [110,111] will keep pushing the need for these devices and we will no doubt continue to see great technological strides being made.
References
1. Bailey D.L., Hutton B.F., Walker P.J., Improved SPECT using simultaneous emission and transmission tomography, J. Nucl. Med., 1987; 28 (5): 844–851.
2. Bailey D.L., Transmission scanning in emission tomography, Eur. J. Nucl. Med., 1998; 25 (7): 774–787.
3. deKemp R.A., Nahmias C., Attenuation correction in PET using single photon transmission measurement, Med. Phys., 1994; 21 (6): 771–778.
4. Celler A., Sitek A., Stoub E., Hawman P., Harrop R., Lyster D., Multiple line source array for SPECT transmission scans: Simulation, phantom and patient studies, J. Nucl. Med., 1998; 39 (12): 2183–2189.
5. Evans A.C., Marrett S., Torrescorzo J., Ku S., Collins L., MRI-PET correlation in three dimensions using a volume-of-interest (VOI) atlas, J. Cereb. Blood Flow Metab., 1991; 11 (2): A69–A78.
6. Wahl R.L., Quint L.E., Cieslak R.D., Aisen A.M., Koeppe R.A., Meyer C.R., “Anatometabolic” tumor imaging: Fusion of FDG PET with CT or MRI to localize foci of increased activity, J. Nucl. Med., 1993; 34 (7): 1190–1197.
7. Beyer T., Townsend D.W., Brun T., Kinahan P.E., Charron M., Roddy R., Jerin J., Young J., Byars L., Nutt R., A combined PET/CT scanner for clinical oncology, J. Nucl. Med., 2000; 41: 1369–1379.
8. Kinahan P.E., Townsend D.W., Beyer T., Sashin D., Attenuation correction for a combined 3D PET/CT scanner, Med. Phys., 1998; 25: 2046–2053.
9. Townsend D.W., Beyer T., Blodget T.M., PET/CT scanners: A hardware approach to image fusion, Sem. Nucl. Med., 2003; 33 (3): 193–204.
10. Lang T.F., Hasegawa B.H., Liew S.C., Brown J.K., Blankespoor S.C., Reilly S.M., Gingld E.L., Cann C.E., Description of a prototype emission-transmission computed tomography imaging system, J. Nucl. Med., 1992; 33: 1881–1887.
11. Hutton B.F., Braun M., Software for image registration: Algorithms, accuracy, efficacy, Sem. Nucl. Med., 2003; 33 (3): 180–192.
12. Pluim J.P.W., Maintz J.B.A., Viergever M.A., Mutual information based registration of medical images: A survey, IEEE Trans. Med. Imag., 2003; 22 (8): 986–1004.
13. Pluim J.P.W., Maintz J.B.A., Viergever M.A., Image registration by maximization of combined mutual information and gradient information, IEEE Trans. Med. Imag., 2000; 19 (8): 809–814.
14. Stokking R., Zubal G.I., Viergever M.A., Display of fused images: Methods, interpretation, and diagnostic improvements, Sem. Nucl. Med., 2003; 31 (3): 219–227.
15. Kinahan P.E., Hasegawa B.H., Beyer T., X-ray-based attenuation correction for positron emission tomography/computed tomography scanners, Sem. Nucl. Med., 2003; 33 (3): 166–179.
16. Carney J.P.J., Townsend D.W., Rappoport V., Bendriem B., Method for transforming CT images for attenuation correction in PET/CT imaging, Med. Phys., 1996; 33 (4): 976–983.
17. Burger C., Goerres G., Schoenes S., Buck A., Lonn A.H.R., von Schulthess G.K., PET attenuation coefficients from CT images: Experimental evaluation of the transformation of CT into PET 511-keV attenuation coefficients, Eur. J. Nucl. Med., 2002; 29: 922–927.
18. LaCroix K.J., Tsui B.M.W., Hasegawa B.H., Brown J.K., Investigation of the use of x-ray CT images for attenuation compensation in SPECT, IEEE Trans. Nucl. Sci., 1994; 41 (6): 2793–2799.
19. Pantvaidya G.H., Agarwal J.P., Deshpande M.S., Rangarajan V., Singh V., Kakade A., D'Cruz AK, PET-CT in recurrent head neck cancers: A study to evaluate impact on patient management, J. Surg. Oncol., 2009; 100 (5): 401–403.
20. Chowdhury F.U., Bradley K.M., Gleeson F.V., The role of 18F-FDG PET/CT in the evaluation of oesophageal carcinoma, Clin. Radiol., 2008; 63 (12): 1297–1309.
21. Horger M., Eschmann S.M., Pfannenberg C., Storek D., Vonthein R., Claussen C.D., Bares R., Added value of SPECT/CT in patients suspected of having bone infection: Preliminary results, Arch. Orthop. Trauma Surg., 2007; 127 (3): 211–221.
22. Nathan J., Crawford J.A., Sodee D.B., Bakale G., Fused SPECT/CT imaging of periiliopsoas infection using indium-111-labeled leukocytes, Clin. Nucl. Med., 2006; 31 (12): 801–802.
23. Ingui C.J., Shah N.P., Oates M.E., Infection scintigraphy: Added value of single-photon emission computed tomography/computed tomography fusion compared with traditional analysis, J. Comput. Assist. Tomogr., 2007; 31 (3): 375–380.
24. Bar-Shalom R., Yefremov N., Guralnik L., Keidar Z., Engel A., Nitecki S., Israel O., SPECT/CT using 67Ga and 111In-labeled leukocyte scintigraphy for diagnosis of infection, J. Nucl. Med., 2006; 47 (4): 587–594.
25. Filippi L., Schillaci O., Usefulness of hybrid SPECT/CT in 99 mTc-HMPAO-labeled leukocyte scintigraphy for bone and joint infections, J. Nucl. Med., 2006; 47 (12): 1908–1913.
26. Schepis T., Gaemperli O., Koepfli P., Namdar M., Valenta I., Scheffel H., Leschka S. , Added value of coronary artery calcium score as an adjunct to gated SPECT for the evaluation of coronary artery disease in an intermediate-risk population, J. Nucl. Med., 2007; 48 (9): 1424–1430.
27. McQuaid S.J., Hutton B.F., Sources of attenuation-correction artefacts in cardiac PET/CT and SPECT/CT, Eur. J. Nucl. Med. Mol. Imag., 2008; 35 (6): 1117–1123.
28. Le Meunier L., Maass-Moreno R., Carrasquillo J.A., Dieckmann W., Bacharach S.L., PET/CT imaging: Effect of respiratory motion on apparent myocardial uptake, J. Nucl. Cardiol., 2006; 13 (6): 821–830.
29. Saoudi A., Pepin C.M., Lecomte R., Study of light collection in multi-crystal detectors, IEEE Trans. Nucl. Sci., 2000; 47 (4); 1634–1639.
30. Yamamoto S., Kuroda K., Senda M., Scintillator selection for MR-compatible gamma detectors, IEEE Trans. Nucl. Sci., 2003; 50 (5): 1683–1685.
31. Knoll G.F., Radiation Detection and Measurement, 3rd edn., New York; Wiley, 2000.
32. Bieszk J.A., Performance changes of an anger camera in magnetic fields up to 10 G, J. Nucl. Med., 1986; 27: 1902–1907.
33. Goetz C., Breton E., Choquet P., Israel-Jost V., Constantinesco A, SPECT low-field MRI system for small-animal imaging, J. Nucl. Med., 2008; 49 (1): 88–93.
34. Gilbert K.M., Handler W.B., Scholl T.J., Odegaard J.W., Chronik B.A., Design of field-cycled magnetic resonance systems for small animal imaging, Phys. Med. Biol., 2006; 51: 2825–2841.
35. Handler W.B., Gilbert K.M., Peng H., Chronik B.A., Simulation of scattering and attenuation of 511 keV photons in a combined PET/field-cycled MRI system, Phys. Med. Biol., 2006; 51: 2479–2491.
36. Peng H., Investigation of new approaches to combined positron emission tomography and magnetic resonance imaging systems, PhD thesis, University of Western Ontario, Ottawa, Ontario, Canada, 2006.
37. Shao Y., Cherry S.R., Farahani K., Slates R., Silverman R.W., Meadors K., Bowery A., Siegel S., Development of a PET detector system compatible with MRI/NMR systems, IEEE Trans. Nucl. Sci., 1997; 44 (3): 1167–1171.
38. Haak G.M., Hammer B.E., Christensen N.L., Coupling scintillation light into optical fiber for use in a combined PET-MRI scanner, Nucl. Instrum. Meth. A, 1997; 399; 455–462.
39. Shao Y., Cherry S.R., Farahani K., Meadors K., Siegel S., Silverman R.W., Marsden P.K., Simultaneous PET and MR imaging, Phys. Med. Biol., 1997; 42: 1965–1970.
40. Lecomte R., Novel detector technology for clinical PET, Eur. J. Nucl. Med. Mol. Imag., 2009; 36 (suppl 1): S69–S85.
41. Asghar M., Imrie D.C., Silicon photodiodes as photomultiplier replacements in industrial scintillation counters, J. Phys. E Sci. Instr., 1989; 22: 1012–1015.
42. Levin C.S., Hoffman E.J., Investigation of a new readout scheme for high resolution scintillation crystal arrays using photodiodes, IEEE Trans. Nucl. Sci., 1997; 44 (3): 1208–1213.
43. 43, Groom D.E., Silicon photodiode detection of bismuth Germanate scintillation light, Nucl. Instr. Meth. A., 1984; 219: 141–148.
44. Gruber G.J., Moses W.W., Derenzo S.E., Wang N.W., Beuville E., Ho M.H., A discrete scintillation camera module using silicon photodiode readout of CsI(Tl) crystals for breast cancer imaging, IEEE Tran. Nucl. Sci., 1998; 45: 1063–1068.
45. Kataoka J., Sato R., Ikagawa T., Kotoku J., Kuramoto Y., Tsubuku Y., Saito T. , An active gain-control system for avalanche photo-diodes under moderate temperature variations, Nucl. Instr. Meth. Phys. Res. A, 2006; 564: 300–307.
46. Su Y.K., Change C.Y., Wu T.S., Temperature dependent characteristics of a PIN avalanche photodiode (APD) in Ge, Si and GaAs, Opt. Quant. Electron., 1979; 11: 109–117.
47. Hakim N.Z., Saleh B.E.A., Teich M.C., Generalized excess noise factor for avalanche photodiodes of arbitrary structure, IEEE Trans. Electron Dev., 1990; 37 (3): 599–610.
48. Lighthouse A.W., McIntyre R.J., Lecomte R., Schmitt D., A bismuth Germanate-avalanche photodiode module designed for use in high resolution positron emission tomography, IEEE Trans. Nucl. Sci., 1986; 33 (1): 456–459.
49. Marriott C.J., Cadorette J.E., Lecomte R., Scasnar V., Rousseau J., van Lier J.E., High resolution PET imaging and quantitation of pharmaceutical biodistributions in a small animal using avalanche photodiode detectors, J. Nucl. Med., 1994; 35: 1390–1397.
50. Lecomte R., Cadorette J., Rodrigue S., Lapointe D., Rouleau D., Bentourkia M., Yao R., Msaki P., Initial results from the Sherbrooke avalanche photodiode positron tomograph, IEEE Trans. Nucl. Sci., 1996; 43 (3): 1952–1957.
51. Lecomte R., Cadorette J., Jouan A., Heon M., Rouleau D., Gauthier G., High resolution positron emission tomography with a prototype camera based on solid state scintillation detectors, IEEE Trans. Nucl. Sci., 1990; 37 (2): 805–811.
52. Cadorette J., Rodrigue S., Lecomte R., Tuning of avalanche photodiode PET camera, IEEE Trans. Nucl. Sci., 1993; 40 (4): 1062–1066.
53. Fontaine R., Belanger F., Viscogliosi N., Semmaoui H., Tetrault M.A., Michaud J.B., Pepin C., Cadorette J., Lecomte R., The hardware and signal processing architecture of LabPET™, a small animal APD-based digital PET scanner, IEEE Trans. Nucl. Sci., 2009; 56 (1): 3–9.
54. Pichler B.J., Judenhofer M.S., Catana C., Walton J.H., Kneilling M., Nutt R.E., Siegel S.B., Claussen C.D., Cherry S.R., Performance test of an LSO-APD detector in a 7-T MRI scanner for simultaneous PET/MRI, J. Nucl. Med., 2006; 47: 639–647.
55. Pichler B.J., Swann B.K., Rochelle J., Nutt R.E., Cherry S.R., Siegel S.B., Lutetium oxy-orthosilicate block detector readout by avalanche photodiode arrays for high resolution animal PET, Phys. Med. Biol., 2004; 49: 4305–4319.
56. Ziegler S.I., Pichler B.J., Boening G., Rafecas M., Pimpl W., Lorenz E., Schmitz N., Schwaiger M., A prototype high-resolution animal positron tomograph with avalanche photodiode arrays and LSO crystals, Eur. J. Nucl. Med. Mol. Imag., 2001; 28 (2): 136–143.
57. Shah K.S., Farrell R., Grazioso R., Harmon E.S., Karplus E., Position-sensitive avalanche photodiodes for gamma-ray imaging, IEEE Trans. Nucl. Sci., 2002; 49 (4): 1687–1692.
58. Dokhale P.A., Silverman R.W., Shah K.S., Grazioso R., Farrell R., Glodo J., McClish M.A., Entine G., Tran V.-H., Cherry S.R., Performance measurements of a depth-encoding PET detector module based on position-sensitive avalanche photodi-ode read-out, Phys. Med. Biol., 2004; 49: 4293–4303.
59. Levin C.S., Foudray A.M.K., Olcott P.D., Habte F., Investigation of position sensitive avalanche photodiodes for a new high-resolution PET detector design, IEEE Trans. Nucl. Sci., 2004; 51 (3): 805–810.
60. Burr K.C., Ivan A., LeBlanc J., Zelakiewicz S., McDaniel D.L., Kim C.L., Ganin A. , Evaluation of a position sensitive avalanche photodiode for PET, IEEE Trans. Nucl. Sci., 2003; 50 (4): 792–796.
61. Després P., Funk T., Shah K.S., Hasegawa B.H., Monte Carlo simulations of compact gamma cameras based on avalanche photodiodes, Phys. Med. Biol., 2007; 52 (11): 3057–3074.
62. Catana C., Wu Y., Judenhofer M.S., Qi J., Pichler B.J., Cherry S.R., Simultaneous acquisition of multislice PET and MR images: Initial results with a MR-compatible PET scanner, J. Nucl. Med., 2006; 47: 1968–1976.
63. Mackewn J.E., Struhl D., Hallett W.A., Halstead P., Page R.A., Keevil S.F., Williams S.C.R., Cherry S.R., Design and development of an MR-compatible PET scanner for imaging small animals, IEEE Trans. Nucl. Sci., 2005; 52 (5): 1376–1380.
64. Judenhofer M.S., Catana C., Swann B.K., Siegel S.B., Jung W., Nutt R.E., Cherry S.R., Claussen C.D., Pichler B.J., PET/MR images acquired with a compact MR-compatible PET detector in a 7-T magnet, Radiology, 2007; 244 (3): 807–814.
65. Catana C., Procissi D., Wu Y., Judenhofer M.S., Qi J., Pichler B.J., Jacobs R.E., Cherry S.R., Simultaneous in vivo positron emission tomography and magnetic resonance imaging, Proc. Natl. Acad. Sci. U S A, 2008; 105 (10): 3705–3710.
66. Aull B.F., Loomis A.H., Young D.J., Heinrichs R.M., Felton B.J., Daniels P.J., Landers D.J., Geiger-mode avalanche photodiodes for three-dimensional imaging, Lincoln Lab. J., 2002; 13 (2): 335–350.
67. Pellion D., Borrel V., Esteve D., Therez F., Bony F., Bazer-Bachi A.R., Gardou J.P., APD detectors in the Geiger photon counter mode, Nucl. Instr. Meth. Phys. Res. A, 2006; 567: 41–44.
68. Renker D., Geiger-mode avalanche photodiodes, history, properties and problems, Nucl. Instr. Meth. Phys. Res. A, 2006; 567: 48–56.
69. Musienko Y., Reucroft S., Swain J., The gain, photon detection efficiency and excess noise factor of multi-pixel Geiger-mode avalanche photodiodes, Nucl. Instr. Meth. Phys. Res. A, 2006; 567: 57–61.
70. Nassalski A., Moszynski M., Syntfeld-Kazuch A., Szczesniak T., Swiderski L., Wolski D., Batsch T., Baszak J., Silicon photomultiplier as an alternative for APD in PET/MRI applications, IEEE Med. Imag. Conf. Rec., Dresden, Germany, 2008; pp. 1620–1625.
71. Llosa G., Battiston R., Belcari N., Boscardin M., Collazuol G., Corsi F., Dalla Betta G-F , Novel silicon photomultipliers for PET applications, IEEE Trans. Nucl. Sci., 2008; 55 (3): 877–881.
72. Herbert D.J., Saveliev V., Belcari N., D'Ascenzo N., Del Guerra A., Golovin A., First results of scintillator readout with silicon photomultiplier, IEEE Trans. Nucl. Sci., 2006; 53 (1): 389–394.
73. Buzhan P., Dolgoshein B., Filatov L., Ilyin A., Kaplin V., Karakash A., Klemin S. , Large area silicon photomultipliers: Performance and applications, Nucl. Instr. Meth. Phys. Res. A, 2006; 567: 78–82.
74. Otte A.N., Barral J., Dolgoshein B., Hose J., Klemin S., Lorenz E., Mirzoyan R., Popova E., Teshima M., A test of silicon photomultipliers as readout for PET, Nucl. Instr. Meth. Phys. Res. A, 2005; 545: 705–715.
75. Di Domenico G., Zavattini G., Cesca N., Auricchio N., Andritschke R., Schopper F., Kanbach G., SiliPET: An ultra-high resolution design of a small animal PET scanner based on stacks of double-sided silicon strip detector, Nucl. Instr. Meth. Phys. Res. A, 2007; 571: 22–25.
76. Drezet A., Monnet O., Mathy F., Montemont G., Verger L., CdZnTe detectors for small field of view positron emission tomographic imaging, Nucl. Instr. Meth. Phys. Res. A, 2007; 571: 465–470.
77. Depres P., Izaguirre E.W., Liu S., Cirignano L.J., Kim H., Wendland M.F., Shah K.S., Hasegawa B.H., Evaluation of a MR-compatible CZT detector, IEEE Med. Imag. Conf. Rec., Honolulu, HI, 2007; pp. 4324–4326.
78. Wagenaar D.J., Nalcioglu O., Muftuler L.T., Szawlowski M., Kapusta M., Pavlov N., Meier D., Maehlum G., Patt B., Development of MRI-compatible nuclear medicine imaging detectors, IEEE Med. Imag. Conf. Rec., San Diego, CA, 2006; pp. 1825–1828.
79. Azman S., Gjaerum J., Meier D., Muftuler L.T., Maehlum G., Nalcioglu O., Patt B.E. , A nuclear radiation detector system with integrated readout for SPECT/MR small animal imaging, IEEE Med. Imag. Conf. Rec., Honolulu, HI, 2007; pp. 2311–2317.
80. Szeles C., Cameron S.E., Ndap J.O., Chalmers W.C., Advances in the crystal growth of semi-insulating CdZnTe for radiation detector applications, IEEE Trans. Nucl. Sci., 2002; 49 (5): 2535–2540.
81. Chen H., Awadalla S.A., Mackenzie J., Redden R., Bindley G., Bolotnikov A.E., Camarda G.S., Carini G., James R.B., Characterization of traveling heater method (THM) grown Cd0.9Zn0.1Te crystals, IEEE Trans. Nucl. Sci., 2007; 54 (4): 811–816.
82. Awadalla S.A., Chen H., Mackenzie J., Lu P., Iniewski K., Marthandam P., Redden R. , Thickness scalability of large volume cadmium zinc telluride high resolution radiation detectors, IEEE Med. Imag. Conf. Rec., Dresden, Germany, 2008; pp. 58–62.
83. Strul D., Cash D., Keevil S.F., Williams S.C.R., Marsden P.K., Gamma shielding materials for MR-compatible PET, IEEE Trans. Nucl. Sci., 2003; 50 (1): 60–69.
84. Jiles D., Introduction to Magnetism and Magnetic Materials, CRC Press, Boca Raton, FL, 1998.
85. Schenck J.F., The role of magnetic susceptibility in magnetic resonance imaging: MRI magnetic compatibility of the first and second kinds, Med. Phys., 1996; 23 (6): 815–850.
86. Ludeke K.M., Roschmann P., Tischler R., Susceptibility artefacts in NMR imaging, Magn. Reson. Imaging, 1985; 3: 329–343.
87. Bakker C.J.G., Bhagwandien R., Moerland M.A., Fuderer M., Susceptibility artifacts in 2DFT spin-echo and gradient echo imaging—The cylinder model revisited, Magn. Reson. Imaging, 1993; 11: 539–548.
88. Camacho C.R., Plewes D.B., Henkelman R.M., Nonsusceptibility artifacts due to nonmetallic objects in MR imaging, J. Magn. Reson. Imaging, 1995; 5: 75–88.
89. Wirrwar A., Vosberg H., Herzog H., Halling H., Weber S., Muller-Gartner H., 4.5 Tesla magnetic field reduces range of high-energy positrons—Potential implications for positron emission tomography, IEEE Trans. Nucl. Sci., 1997; 44 (2): 184–189.
90. Raylmann R.R., Hammer B.E., Christensen N.L., Combined MRI-PET scanner: A Monte Carlo evaluation of the improvements in PET resolution due to the effects of a static homogeneous magnetic field, IEEE Trans. Nucl. Sci., 1996; 43: 2406–2412.
91. Rowe R., Aarsvold J.N., Barrett H.H., Chen J.C., Klien W.P., Moore B.A., Pang I.W., Patton D.D., White T.A., A stationary hemispherical SPECT imager for three-dimensional brain imaging, J. Nucl. Med., 1993; 34: 474–480.
92. Goertzen A.L., Jones D.W., Seidel J., Li K., Green M.V., First results from the high-resolution mouseSPECT annular scintillation camera, IEEE Trans. Med. Imaging, 2005; 24 (7): 863–867.
93. Genna S., Smith A.P., The development of ASPECT, an annular single crystal brain camera for high efficiency SPECT, IEEE Trans. Nucl. Sci., 1988; 35 (1): 654–658.
94. Delso G., Ziegler S., PET/MRI system design, Eur. J. Nucl. Med. Mol. Imaging, 2009; 36: S86–S92.
95. Zaidi H., Is MR-guided attenuation correction a viable option for dual-modality PET/MR imaging? Radiology, 2007; 244 (3): 639–642.
96. Zaidi H., Montandon M., Slosman D.O., Magnetic resonance imaging-guided attenuation and scatter corrections in three-dimensional brain positron emission tomography, Med. Phys., 2003; 30 (5): 937–948.
97. Beyer T., Weigert M., Quick H.H., Pietrzyk U., Vogt F., Palm C., Antoch G., Muller S.P., Bockisch A., MR-based attenuation correction for torso-PET/MR imaging: Pitfalls in mapping MR to CT data, Eur. J. Nucl. Med. Mol. Imaging, 2008; 35: 1142–1146.
98. Hofmann M., Pichler B.J., Scholkopf B., Beyer T., Towards quantitative PET/MRI: A review of MR-based attenuation correction techniques, Eur. J. Nucl. Med. Mol. Imaging, 2009; 36 (suppl 1): S93–104.
99. Hofman M., Steinke F., Scheel V., Charpiat G., Farquhar J., Aschoff P., Brady M., Scholkopf, Pichler B.J., MRI-based attenuation correction for PET/MRI: A novel approach combining pattern recognition and atlas registration, J. Nucl. Med., 2008; 49: 1875–1883.
100. Kops E.R., Herzog H., Alternative methods for attenuation correction for PET images in MR-PET scanners, IEEE Med. Imag. Conf. Rec., Honolulu, HI, 2007; pp. 4327–4330.
101. Goyen M., Debatin J.F., Healthcare costs for new technologies, Eur. J. Nucl. Med. Mol. Imaging, 2009; 36 (suppl 1): S139–S143.
102. Brix G., Nekolla E.A., Nosske D., Griebel J., Risks and safety aspects related to PET/MR examinations, Eur. J. Nucl. Med. Mol. Imaging, 2009; 36 (suppl 1): S131–S138.
103. Wehrl H.F., Judenhofer M.S., Wiehr S., Pichler B.J., Pre-clinical PET/MR: Technological advances and new perspectives in biomedical research, Eur. J. Nucl. Med. Mol. Imaging, 2009; 36 (suppl 1): S56–S68.
104. Cherry S.R., Louie A.Y., Jacobs R.E., The integration of positron emission tomography with magnetic resonance imaging, Proc. IEEE, 2008; 96 (3): 416–438.
105. Antoch G., Bockisch A., Combined PET/MRI: A new dimension in whole-body oncology imaging? Eur. J. Nucl. Med. Mol. Imaging, 2009; 36 (suppl 1): S113–S120.
106. Heiss W.D., The potential of PET/MR for brain imaging, Eur. J. Nucl. Med. Mol. Imaging, 2009; 36 (suppl 1): S105–S112.
107. Schlemmer H., Pichler B., Wienhard K., Schmand M., Nahmias C., Townsend D. , Simultaneous MR/PET for brain imaging: First patient scans, J. Nucl. Med., 2007; 48 (6): 45P.
108. Nekolla S.G., Matinez-Moeller A., Saraste A., PET and MRI in cardiac imaging: From validation studies to integrated applications, Eur. J. Nucl. Med. Mol. Imaging, 2009; 36 (suppl 1): S121–S130.
109. Schlemmer H.P., Pichler B.J., Krieg R., Heiss W.D., An integrated MR/PET system: Prospective applications, Abdom. Imaging, 2008; http://www.SpringerLink.com
110. Qiao H., Zhang H., Zheng Y., Ponde D.E., Shen D., Gao F., Bakken A.B. , Embryonic stem cell grafting in normal and infracted myocardium: Serial assessment with MR imaging and PET dual detection, Radiology, 2009; 250 (3): 821–829.
111. Lee H.Y., Li Z., Chen K., Hsu A.R., Xu C., Xie J., Sun S., Chen X., PET/MRI dual-modality tumor imaging using arginine-glycine-aspartic (RGD)-conjugated radiolabeled iron oxide nanoparticles, J. Nucl. Med., 2008; 49 (8): 1371–1379.