
- Mastering Clojure Data Analysis
- Table of Contents
- Mastering Clojure Data Analysis
- Credits
- About the Author
- About the Reviewers
- www.PacktPub.com
- Preface
- 1. Network Analysis – The Six Degrees of Kevin Bacon
- 2. GIS Analysis – Mapping Climate Change
- 3. Topic Modeling – Changing Concerns in the State of the Union Addresses
- 4. Classifying UFO Sightings
- 5. Benford's Law – Detecting Natural Progressions of Numbers
- 6. Sentiment Analysis – Categorizing Hotel Reviews
- 7. Null Hypothesis Tests – Analyzing Crime Data
- Introducing confirmatory data analysis
- Understanding null hypothesis testing
- Understanding burglary rates
- Exploring the data
- Conducting the experiment
- Formulating an initial hypothesis
- Stating the null and alternative hypotheses
- Identifying the statistical assumptions in the sample
- Determining which tests are appropriate
- Selecting the significance level
- Determining the critical region
- Calculating the test statistic and its probability
- Deciding whether to reject the null hypothesis or not
- Interpreting the results
- Summary
- 8. A/B Testing – Statistical Experiments for the Web
- 9. Analyzing Social Data Participation
- Setting up the project
- Understanding the analyses
- Understanding social network data
- Understanding knowledge-based social networks
- Introducing the 80/20 rule
- Matching the 80/20 rule
- Looking for the 20 percent of questioners
- Looking for the 20 percent of respondents
- Combining ranks
- Finding the up-voted answers
- Processing the answers
- Setting up
- Training sets and Test sets
- Evaluating the outcome
- Summary
- Setting up the project
- 10. Modeling Stock Data
- Index
Now that we have some hold on the textual data, let's turn our attention to the stock prices. Previously, we loaded it from the CSV file using the financial.csv-data/read-stock-prices function. Let's reload that data with the following commands:
user=> (def stock (csvd/read-stock-prices "d/d-1995-2001.csv"))
user=> (count stock)
1263
Let's start with a graph that shows how the closing price has changed over the years:
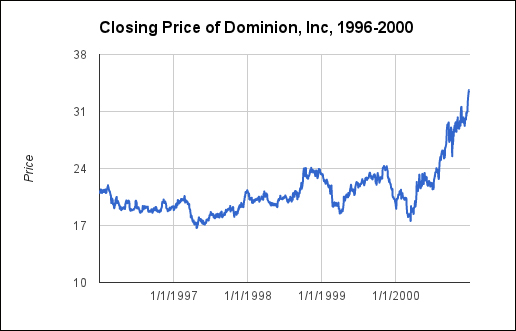
So the price started in the low 30s, fluctuated a bit, and finished in the low 20s. During that time, there were some periods where it climbed rapidly. Hopefully, we'll be able to capture and predict those changes.
-
No Comment
..................Content has been hidden....................
You can't read the all page of ebook, please click here login for view all page.