
Social networks and websites have revolutionized the Internet. Most people online participate in some social network, either it's Facebook, Twitter, Pinterest, GitHub, StackOverflow, or any of the zillion other social networking websites that have sprung up. They're an important way for people to connect and stay in contact, but they're also a major source of data about people's relationships and activities.
Analyzing this data is important for a number of reasons. Of course, advertisers and marketers want to squeeze as much information out of the data as they can. But if you're running the social network, you'll want to analyze the data to figure out what's working and what's falling flat. You want to ask yourself constantly what you can do to engage users better and to make your social network a more compelling, enjoyable, or useful experience for your users.
Over the course of this chapter, we'll get an open data dump from the StackExchange (http://stackexchange.com) website. This includes StackOverflow (http://stackoverflow.com/) and a host of other question-and-answer sites. We'll analyze this in a number of different ways and try to learn both about how people interact and generate content on those sites and about what makes a good answer.
The following are the topics we are going to cover in this chapter:
- Understanding the analyses we can perform
- Getting the data
- Finding patterns of participation
- Comparing askers and answerers
- Finding participation patterns over time
- Finding up-voted answers
- Tagging questions automatically
Before we get started, let's set up the project. I've done this using Leiningen 2 (http://leiningen.org/) and Stuart Sierra's reloaded project template (https://github.com/stuartsierra/reloaded). I named the project social-so by running the following code:
$ lein new reloaded social-so
Of course, we'll need more dependencies. The following is the project.clj file for this chapter:
(defproject social-so "0.1.0-SNAPSHOT"
  :dependencies [[org.clojure/clojure "1.5.1"]
                 [org.clojure/data.xml "0.0.7"]
                 [org.codehaus.jsr166-mirror/jsr166y "1.7.0"]
                 [org.clojure/data.json "0.2.4"]
                 [cc.mallet/mallet "2.0.7"]
                 [org.jsoup/jsoup "1.7.3"]]
  :profiles {:dev {:dependencies
                   [[org.clojure/tools.namespace "0.2.4"]]
                   :source-paths ["dev"]}}
  :jvm-opts ["-Xmx2048m"])
The highlights here are that we'll use org.clojure/data.xml to read XML files, org.clojure/data.json to read JSON, and org.jsoup/jsoup to clean up HTML. If you're still using Java 6, you'll need jsr166y to provide concurrency with the reducers library. And we'll use cc.mallet/mallet to handle some Naïve Bayesian classification.
Now that we have the infrastructure out of the way, let's step back and think about what kind of data we have and what we can do with it.
Social networks come in two broad kinds:
- There are networking-oriented social networks. These include the usual subjects, such as Facebook (http://facebook.com), LinkedIn (http://linkedin.com), Twitter (http://twitter.com/), or Sina Weibo (http://weibo.com). These focus on allowing people to connect with each other, build relationships, and post updates about themselves.
- There are knowledge-sharing-oriented social networks. These include the StackExchange (http://stackexchange.com) family of social networks, including StackOverflow (http://stackoverflow.com) or Quora (https://www.quora.com/). These focus on allowing people to exchange information and knowledge. Usually, they are more structured and focused on questions and answers than web forums or wikis.
Obviously, these networks enable entirely different kinds of interactions and have different features and produce different kinds of data. Different kinds of analyses are appropriate.
In knowledge-based social networks, people come together to share information. Often, these are question-and-answer forums, such as the StackExchange network of sites, but also on Quora (https://www.quora.com/), Yahoo Answers (http://answers.yahoo.com/), and so on.
Generally, in this genre of social network, some users post questions. Others answer them. There's usually some kind of in-site economy, whether it's represented by badges, points, or some combination. This encourages people to keep both questions and answers on topic, to answer questions, and to set and maintain the community's tone. Sometimes, there are moderators, sometimes the communities are self-moderated, and sometimes there's a combination of the two.
Looking at the front page of StackOverflow, we can see the basic elements of the social network. Look at the following screenshot:
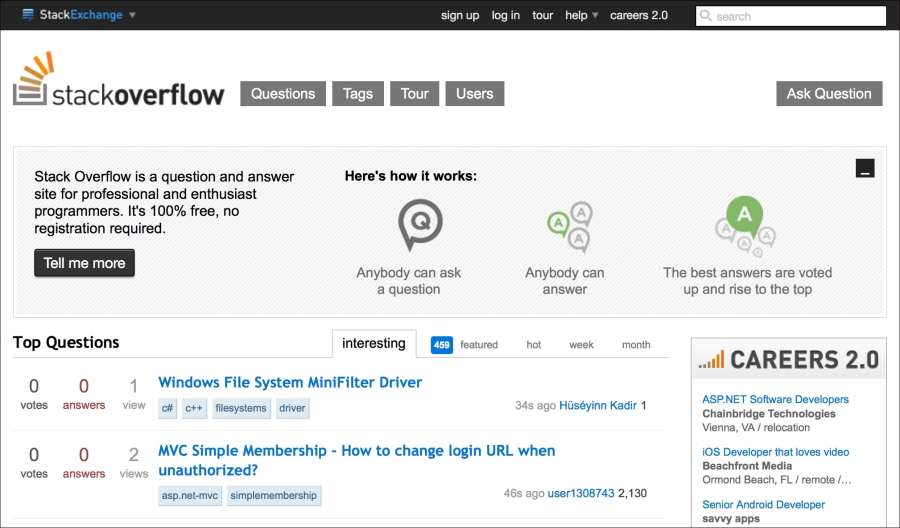
The preceding screenshot depicts a very interesting layout. You can easily notice the following two things:
- There's a button labeled Ask Question at the upper right-hand side for posting a question. This isn't as large as you might expect, since those asking questions are presumably motivated to find the button and are willing to click through into another page to do it. This is different than the posting boxes found on sites such as Facebook or Twitter, where they try to reduce the friction for posting new statuses in order to encourage people to do it.
- There is also a list of recently posted questions. This can be filtered to display tags that you're interested in. For example, you can use this to find either questions that you are qualified to answer or those you are interested in learning about yourself.
So we can see immediately that the primary interactions of the site are accessible from the front page. Also, the site's design makes it easier to do the more difficult interaction (answering questions).
We can already guess that most users will join to post only one or two questions and never participate on the site again. This group may potentially be quite large. Who those users are and how to motivate them to answer questions may be one critical question that StackExchange has.
There may also be a similar dynamic among the users who do answer questions. There are probably a small number of users who answer most of the questions. StackExchange may be interested in how to get contributions more evenly from all users, not just from a few power users.
In fact, both of these observations are examples of the general principle of social networks. This has been called the 80/20 rule. This simply states that approximately 80 percent of the content will be created by 20 percent of the users. It's also known as the Pareto Principle, which states more generally that 80 percent of the effects come from 20 percent of the causes. Although in different social networks, the details may be off—for example, 15 percent of the users may create 95 percent of the content—in general this observation is surprisingly robust. One of the things that we'll look at in this chapter is exactly how the 80/20 rule applies to the StackOverflow data.
With this in mind, let's get the data so we can start looking at it.
In this chapter, we're going to focus on knowledge-based social networks, and in particular, we'll work with the StackExchange sites. For some time, StackExchange has made public a periodic data dump of their sites (http://blog.stackexchange.com/category/cc-wiki-dump/). This will provide a great test bed for working with a social network site's data.
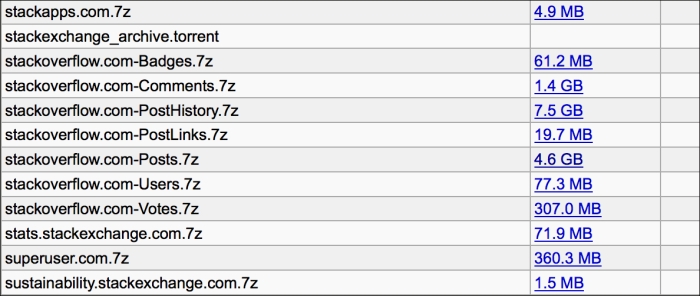
The data dump is made available through the Internet Archive (https://archive.org/). The webpage for that is currently at https://archive.org/details/stackexchange. You can download the entire dump using a BitTorrent client (http://www.bittorrent.com/) such as μTorrent (http://www.utorrent.com/). However, we're only interested in the StackOverflow posts and comments, so if you'd like, you can just download those two archives. Of course, combined they're about 6 GB, so the torrent may make the most sense, anyway.
The archived files are compressed using the 7z format. Windows users can get a utility for extracting this from the 7-zip site (http://www.7-zip.org/). That site's download page also has links to some unofficial binaries for Mac OS X and Linux (http://www.7-zip.org/download.html). Both of these platforms also have command-line binaries available. For example, Homebrew (http://brew.sh/) has a recipe for this named p7zip.
Extract this data into your project directory, into a subdirectory named data, using the following lines of code:
cd data
7z x ~/torrents/stackexchange/stackoverflow.com-Posts.7z
Now we're ready to start digging into the data and see what surprises it has for us.
First, we need to see how much data there will be. The raw archive for this part of the data is about 6 GB. Not insignificant, but it's not petabytes, either.
So the compressed file is almost 5 GB, and the expanded file is 23 GB! We have a lot of data to look at.
All of the files are in XML format. The file labeled Posts contains both the questions and the answers.
The format of the data is fairly simple (but for a full description, see the README.txt file). The following is the first entry:
<row Id="4"
PostTypeId="1"
AcceptedAnswerId="7"
CreationDate="2008-07-31T21:42:52.667"
Score="251"
ViewCount="15207"
Body="<p>I want to use a track-bar to change a form's opacity.</p>
<p>This is my code:</p>
<pre><code>decimal trans = trackBar1.Value / 5000;
this.Opacity = trans;
</code></pre>
<p>When I try to build it, I get this error:</p>
<blockquote>
<p>Cannot implicitly convert type 'decimal' to 'double'.</p>
</blockquote>
<p>I tried making <strong>trans</strong> to <strong>double</strong>, but then the control doesn't work.This code has worked fine for me in VB.NET in the past. </p>
"
OwnerUserId="8"
LastEditorUserId="2648239"
LastEditorDisplayName="Rich B"
LastEditDate="2014-01-03T02:42:54.963"
LastActivityDate="2014-01-03T02:42:54.963"
Title="When setting a form's opacity should I use a decimal or double?"
Tags="<c#><winforms><forms><type-conversion><opacity>"
AnswerCount="13"
CommentCount="25"
FavoriteCount="23"
CommunityOwnedDate="2012-10-31T16:42:47.213" />As we can see from README.txt, this post represents a question (the PostTypeId field is 1). We can see its body, its tags, and its accepted answer, as well as a lot of the metadata about this post. This should give us plenty to go on.
If we look at the third entry, we'll see one of the accepted answers for this post, as follows:
<row Id="7"
PostTypeId="2"
ParentId="4"
CreationDate="2008-07-31T22:17:57.883"
Score="193"
Body="<p>An explicit cast to double isn't necessary.</p>
<pre><code>double trans = (double)trackBar1.Value / 5000.0;
</code></pre>
<p>Identifying the constant as <code>5000.0</code> (or as <code>5000d</code>) is sufficient:</p>
<pre><code>double trans = trackBar1.Value / 5000.0;
double trans = trackBar1.Value / 5000d;
</code></pre>
"
OwnerUserId="9"
LastEditorUserId="967315"
LastEditDate="2012-10-14T11:50:16.703"
LastActivityDate="2012-10-14T11:50:16.703"
CommentCount="0" />So, for answers (the PostTypeId field is 2), we can get their parents, their body texts, and their scores. Their parents indicate which child was accepted. This should be enough to help us analyze their content.
In both cases, we also have OwnerUserId, and this will help us understand how people interact with the site and with each other.
The text-field attributes allow rich content (Body and Title), and these are handled by encoding HTML into the fields. We'll need to escape those and probably scrub out the tags. That won't be a problem, but we'll need to keep it in mind.
We can trace out some of the data that we'll need to use throughout this chapter. We can put these into the src/social_so/data.clj file.
We'll use two record types. The CountRank type will hold together a raw count and its rank in the list of frequencies, and the UserInfo type will store the user and the frequencies and ranks for the different types of posts that they've made. Look at the following code:
(defrecord CountRank [count rank])
(defrecord UserInfo [user post q a])
The post, q, and a fields will keep track of the frequencies and rank by all posts, by question posts, and by answer posts.
Together, these record structures should help us get a start in understanding this data and some of the patterns of participation.
For loading the data, let's move to a new file, named src/social_so/xml.clj, and let's give it the following namespace declaration:
(ns social-so.xml
  (:require [clojure.data.xml :as xml]
            [clojure.java.io :as io]
            [clojure.string :as str]
            [social-so.data :as d]
            [social-so.utils :as u])
  (:import [org.jsoup Jsoup]
           [org.jsoup.safety Whitelist]))
We'll use the functions in this namespace to read the XML file and build the records containing the data.
At the most basic level, we need to be able to read the post elements from the XML file. Look at the following code:
(defn read-posts [stream] (:content (xml/parse stream)))
We'll also need to access a little bit of data from each element. The following are some getter functions for an identifier for the user and for the post type code:
(defn get-user [el]
  (let [{:keys [attrs]} el]
    (or (u/->long (:OwnerUserId attrs))
        (u/to-lower (:OwnerDisplayName attrs)))))
(defn get-post-type [el]
  (u/->long (:PostTypeId (:attrs el))))
In this snippet, el represents the XML element being processed, and we're using a custom function to lowercase the string (social-so.utils/to-lower) to be a little defensive about being passed null values.
Loading the data from the XML files will take place in two stages. First, we'll get the raw frequencies, and then we'll sort the data several different ways and assign ranks to the data.
The way that we'll count the frequencies is to walk over the posts in the XML file. We'll maintain an index of the users with their UserInfo records. The first time each user is found, they will get a new UserInfo object. Subsequently, their UserInfo record will be updated with new counts.
Let's see how this works in practice.
The first function, update-user-info, operates on the level of a single record. It takes a UserInfo record and updates it based on the type of post currently being processed. If the record is nil, then a new one is created follows:
(defn update-user-info [user-id post-el user-info]
  (let [incrs {:question [1 0], :answer [0 1]}
        [q-inc a-inc] (incrs (get-post-type post-el))]
    (cond
      (nil? q-inc) user-info
      (nil? user-info) (d/->UserInfo user-id 1 q-inc a-inc)
      :else
      (assoc user-info
             :post (inc (:post user-info))
             :q (+ (:q user-info) q-inc)
             :a (+ (:a user-info) a-inc)))))
The next function operates at the level of the index from user-id to UserInfo records. It takes an XML post, and it gets the user's information from it. It tries to retrieve the UserInfo record for that user from the index, and it uses update-user-info to increment the counts in that record. Look at the following code:
(defn update-user-index [user-index post-el]
  (let [user (get-user post-el)]
    (->> user
      (get user-index)
      (update-user-info user post-el)
      (assoc user-index user))))
Finally, load-user-infos opens the XML file, reads in the posts, and counts the raw frequencies of the posts for each user. Finally, it forces the result with doall, because we're working inside of a with-open block, so we'll want to have the results fully realized before we close the file. Look at the following code:
(defn load-user-infos [filename]
  (with-open [s (io/input-stream filename)]
    (->> s
      read-posts
      (reduce update-user-index {})
      vals
      (remove nil?)
      doall)))
Now we're ready to walk over these, multiple times, and assign ranks based on the various counts.
Currently, we're storing the raw frequency under the UserInfo records' fields. However, we want to move the frequencies into a CountRank record and store the rank alongside it. We will achieve this by performing the following steps:
- We'll find the rank using the
rank-onfunction. This sorts by one of the properties of theUserInforecords (:post,:q, or:a) and then associates each instance with a rank by containing both within a vector pair. Look at the following code:(defn rank-on [user-property coll] (->> coll (sort-by user-property) reverse (map vector (range)))) - The function
update-rankwill then take the rank-and-user pair fromrank-onand associate it with the appropriate property, as follows:(defn update-rank [user-property rank-info] (let [[rank user-info] rank-info] (assoc user-info user-property (d/->CountRank (get user-info user-property) rank)))) - The next function,
add-rank-data, coordinates this process by calling these functions on all users. And the function controlling this process,add-all-ranks, does this on each user as follows:(defn add-rank-data [user-property users] (map #(update-rank user-property %) (rank-on user-property users))) (defn add-all-ranks [users] (->> users (add-rank-data :post) (add-rank-data :q) (add-rank-data :a))) - We can combine reading the XML file and counting the posts with sorting and ranking the users. Look at the following code:
(defn load-xml [filename]
  (add-all-ranks (load-user-infos filename)))
All of these functions make it simple to load the XML file and to assign the ranks. Look at the following code:
user=> (def users (x/load-xml
                    "data/stackoverflow.com-Posts"))
user=> (count users)
1594450
user=> (first users)
{:user 22656,
 :post {:count 28166, :rank 0},
 :q {:count 29, :rank 37889},
 :a {:count 28137, :rank 0}}
Now we have the information that we'll need to perform the first round of analyses.
Now that we have some data loaded, let's roll up our sleeves and see what we can learn from it.
Before we do, however, it would be nice to have some way to generate reports of which users are the most active for each type of post. Look at the following code:
(defn print-top-rank [col-name key-fn n users]
  (let [fmt "%4s   %6s   %14s
"
        sort-fn #(:rank (key-fn %))]
    (printf fmt "Rank" "User" col-name)
    (printf fmt "----" "------" "--------------")
    (doseq [user (take n (sort-by sort-fn users))]
      (let [freq (key-fn user)]
        (printf fmt (:rank freq) (:user user) (:count freq))))))
This allows us to create tables listing the top 10 (or so) users for each post type.
|
Rank |
User |
All Posts |
|---|---|---|
|
0 |
22656 |
28166 |
|
1 |
29407 |
20342 |
|
2 |
157882 |
15444 |
|
3 |
17034 |
13287 |
|
4 |
34397 |
13209 |
|
5 |
23354 |
12312 |
|
6 |
115145 |
11806 |
|
7 |
20862 |
10455 |
|
8 |
57695 |
9730 |
|
9 |
19068 |
9560 |
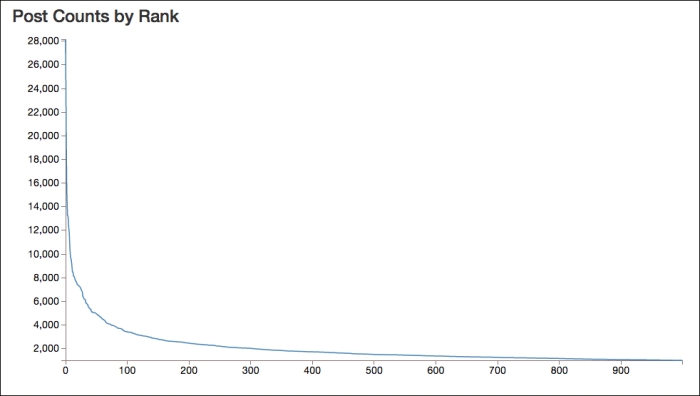
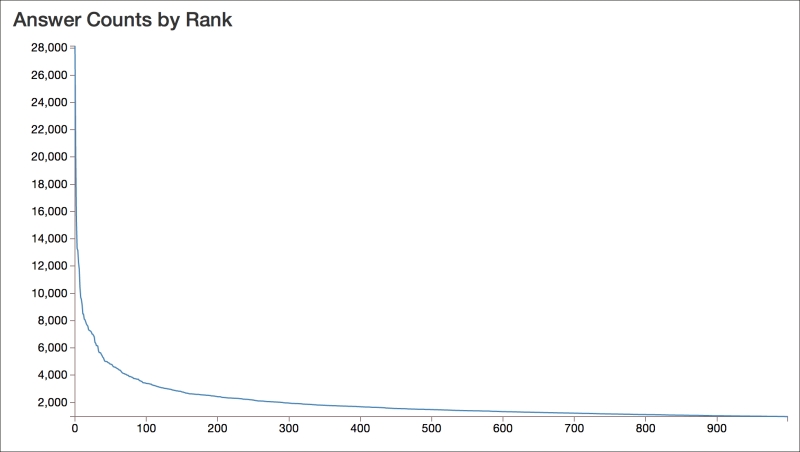
Based on this table, we can see that some users are very active. The top user has almost 8,000 more posts than the second most active user, who is still very, very active.
The following graph, of the post counts of the top 1,000 users, shows how quickly the activity falls off and how much the top users dominate the conversation:
We can break this down further, however. I would expect the people who post questions to behave differently than the people who post answers.
Previously, we talked about the 80/20 rule: that 80 percent of the content is created by 20 percent of the users. That's obviously a rough estimate, but it does provide a good intuition for the dynamics of these networks.
To find the break-down, we need to perform the following steps:
To implement this, we can use a function named quantile-on, which sorts a collection and breaks it into the buckets. Look at the following code:
(defn quantile-on [n key-fn coll]
  (let [len (count coll)
        part-size (+ (quot len n)
                     (if (zero? (mod len n)) 0 1))]
    (partition-all part-size (sort-by key-fn coll))))
Now we just need to pull out the appropriate fields and sum their values, as follows:
(defn sum-count
  ([key-fn] (partial sum-count key-fn))
  ([key-fn coll]
   (->> coll
     (map #(:count (key-fn %)))
     (remove nil?)
     (reduce + 0))))We can use these functions to find the percentage of users in each quintile:
user=> (def p-counts
            (map (d/sum-count :post)
                 (d/quantile-on 5 #(:rank (:post %)) users)))
user=> p-counts
(15587701 1282402 507654 318890 318828)
user=> (def total (reduce + 0 p-counts))
user=> (map #(float (/ % total)) p-counts)
(0.8652395 0.07118336 0.028178774 0.017700894 0.017697452)
So the top 20 percent of users actually produce more than 85 percent of the content. The quintiles drop off rapidly from there.
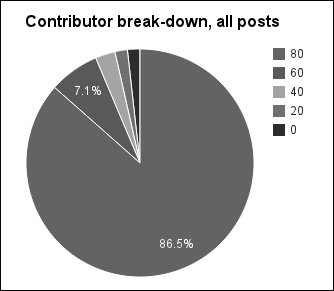
And we can pull these into a graph to be able to see the distribution of contributors more easily.
While finding those who post questions, we can also see who are most active in asking questions.
|
Rank |
User |
Question Posts |
|---|---|---|
|
0 |
39677 |
1858 |
|
1 |
4653 |
1605 |
|
2 |
34537 |
1604 |
|
3 |
179736 |
1327 |
|
4 |
117700 |
1327 |
|
5 |
149080 |
1261 |
|
6 |
84201 |
1177 |
|
7 |
434051 |
1107 |
|
8 |
325418 |
1074 |
|
9 |
146780 |
1055 |
When we run this, it gives us a very different set of frequencies. These are more than an order of magnitude less than the frequencies for all posts.
We can also get the numbers for the distribution of questioners.
If we use quantile-on and sum-count again, we can also see the break-down by quintile. Look at the following code:
user=> (def q-counts (map (d/sum-count :q)
                          (d/quantile-on 5 #(:rank (:q %)) users)))
user=> (def total (reduce + 0 q-counts))
user=> q-counts
(5182709 711037 318890 262051 0)
user=> (map #(float (/ % total)) q-counts)
(0.80045706 0.109817974 0.049251802 0.040473152 0.0)
And the following is the graph for this group:
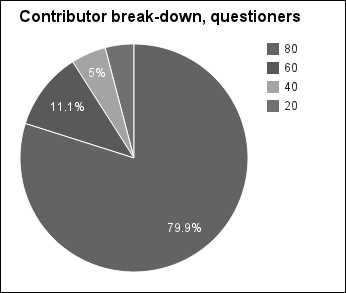
Interesting. So the lowest quintile doesn't contribute anything. Presumably, those are the users who answer questions. We'll look at this group more in a minute. But overall, the distribution of those asking questions follows what we'd expect from the 80/20 rule.
Because most of the posts are answers, we can expect that these frequencies will be closer to the aggregate frequencies. We'll find this similarly to how we found the frequencies of those asking questions.
Look at the following table:
|
Rank |
User |
Answer Posts |
|---|---|---|
|
0 |
22656 |
28137 |
|
1 |
29407 |
20310 |
|
2 |
157882 |
15431 |
|
3 |
17034 |
13285 |
|
4 |
34397 |
13157 |
|
5 |
23354 |
12270 |
|
6 |
115145 |
11784 |
|
7 |
20862 |
10447 |
|
8 |
57695 |
9711 |
|
9 |
19068 |
9557 |
We can see that there is a lot of similarity between this set of numbers and the first one. And in fact there is a lot of similarity between the distribution of this set of posters and the last set, as we can see in the following screenshot:
Looking at the distribution overall, however, we can see that the question answerers are even more lopsided than the question askers.
Let us try to break down the contributors who answer the questions:
user=> (def a-counts (map (d/sum-count :a)
                          (d/quantile-on 5 #(:rank (:a %)) users)))
user=> (def total (reduce + 0 a-counts))
user=> a-counts
(10950972 413668 176148 0 0)
user=> (map #(float (/ % total)) a-counts)
(0.9488929 0.035844 0.015263082 0.0 0.0)
And the following is the graph for this data:
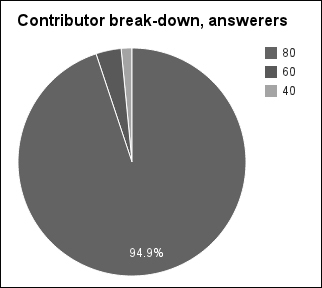
So almost half of the users never post an answer! However, the top 20 percent of users post 95 percent of the answers. So answering questions appears to be dominated by a few users, while question asking is (marginally) more widespread.
We can see even more similarity if we compare the ranks. This table shows the rank for each category of post for all of the top 10 users in any category. (Note that the ranks begin at 0, not 1.)
|
User ID |
All Post Rank |
Question Post Rank |
Answer Post Rank |
|---|---|---|---|
|
4653 |
423 |
1 |
21342 |
|
17034 |
3 |
602037 |
3 |
|
19068 |
9 |
420772 |
9 |
|
20862 |
7 |
169469 |
7 |
|
22656 |
0 |
37889 |
0 |
|
23354 |
5 |
22760 |
5 |
|
29407 |
1 |
33177 |
1 |
|
34397 |
4 |
16478 |
4 |
|
34537 |
358 |
2 |
8024 |
|
39677 |
345 |
0 |
151684 |
|
57695 |
8 |
65071 |
8 |
|
84201 |
631 |
6 |
10521 |
|
115145 |
6 |
54339 |
6 |
|
117700 |
595 |
4 |
29654 |
|
146780 |
923 |
9 |
123737 |
|
149080 |
682 |
5 |
56862 |
|
157882 |
2 |
101282 |
2 |
|
179736 |
605 |
3 |
36463 |
|
325418 |
523 |
8 |
3502 |
|
434051 |
858 |
7 |
164416 |
The data in this table makes certain points clear:
- The top-ranked users asking questions are a very different set than the top-ranked users answering questions. The top questioner was ranked 141,674th as an answerer, and the top answerer was ranked 37,887th as a questioner.
- Once we're beyond the top posters, neither subgroup correlates well with the aggregate of all posts. All of these users rank within the top 1,000 for all types of posts. This just indicates that the question answerers don't completely dominate the questioners.
These observations confirm what we found looking at the quintiles and the graphs. Both of these groups look very different from each other, and from the aggregate of the two.
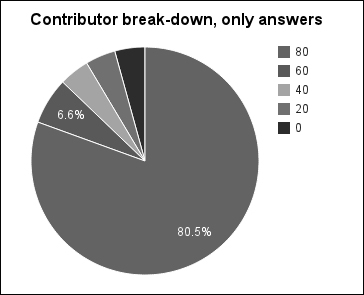
Let's break down the groups into those who only post questions, those who only post answers, and those who do both. That should give us more insight into the types of participation.
We can get the users who only post answers fairly easily, and then running the previous analyses on that subset is also not difficult. Let's see how this will work. Look at the following code:
user=> (def qs (filter #(zero? (:count (:a %))) users))
user=> (def q-counts
            (map (d/sum-count :q)
                 (d/quantile-on 5 #(:rank (:q %)) qs)))
user=> (def total (reduce + 0 q-counts))
user=> (count qs)
780460
user=> q-counts
(969148 272085 156092 156092 156092)
user=> (map #(float (/ % total)) q-counts)
(0.566916 0.15915973 0.09130809 0.09130809 0.09130809)
So first we filtered for only users who post no answers. This leaves us with 49 percent of the total number of users, so this is really an extremely large group of StackOverflow users.
However, the interesting part is that their distribution is more uniform. The most active quintile has posted less than two-thirds of the questions. The following graph makes that clear:
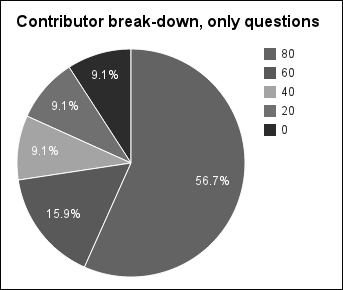
The ratios for these are much different than we've seen so far. This group is much less driven by a few users. But when you think about it, this makes sense. Many people who come to StackOverflow only post one question, and that's the extent of their interaction. In fact, the bottom three quintiles only post one question and no answers. That's almost 33 percent of the total number of users.
Let's see how this compares to those who post only answers.
Getting the users who only post answers will be almost exactly like the process we just went through. However, this time we'll switch questions and answers, of course. Look at the following code:
user=> (def as (filter #(zero? (:count (:q %))) users))
user=> (def a-counts (map (d/sum-count :a)
                          (d/quantile-on 5 #(:rank (:a %)) as)))
user=> (def total (reduce + 0 a-counts))
user=> (count as)
375667
user=> (float (/ (count as) (count users)))
0.23561831
user=> a-counts
(1413820 116198 75134 75134 75131)
user=> (map #(float (/ % total)) a-counts)
(0.80540407 0.06619396 0.042801227 0.042801227 0.042799518)
This time, we're working with a group roughly half the size of those who post only questions, roughly a quarter of the entire group of users. And the distribution of the top quintile is much closer to what we'd expect from the 80/20 rule.
Again, notice that the last few quintiles appear to have users who have only posted one answer. In fact, about 16 percent of the total number of users have posted no questions and only one answer. This seems to be one of the most curious groups, and trying to get more interaction out of them would be a priority (as I'm sure it has been for StackExchange).
The graph for this, shown following this paragraph, is somewhat between the last graph (for those who ask only questions) and the first few graphs. The first quintile is about 80 percent, but the rest don't taper off as much as they sometimes do.
Now let's look at the breakdown for the rest of the users, those who've posted both questions and answers.
The predicate needed to select those users who have posted both questions and answers will be slightly different than what we've seen in the last two sections. However, once we have those users, the analysis will be the same. The only wrinkle will be that we'll get the distribution for both questions and answers.
We'll get the users who answer both using a slightly more complicated predicate, which we will page to remove. Look at the following code:
user=> (def both (remove #(or (zero? (:count (:q %)))
                              (zero? (:count (:a %))))
                         users))
user=> (count both)
438261
Now we'll also need to compute the values for both the questions and the answers. First, let's see what the questions look like:
user=> (def bq-counts
            (map (d/sum-count :q)
                 (d/quantile-on 5 #(:rank (:q %)) both)))
user=> (def total (reduce + 0 bq-counts))
user=> bq-counts
(3450712 730467 335892 160458 87649)
user=> (map #(float (/ % total)) bq-counts)
(0.72415173 0.1532927 0.07048887 0.033673033 0.018393647)
The graph that follows makes clear that the ratios on this are more like the distribution that we'd expect:
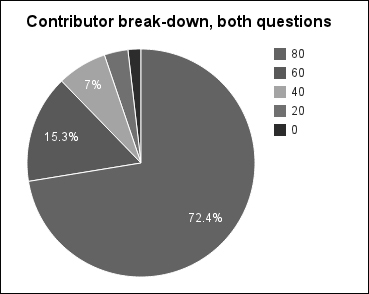
Looking at the numbers for the answers from this group, we again seem to be following a very rough approximation of the 80/20 rule. Look at the following code:
user=> (def ba-counts
            (map (d/sum-count :a)
                 (d/quantile-on 5 #(:rank (:a %)) both)))
user=> (def total (reduce + 0 ba-counts))
user=> ba-counts
(8564601 740590 270367 122164 87649)
user=> (map #(float (/ % total)) ba-counts)
(0.8752454 0.075683385 0.027629714 0.01248435 0.008957147)
And the following is the graph for this data:

So the group who has posted both questions and answers seem to be more balanced and have a more typical interaction with the website.
Another way of looking at this data is to look at how the number of questions each user posts by the number of answers each posts. This gives us an indication of how active users are in each type of activity. Look at the following graph:
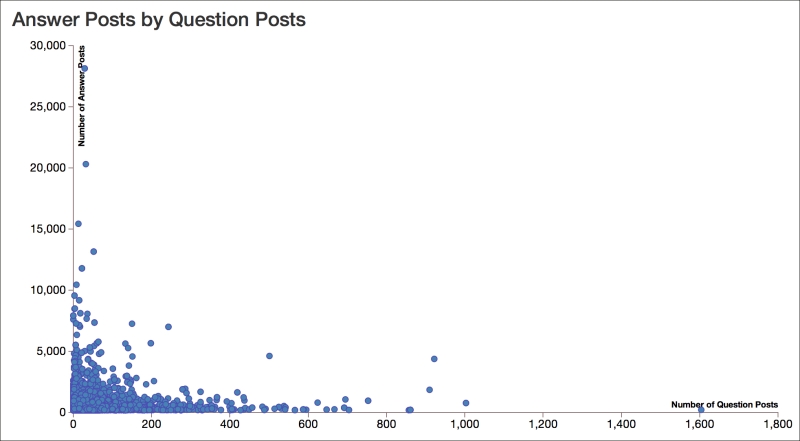
This graph makes clear that typically users engage in one type of activity or another, and there's not as much cross-over as you might have expected. Also, the scales of the axes are a bit deceiving: the y axis is over 16 times larger than the x axis.
Now that we have a better understanding of the way that users are interacting with StackOverflow and the ways that they're generating content, let's look at that content and see if we can figure out what makes a good answer and what doesn't.
Answers can be rated in a couple of different ways. The community can vote an answer up or down, and the original poster can accept an answer. For the purposes of this demonstration, we'll look at accepted answers; however, both metrics might be useful and interesting to explore.
We'll look at how we might automatically recognize answers that will be accepted.
On the one hand, this would be very useful to do. If the original poster forgets to accept an answer, the website could prompt them with a possible solution. Also, the site could send the poster an e-mail when someone posts an answer that should be considered.
But on the other hand, acceptable answers probably don't share common linguistic features that any kind of algorithm could latch on to in order to identify potential solutions. I'm doubtful that we'll be able to train an algorithm to identify acceptable answers.
Still, let's try and see how well we can actually do.
There are over 18 million posts at this point. We can always work on the full data set eventually, but to get started, let's pull out a sample of the data. To make things easier, I've uploaded a random sample of 100,000 answers on http://www.ericrochester.com/mastering-clj-data/data/post-sample-100000.json.gz. These have been transformed into the data structure that we'll use everywhere.
You can download these with curl and decompress it with gzip as follows:
$ curl -O http://www.ericrochester.com/mastering-clj-data/data/post-sample-100000.json.gz
$ gunzip post-sample-100000.json.gz
We'll put the code for this section into the src/social_so/post.clj file, and at the top we'll add the following namespace declaration:
(ns social-so.post
  (:require [clojure.java.io :as io]
            [clojure.data.json :as json]
            [social-so.data :as d]
            [social-so.utils :as u]
            [social-so.xml :as x]))
To represent the data that we'll work with, we'll use the PostInfo record type. Look at the following code:
(defrecord PostInfo
  [id post-type body-text score accepted-for])
The interesting fields here are body-text, which contains the answer's text, stripped of HTML, and accepted-for, which is nil if the post isn't accepted or contains the question's ID, if the post was accepted for its question.
This is a flat data record, so it's easy to load the JSON data into these structures. Look at the following code:
(defn load-post-infos [filename]
  (with-open [r (io/reader filename)]
    (doall
      (->> (json/read r :key-fn keyword)
        (map map->PostInfo)
        (map #(assoc % :post-type (keyword (:post-type %))))))))
And now we can read the data on the REPL, assuming we've aliased this namespace to p. Look at the following code:
user=> (def s (p/load-post-infos "post-sample-100000.json"))
user=> (count s)
100000
user=> (count (filter :accepted-for s))
21250
user=> (count (remove :accepted-for s))
78750
user=> (pprint (first s))
{:id 1146880,
 :post-type :a,
 :body-text
 "But while processing i cancelled the transaction.  WP - Basically, if it was a transaction, and you canceled it before it finished, then whatever had started would have been undone. What your database looks like now should be the same as it looked before the UPDATE.",
 :score 0,
 :accepted-for nil}
Looking at these briefly, we can see that just over 20 percent of the posts in the sample were accepted.
Now that the data is in a usable form, let's turn our attention to categorizing the posts. To do this, we'll use MALLET (http://mallet.cs.umass.edu/). We saw MALLET before in Chapter 3, Topic Modeling – Changing Concerns in the State of the Union Addresses, on topic modeling. That's usually the task that this library is used for. However, it also provides an implementation of a number of classification algorithms, and we'll use one of those now.
Over the course of this chapter, we'll categorize the posts as what MALLET calls instances. This will divide them into categories based on features, or clues within each instance. We'll use MALLET to take each post, create an instance from it, identify its features and categories, and finally use those to train a classifier. We can later use this classifier on new posts.
We'll use a new namespace for this code. Open the file src/social_so/nlp.clj and add the following namespace declaration to the top of the file:
(ns social-so.nlp
  (:import [cc.mallet.types Instance InstanceList]
           [cc.mallet.pipe
            Input2CharSequence TokenSequenceLowercase
            CharSequence2TokenSequence SerialPipes
            Target2Label FeatureSequence2FeatureVector
            TokenSequenceRemoveStopwords
            TokenSequence2FeatureSequence]
           [cc.mallet.pipe.iterator ArrayDataAndTargetIterator]
           [cc.mallet.classify NaiveBayes NaiveBayesTrainer Trial]
           [cc.mallet.classify.evaluate ConfusionMatrix]))
That's a lot of imports. But really, that's the most complicated that this code will be. MALLET does a lot of the heavy lifting for us.
In the code to come, we'll refer to this in the REPL with the n prefix. To make this available, execute the following line (after the user=> prompt) in your REPL environment:
user=> (require '[social-so.nlp :as n])
Now we're ready to start filling in the blanks.
MALLET represents each input as an Instance object. Instance objects contain their data, a target label, name, and other metadata.
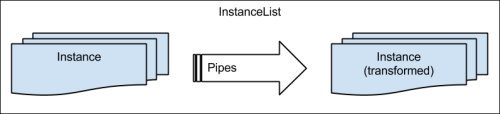
MALLET works on collections of Instance objects as an InstanceList, which is just a collection of Instance objects. All the instances in the list are processed using the same pipe of transformations.
Each step in the pipe changes one property of each Instance object in the list. For example, one pipe (CharSequence2TokenSequence) tokenizes the input, and another (Target2Label) creates an index of the target labels.
The following figure illustrates this process:
For the features in the documents and their labels, the InstanceList also maintains alphabets. These are indexes from the input strings to integers. The integers serve to distinguish the inputs and also act as indexes in arrays. This allows MALLET to work with frequencies as an array, which saves both space and processing time. The trick is that all of the Instance objects being processed must share the same alphabet. The InstanceList makes sure that they do.
For our processing, to make clear what transformations we'll use, we'll define them all in a function named make-pipe. The following is that function:
(defn make-pipe []
  (SerialPipes.
    [(Target2Label.)
     (Input2CharSequence. "UTF-8")
     (CharSequence2TokenSequence.
       #"p{L}[p{L}p{P}]+p{L}")
     (TokenSequenceLowercase.)
     (TokenSequenceRemoveStopwords. false false)
     (TokenSequence2FeatureSequence.)
     (FeatureSequence2FeatureVector.)]))
What's happening here? Let's take the steps apart.
Target2Labelbuilds the alphabet for theInstanceobjects' target property.Input2CharSequencereads the input from a string, file, or URL named in the data property and replaces it with the resource's content.CharSequence2TokenSequencetokenizes the string in the data property.TokenSequenceLowercaselowercases the tokens in the data property.TokenSequenceRemoveStopwordsfilters out stop words (common words) from the tokens in the data.TokenSequence2FeatureSequencecreates the alphabet of tokens and convert the sequence of tokens to a sequence of feature indexes.FeatureSequence2FeatureVectorconverts the sequence of feature indexes to a vector for a bag-of-words approach.
So, at the end of this pipeline, each document will be represented by a vector indicating how many times each feature appears in that document. Features can be almost anything, but usually they are words that appear in the document or metadata (author, date, tags) associated with that document. This is the format that the classifiers—as well as many other machine learning and natural language algorithms—expect.
This handles the processing of the Instance objects, but before we can do that, we'll need to convert the PostInfo objects into Instance objects.
MALLET has a number of classes that do this from more primitive data types. They take some kind of collection of primitive inputs and iterate over the Instance objects they represent. In our case, we'll use ArrayDataAndTargetIterator. This iterates over two string arrays. One contains each input's data, and the other contains each input's target.
We'll wrap creating this with the function post-info-iterator. This uses the accepted-tag function to decide whether the post was accepted or not and tag it appropriately. Look at the following code:
(defn accepted-tag [post-info]
  (if (:accepted-for post-info) "accepted" "not"))
(defn post-info-iterator [post-infos]
  (ArrayDataAndTargetIterator.
    (into-array (map :body-text post-infos))
    (into-array (map accepted-tag post-infos))))
Once we have these functions, we can use them to populate an InstanceList that will run all the documents through the transformation pipeline that we defined earlier. Look at the following code:
(defn post-info-instances [post-infos]
  (doto (InstanceList. (make-pipe))
    (.addThruPipe (post-info-iterator post-infos))))
Now we're ready. Let's pick up with the PostInfo sample that we extracted earlier and bound to s in the Processing the answers section. This contains a sequence of PostInfo instances. In the REPL, we can create an InstanceList using the functions that we just defined as follows:
user=> (def ilist (n/post-info-instances s))
Now we can think about how we're going to use these documents to train and test a classifier.
Now that we've processed our data into a format that MALLET can use, we'll divide the input corpus into a test set and a training set. We can use different relative sizes for each, but often we'll train on more documents than we'll test on.
MALLET's InstanceList class has a split method, but we'll define a thin wrapper over it to make it easier to use. MALLET's split method takes an array listing the proportions of the total for each group. Since we only want two groups that completely divide the input, we can pass in the proportion for one group and compute the value of the other group's proportion. We'll also return a hash-map indicating which of the output lists is for testing and which is for training.
The following is the split-sets function that acts as the wrapper:
(defn split-sets [test-ratio ilist]
  (let [split-on (double-array [test-ratio (- 1.0 test-ratio)])
        [test-set training-set] (.split ilist split-on)]
    {:test test-set, :training training-set}))
And we can use the following on the command line to divide the input:
user=> (def tt-sets (n/split-sets 0.2 ilist))
Now we're ready to use these for training and testing.
Before we can use a classifier, we have to train it on the training set that we just created.
For this example, we'll create a Naive Bayesian classifier. Again, we'll just create a thin wrapper function. In this case, it's not that significantly simpler than creating the Bayesian trainer and calling it on the data. However, it will allow us to use the trainer without having to tease out which MALLET packages we have to import. This allows us to require our social-so.nlp namespace into the REPL and execute the entire process.
The following is the wrapper:
(defn bayes-train [ilist] (.train (NaiveBayesTrainer.) ilist))
And we can use the following in the REPL to get a trained Bayesian classifier:
user=> (def bayes (n/bayes-train (:training tt-sets)))
That's it. We've trained our classifier. Now let's see how to use it.
To test the classifier, MALLET provides a Trial class that encapsulates running a classifier over some inputs that are already tagged. It provides counts over how accurate the classifier is and calculates statistics to show how well it does.
To make it easier to load the development environment and to use this class, we'll create a factory function for it as follows:
(defn trial [classifier ilist] (Trial. classifier ilist))
And now let's use this function at the REPL as follows:
user=> (def trial (n/trial bayes (:test tt-sets)))
Well, great. Now what can we do with this?
There are several factors to consider when evaluating a classifier's ability to identify inputs as belonging to category X. Let's consider what they are and see how we can get them from the Trial object.
First, we need to think about the classifier's precision or positive predictive value (PPV). This takes into account how many items the classifier incorrectly included in category X, and it's given by the ratio of the true positives with all labeled positive. In our case, that means the number of items that were correctly identified as accepted divided by all of those identified as accepted. You can get this using the getPrecision method, as follows:
user=> (.getPrecision trial "accepted")
0.2837067983289024
So we can see that it correctly identified the accepted rows rather poorly.
The next number that we need to consider is the classifier's recall. This is sometimes referred to as its sensitivity or true positive rate (TPR). This is the percentage of all positives that it found, and it's found by dividing the true positives by the true positives and the false negatives. MALLET exposes this with the getRecall method as follows:
user=> (.getRecall trial "accepted")
0.1808716707021792
In this case, the recall is actually worse than the precision, which is saying something.
Next, we'll consider the accuracy (ACC) of the classifier. This is the ratio of true classifications, both positive and negative, to the total number of items. This is rendered from the getAccuracy method. Look at the following code:
user=> (.getAccuracy trial)
0.73655
Presumably, this classifier's precision and recall are better when identifying not-accepted answers. Let's test that as follows:
user=> (.getPrecision trial "not")
0.8052052743709334
user=> (.getRecall trial "not")
0.881159420289855
These results aren't great. A simple baseline that classifies everything as not accepted would actually score slightly better than this (80 percent). The criteria involved in accepting an answer don't appear to be captured by the simple token features that we've used here.
The performance here is likely because not accepted is the default state for an answer, and the status of most answers.
There's one final number that we want to pay attention to. The F1 score is a measure of the classifier's accuracy. This combines the precision and recall into a single number ranging from 0 (poor) to 1 (perfect). Look at the following code:
user=> (.getF1 trial "accepted")
0.22090788111784712
Again, we can see that the classifier doesn't do a good job.
We can get more detailed information about how well the classifier did by looking at its confusion matrix. This is a matrix that breaks down how many items are predicated to be in both categories, and how many actually are.
MALLET has a ConfusionMatrix class for displaying these charts. We'll again wrap that class in a function to make it easier to call. Look at the following code:
(defn confusion-matrix [trial] (str (ConfusionMatrix. trial)))
This generates the confusion matrix and returns it as a string. Let's call this and print the matrix out as follows:
user=> (println (n/confusion-matrix trial))
Confusion Matrix, row=true, column=predicted  accuracy=0.73655
       label   0   1  |total
  0      not 13984 1886  |15870
  1 accepted 3383 747  |4130
Now we can see where the numbers came from. Rows are the actual classes, and columns are how the classifier predicted the classes. The true positives in the lower right-hand side are much smaller than the total number of positives in the bottom row. On the other hand, the true negatives in the upper left-hand side are the majority of the total number of negatives in the top row.
Naive Bayesian classifiers don't perform well here, but it's possible (although unlikely) that other classifiers might. It's also possible that adding more metadata as features might help. For example, the length of time between when the question was posted and when the answer was posted might be fruitful. Other features that might help are the length of the answer or the answerer's reputation. Reputation is the points awarded for accepted answers, though, so including them introduces circularity – we'd be training directly on what we're attempting to classify.